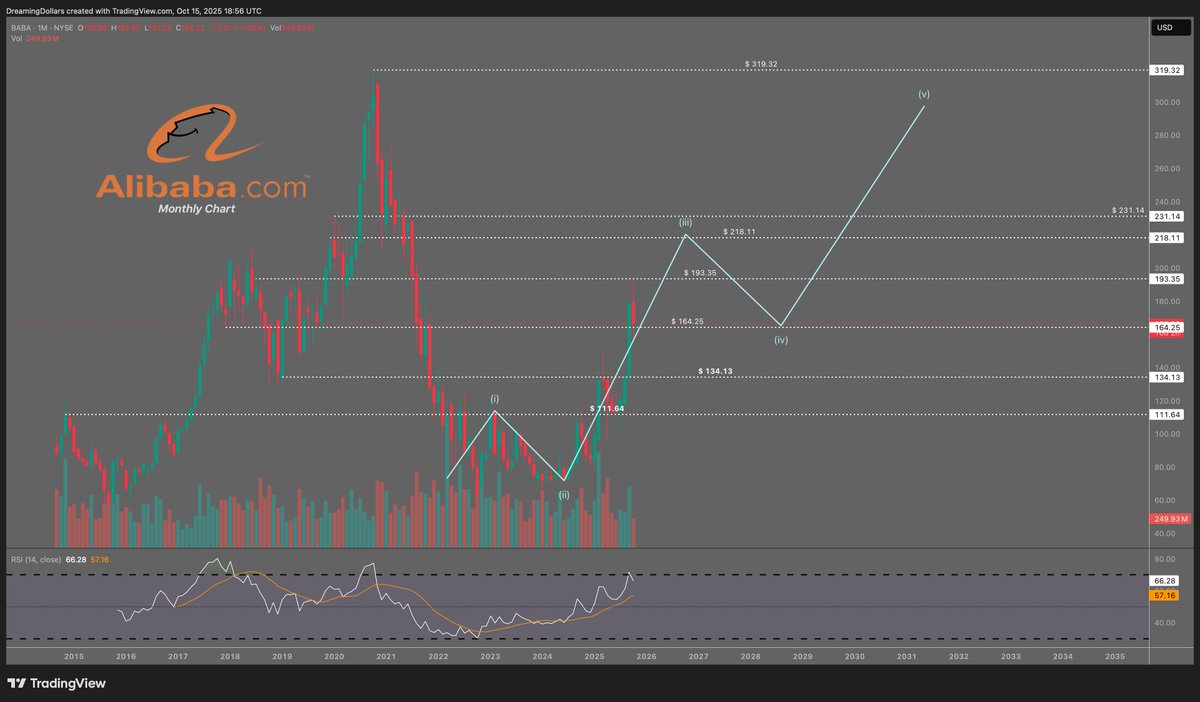
$BABA Monthly - October 15, 2025 (Update)
Wave (iii) remains structurally intact despite a quick retracement to the 0.236 Fibonacci level at $164.25.
The recent rejection at $193 reflects a measured pullback within the ongoing impulsive phase, reinforcing the integrity of the broader upward trend.
Wave (iii) target remains at $218. NFA.
#BABA #ElliottWave #TechnicalAnalysis #Investing #Stocks #MarketOutlook #PriceAction #TradingView #SwingTrading #TradeIdeas
$BABA Monthly - September 11, 2025 (Update)
Remember when everyone was hating on Alibaba?
Since then, price has advanced from $116 → $156 (+34%) ✅
The Elliott Wave structure remains intact, with some upside levels to monitor from here:
🔹 $164 (+5%)
🔹 $193 (+23%)
🔹 $218 (+39%) 🚀
The broader count projects a potential move toward $319 (+104% from current levels).
NFA.
#BABA #ElliottWave #Stocks #ChartUpdate
$BABA Monthly - September 11, 2025 (Update)
Remember when everyone was hating on Alibaba?
Since then, price has advanced from $116 → $156 (+34%) ✅
The Elliott Wave structure remains intact, with some upside levels to monitor from here:
🔹 $164 (+5%)
🔹 $193 (+23%)
🔹 $218 (+39%) 🚀
The broader count projects a potential move toward $319 (+104% from current levels).
NFA.
#BABA #ElliottWave #Stocks #ChartUpdate
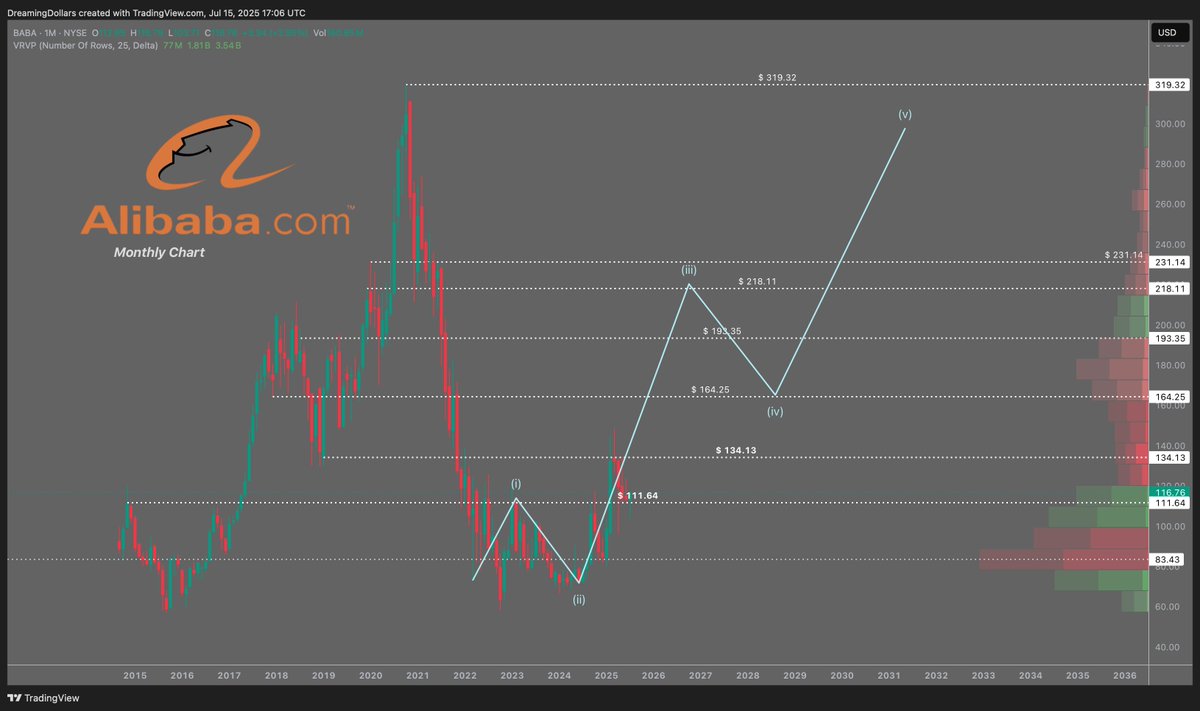
📈 $BABA Monthly – July 15, 2025
Personally in this trade 📌
Holding above $111 support — watching for a long-term reversal!
Wave (ii) in at $83. Targets: $134, $164, $218 🚀
NFA.
#BABA#ChartAnalysis#ElliottWave#Stocks#USStockMarket
$HOOD 1H Chart 📈
Just cleared $100.88, in a strong uptrend with incredible momentum.
Looking to scale into a Full Position on a $100 retest.
🎯 Targets: $108 and $112
🛑 Setup invalid below the $95.50 Fib Cluster
RSI looks healthy, no signs of slowing yet. Letting it run. 🚀
NFA.
#HOOD #SwingTrading #Breakout #TechnicalAnalysis #Stocks
📈 $BABA Monthly – July 15, 2025
Personally in this trade 📌
Holding above $111 support — watching for a long-term reversal!
Wave (ii) in at $83. Targets: $134, $164, $218 🚀
NFA.
#BABA#ChartAnalysis#ElliottWave#Stocks#USStockMarket
🚀 $COF 45-Min;
Cooling off after a massive move here!
Ideally, I’d want to see a constructive pullback into the $214–$212 demand zone before considering any additional entries.
Key Levels I'm Watching:
- $ 221.22
- $ 218.70
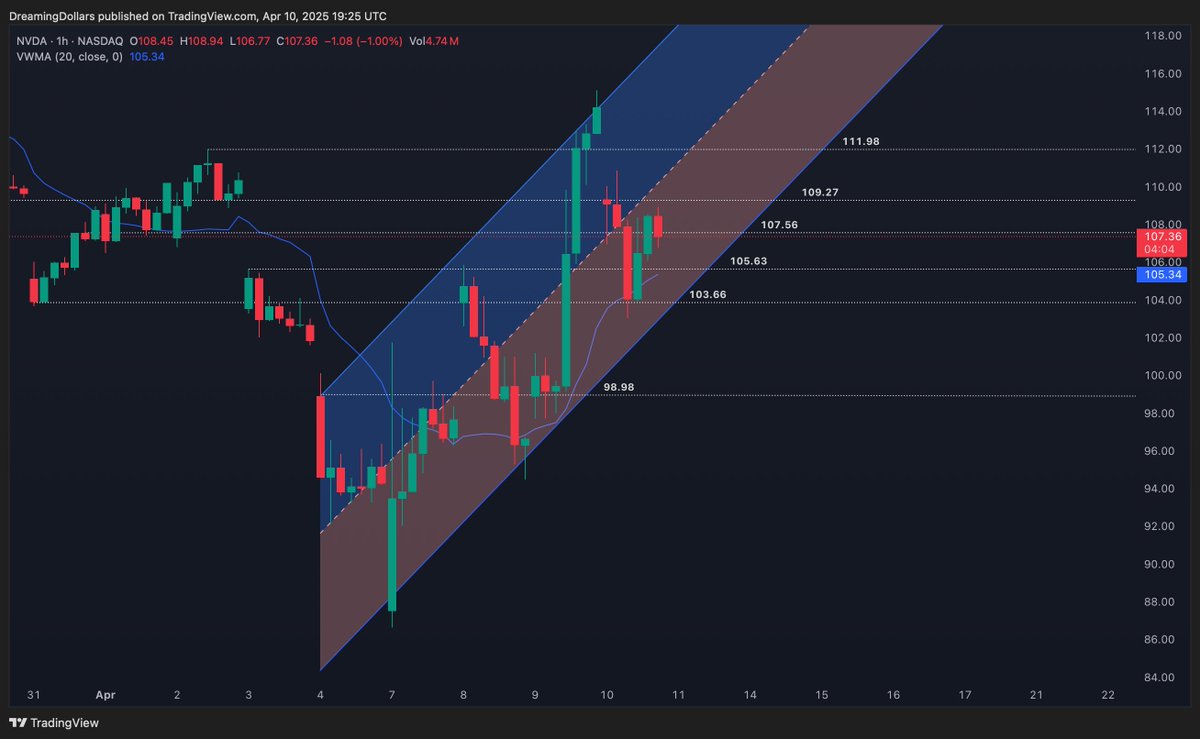
$NVDA 1H
Despite current economic volatility, price levels are finding support along the lower deviation of an upward regression channel and the 20-period VMWA, potentially signaling short-term price stabilization.
$TSLA 3 Minute
Entered Weekly 260P contracts following a clean retest and breakdown of the 273.45 support level.
The move provided a clean hit on the take-profit target, delivering an impressive 7.63 risk/reward ratio.
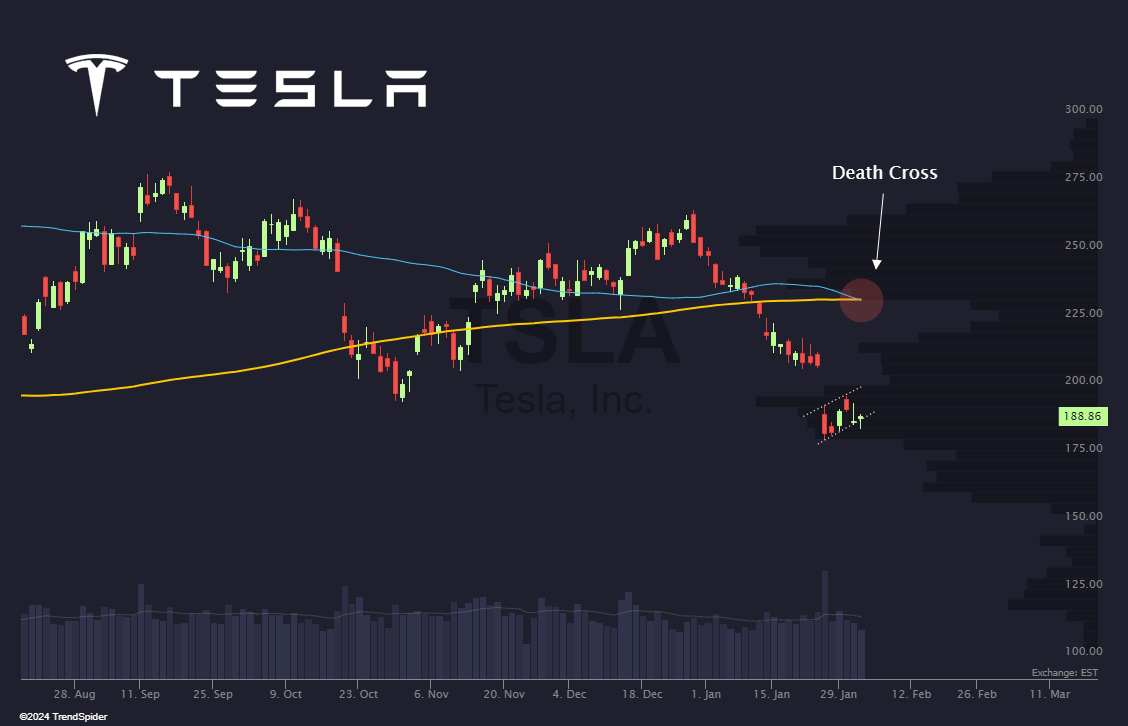
$TSLA Daily
Price action is breaking down from yesterday’s close, aligning with the regression.
Ideally, I’d prefer to see a more constructive pullback toward the lower deviation of the red range before considering any long entries.
Key Levels To Watch:
• 256.65
• 222.15
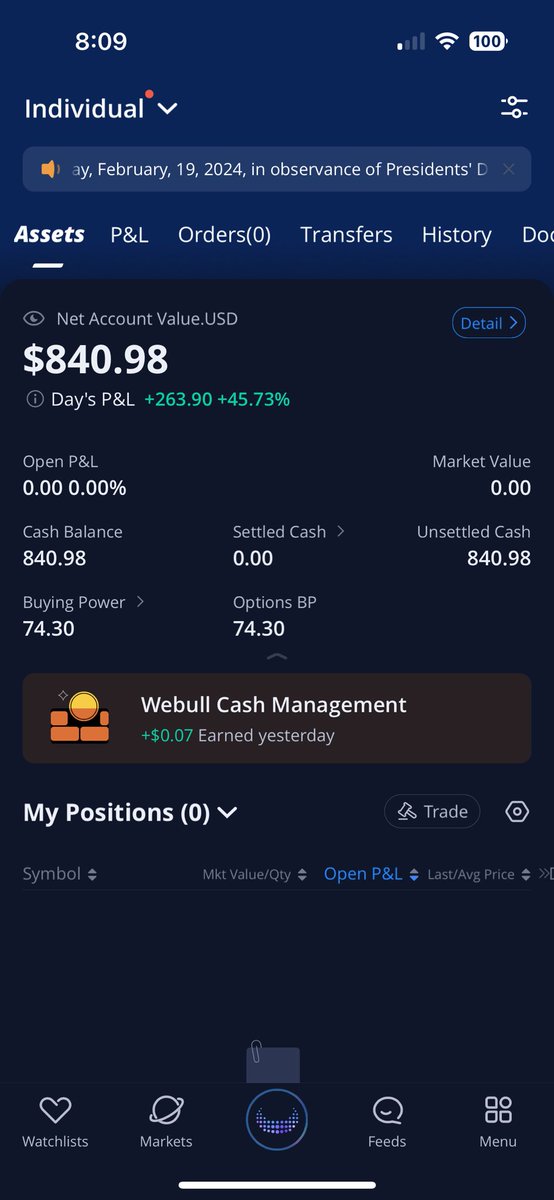
Small Account Challenge Day 1:
Session Start: $577.08
Session Close: $840.98
DAY PL: +263.90 (+45.73%)
Overtrading & Overstaying led to a lot of profitable trades closing in red 🥲
$SPY #DayTrading#OptionsTrading
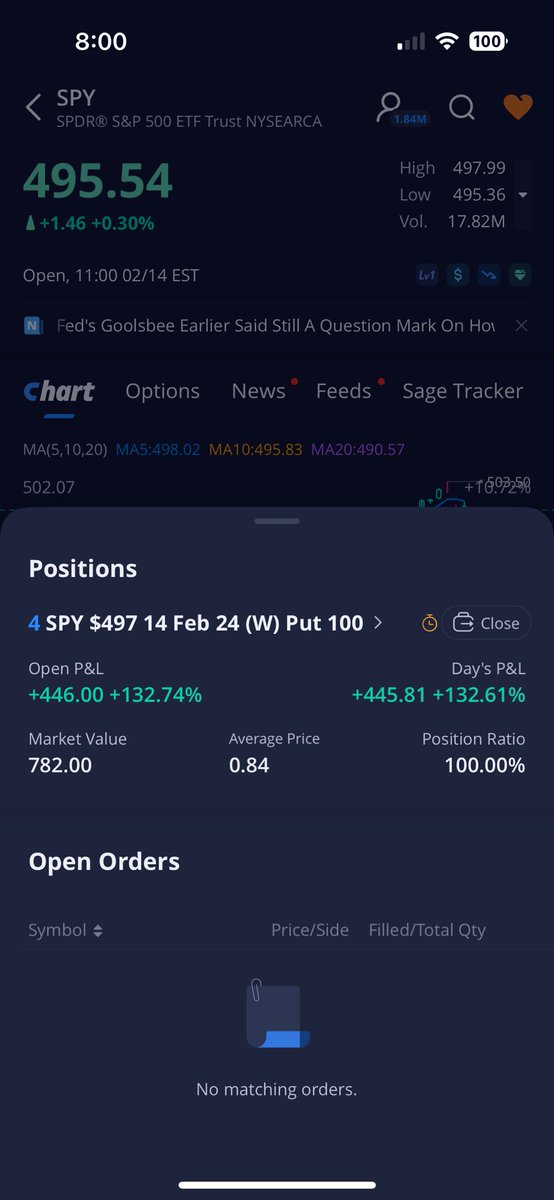
$SPY Trade Recap: It's always refreshing to trade based on candlestick patterns. Understanding basic bullish and bearish reversals without the reliance of support and resistance levels allow for more flexibility in trading style!