Bitcoin
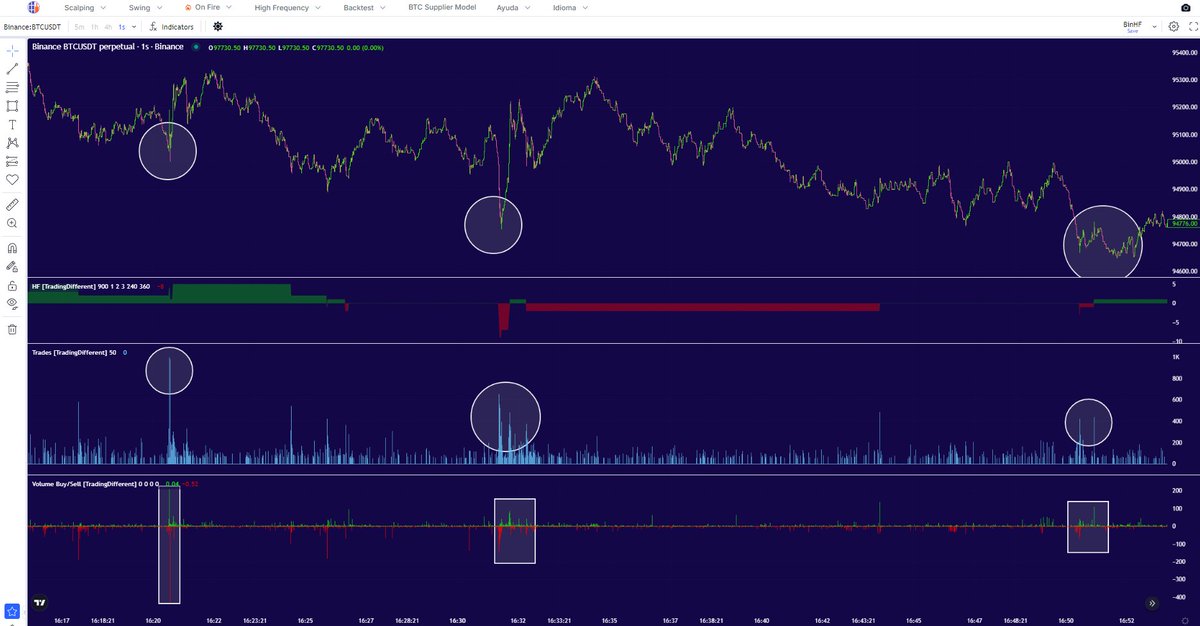
You may have heard us say that the crypto market "lacks liquidity." 80% of the time, the price is manipulated to liquidate positions. We explain why this happens, the battle between bots, and how this affects your trading.
El indicador tendencial Trendiff simplifica la lectura del mercado y optimiza las entradas alineadas con la tendencia principal.
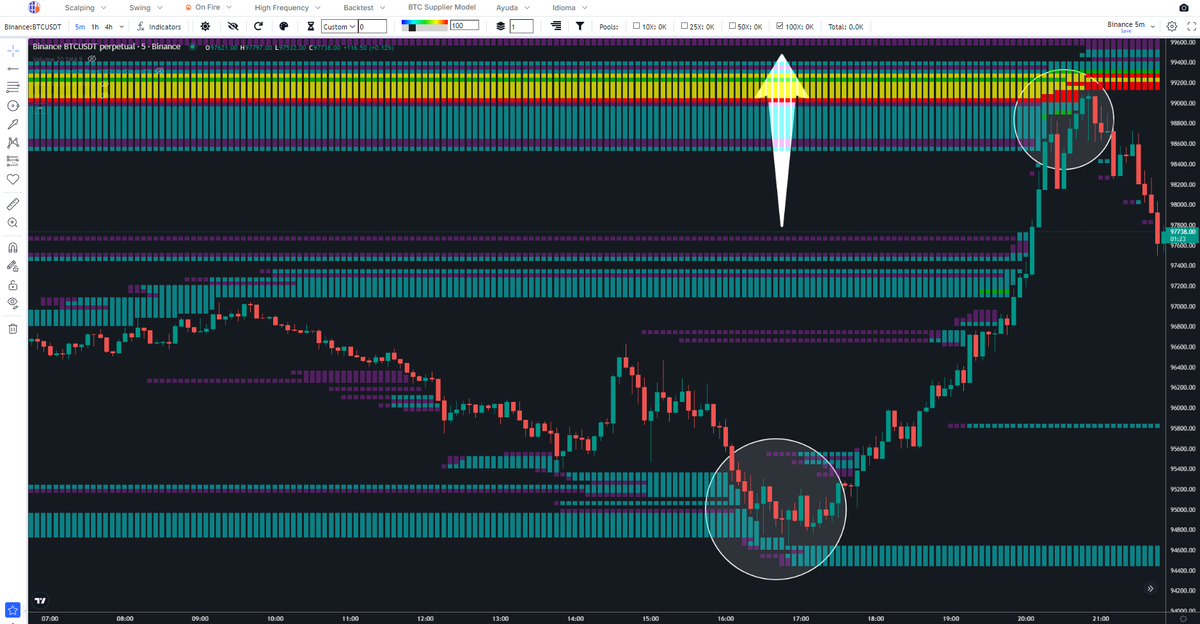
Anticipar posibles escenarios ofrece una ventaja significativa frente a la mayoría de los operadores minoristas, al tener presente que la liquidez actúa como un imán que atrae al precio hacia zonas clave, como en este ejemplo. #Bitcoin
https://t.co/yO2BC48swq
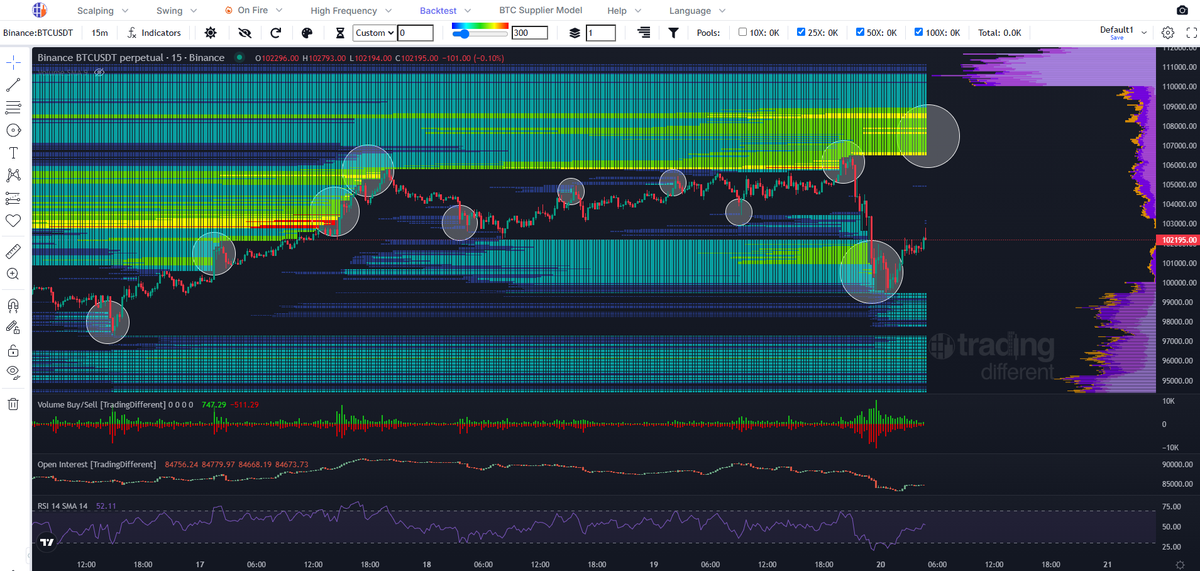
Backtest #Bitcoin 19/09/22
Operar de manera profesional requiere mucho más que intuición: exige datos, estadísticas y procesos validados.
Analizar el comportamiento histórico del mercado es fundamental para desarrollar estrategias cuantificables y con ventaja estadística. En este sentido, la herramienta de Backtest se convierte en un recurso clave, permitiendo evaluar el rendimiento potencial de una estrategia antes de exponer capital en el mercado real.
https://t.co/seCsXnCMSv
⚠️ $EURUSD | Scalping liquidation map
Price: 1.1235
🔺 Shorts at risk above:
• 1.1240–1.1260: a high-leverage pocket right above price
• ~1.1273–1.1285: a strong spike, the closest big target
• 1.1350–1.1390: the densest block above
• ~1.1410: another spike further up
🔻 Longs at risk below:
• 1.1175–1.1205: mostly high/max leverage
• 1.1140–1.1170 and ~1.1109: intermediate clusters
• 1.1005–1.1083: the main block, with the biggest spike on the map near 1.1050
📊 Cumulative volume is balanced, with slightly more liquidity above (~84K) than below (~78K). The difference is distance: the shorts are packed close to price.
The map doesn't predict direction. It shows where leveraged positions would be liquidated if price reaches those levels.
Do your own monetary analysis with Trading Different.
👉 https://t.co/NgNxnzc78j
#EURUSD #Forex #Trading #Liquidations
📊 #BTC | Aggregated data in 1h
BTC pushes to a $84,875 high and is now trading at $84,359. It's the top of the range, which bottomed at $79,732.
🔹 Open Interest: $40.94B. It broke above $40B for the first time in weeks, so leverage is coming in hard with the rally.
🔹 Coinbase spot: a spike near 110M on the breakout candle, the biggest of the period, beating even yesterday's.
🔹 Liquidations: the move only flushed moderate shorts, around $20–25M, both today and on Oct 20.
🔹 Hyperliquid: a peak near 350M during the push, now at 31M.
Spot started it and leverage is joining in. With OI at the range highs, the market is more exposed in both directions.
Do your own monetary analysis with Trading Different.
👉 https://t.co/NgNxnzc78j
#Bitcoin #BTC #Crypto #Liquidations #OpenInterest
📍 bitcoin:native | Llegó al bloque de shorts
Bitcoin subió hasta 84.875 y entró de lleno en la franja más cargada de shorts, alrededor de 84.517. Ahora cotiza en 84.382, justo en esa zona. En el recorte, el mínimo es 79.732.
🔺 Arriba: el bloque de shorts, entre 84.300 y 86.400, se empezó a barrir, pero sigue cargado por encima del pico.
🔻 Abajo:
• 80.000–80.500: franjas nuevas y chicas.
• 78.400–79.700: un bloque amplio de longs, que se armó debajo del barrido del día 15 en 79.708.
Así como el día 15 el precio fue a buscar los longs y reaccionó, hoy hizo lo mismo con los shorts.
El mapa no indica la dirección del precio. Muestra dónde están las posiciones apalancadas que serían liquidadas si el precio llega a esos niveles.
#BTC
🔗 https://t.co/gowViv1pSt
📍 ethereum:native | Mapa de liquidaciones en 1h
Ethereum sube a 2.506 y se mete en las franjas de shorts de la zona de 2.480–2.530. En el recorte, el máximo es 2.578 y el mínimo 2.313.
🔺 Arriba:
• 2.540–2.560: una franja de shorts.
• 2.580–2.640: otra más ancha, por encima del máximo del recorte.
🔻 Abajo, entre 2.140 y 2.313: el bloque de longs sigue siendo el más pesado del mapa. El núcleo, en rojo, está en 2.269, a un ~9% del precio.
⚖️ La suba va a buscar liquidez arriba. La mayor concentración del mapa sigue lejos, abajo.
El mapa no indica la dirección del precio. Muestra dónde están las posiciones apalancadas que serían liquidadas si el precio llega a esos niveles.
#ETH
🔗 https://t.co/gowViv1XI1
@Quaocchoo Siguiendo la actualización de hoy, el precio en definitiva termino liquidando la zona de los 83k. ya veremos si se devuelve a la zona inferior.
BTC on #Hyperliquid 15 min chart 📊
Bitcoin is trading near $82,906 and keeps a bullish structure after the strong recent push, though it is now pausing near the highs. ⚖️📈
Above, $83,500 is the next level to follow and would come into play if buying volume manages to extend the advance. 🎯🚀
Below, $81,250 holds the most relevant liquidity zone, which could act as a magnet if selling pressure gives back a good part of the gains. 📉🧲
See the Liquidation Heatmap here:
👉 https://t.co/NFopP93nNQ
#BTC #Bitcoin #Crypto #LiquidationHeatmap #BitcoinTrading
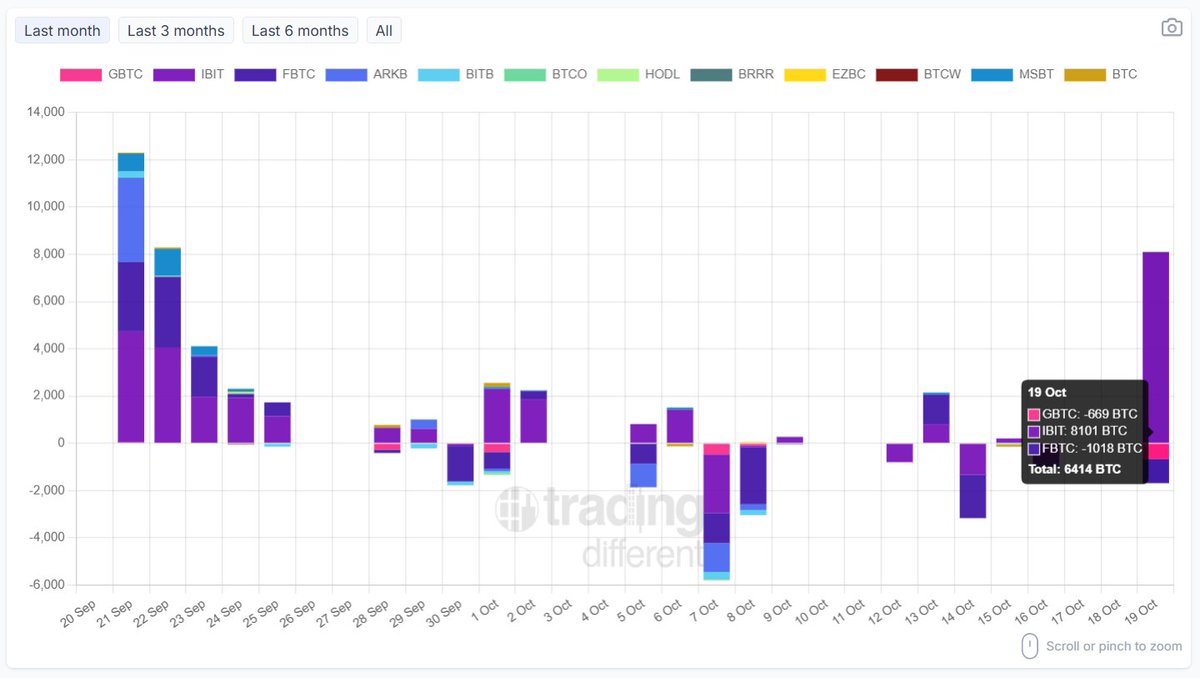
📊 #BTC | Bitcoin spot ETF flows · Oct 19
🟢 Net flow: +6,414 BTC
By fund:
• IBIT: +8,101 BTC
• FBTC: –1,018 BTC
• GBTC: –669 BTC
(Checked: 8,101 – 1,018 – 669 = 6,414 BTC)
📈 Context:
• It's the biggest net inflow since Sep 22 (~+8,300 BTC). IBIT alone took in more than any single fund on any day of the month.
• It breaks a first half of October that leaned to outflows.
• It lines up with today's move, which was led by Coinbase spot volume.
Track ETF holdings with Trading Different.
👉 https://t.co/X3ckxWttOO
#Bitcoin #ETF #Crypto #BTC
📊 #BTC | Aggregated data in 1h
BTC trades at $82,956 after today's sharp jump from ~$81.3K to ~$83.5K. The range runs from a $79,732 low to a $84,340 high.
🔹 Open Interest: $38.91B, rising with the move and peaking near $39.2B, the highest level since early October.
🔹 Coinbase spot: a spike of ~100M on the jump candle, the biggest of the whole period. Spot demand led the move.
🔹 Hyperliquid: it also spiked, to ~450M, and has calmed down to 27.8M.
This move was driven by spot with leverage coming in behind it. Just above sits the heaviest short block on the map, at $84.4K–$86.5K.
Do your own monetary analysis with Trading Different.
👉 https://t.co/NgNxnzcEXR
#Bitcoin #BTC #Crypto #Liquidations #OpenInterest
📍 ripple:native | Mapa de liquidaciones en 1h
XRP cotiza en 1,3357 después de un pico hasta ~1,345 hoy. En el recorte, el máximo es 1,4209 y el mínimo 1,2553.
⚡ La caída del día 18 barrió la parte alta del bloque de longs, entre 1,26 y 1,29.
🔻 Abajo, entre 1,16 y 1,255: sigue activo el resto del bloque, que es el más pesado del mapa. El núcleo, en rojo, está en 1,2413, a un ~7% del precio.
🔺 Arriba:
• ~1,36 y ~1,38: líneas finas de shorts.
• 1,41–1,44: una franja más cargada, alrededor del máximo del recorte.
El mapa no indica la dirección del precio. Muestra dónde están las posiciones apalancadas que serían liquidadas si el precio llega a esos niveles.
#XRP
🔗 https://t.co/gowViv1XI1
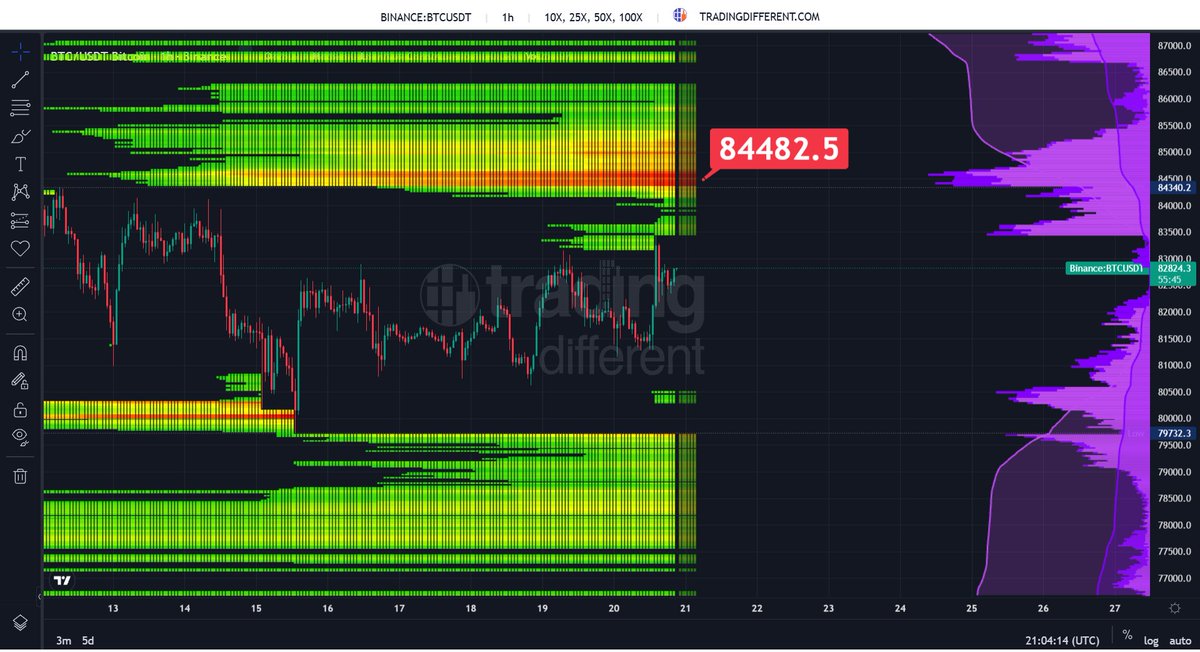
📍 bitcoin:native | Mapa de liquidaciones en 1h
Bitcoin cotiza en 82.824 después de un pico hasta ~83.500 hoy, que mordió la franja de shorts de esa zona. En el recorte, el máximo es 84.340 y el mínimo 79.732.
🔺 Arriba, entre 84.300 y 86.500: el bloque de shorts creció y es el más intenso del mapa. El núcleo, en rojo, está en 84.482, a un ~2% del precio.
🔻 Abajo:
• ~80.500: una franja chica.
• 77.000–79.700: un bloque amplio de longs que se armó después del barrido del día 15.
⚖️ Hoy el imán más cercano y más cargado está arriba.
El mapa no indica la dirección del precio. Muestra dónde están las posiciones apalancadas que serían liquidadas si el precio llega a esos niveles.
#BTC
🔗 https://t.co/gowViv1pSt
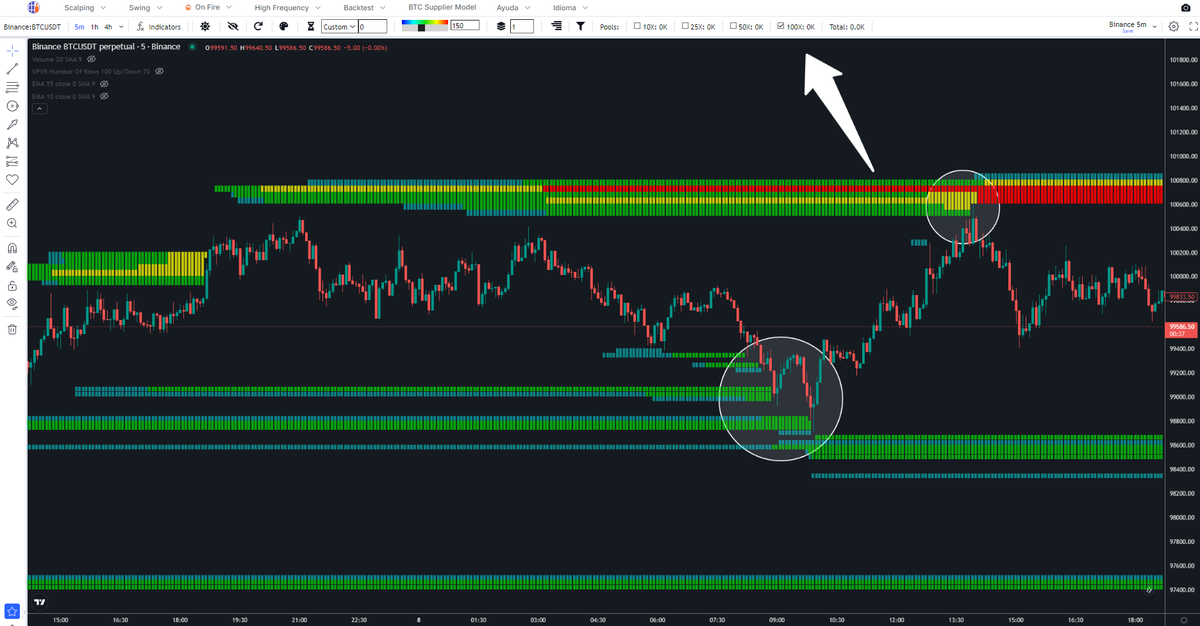
Herramientas como Liquidation Heatmap y High Frequency permiten anticipar áreas clave, otorgándole al trader una ventaja real al momento de proyectar movimientos y operar con mayor precisión. #Bitcoin Ejemplo:
https://t.co/tGg6BV3LgC
El backtesting es fundamental en el desarrollo de una estrategia de trading sólida.
La herramienta #Backtest te permite elegir días específicos para estudiar el comportamiento del precio, identificar patrones recurrentes y evaluar el rendimiento de tus estrategias antes de aplicarlas en tiempo real. #Bitcoin
https://t.co/seCsXnDkI3
🚨 COMING SOON: CYBER MONDAY AT TRADING DIFFERENT 🚨
One of the most anticipated times of the year is around the corner, and we are preparing something very special for the entire community 🔥.
If you’ve been waiting for the perfect moment to take the leap and take your trading to the next level, keep an eye on our notifications 📊👀.
⏳ Stay tuned...
🌐 https://t.co/rcQASCzKFK
🚨 COMING SOON: CYBER MONDAY EN TRADING DIFFERENT 🚨
Se viene una de las fechas más esperadas del año y estamos preparando algo muy especial para toda la comunidad 🔥.
Si estabas esperando el momento ideal para dar el salto y llevar tu trading al siguiente nivel, mantente atento a nuestras notificaciones 📊👀.
⏳ Muy pronto...
🌐 https://t.co/rcQASCAivi
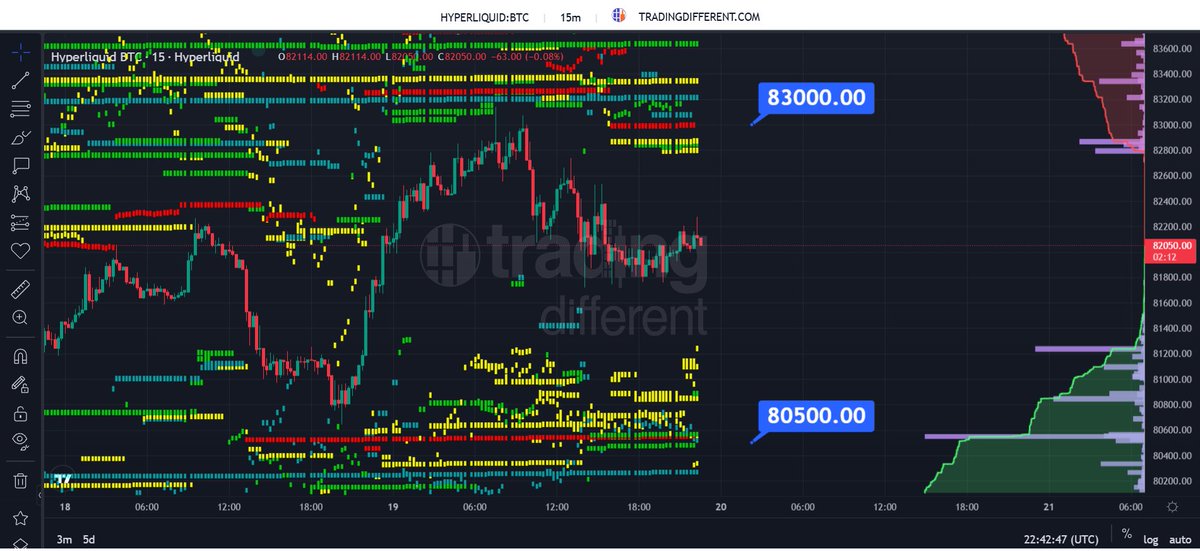
BTC on #Hyperliquid 15 min chart 📊
Bitcoin is pulling back after reaching levels above $83,000, leaving a corrective structure that could extend. ⚖️📉
On the downside, around $80,500 sits the most loaded liquidity zone, which could act as a magnet if selling pressure intensifies. 📉🧲
On the upside, $83,000 is the zone to watch, and it would come into play if buying volume steps in and pushes price toward higher levels. 🎯🚀
See the Liquidation Heatmap here:
👉 https://t.co/NFopP93VDo
#BTC #Bitcoin #Crypto #LiquidationMap #LiquidityZones
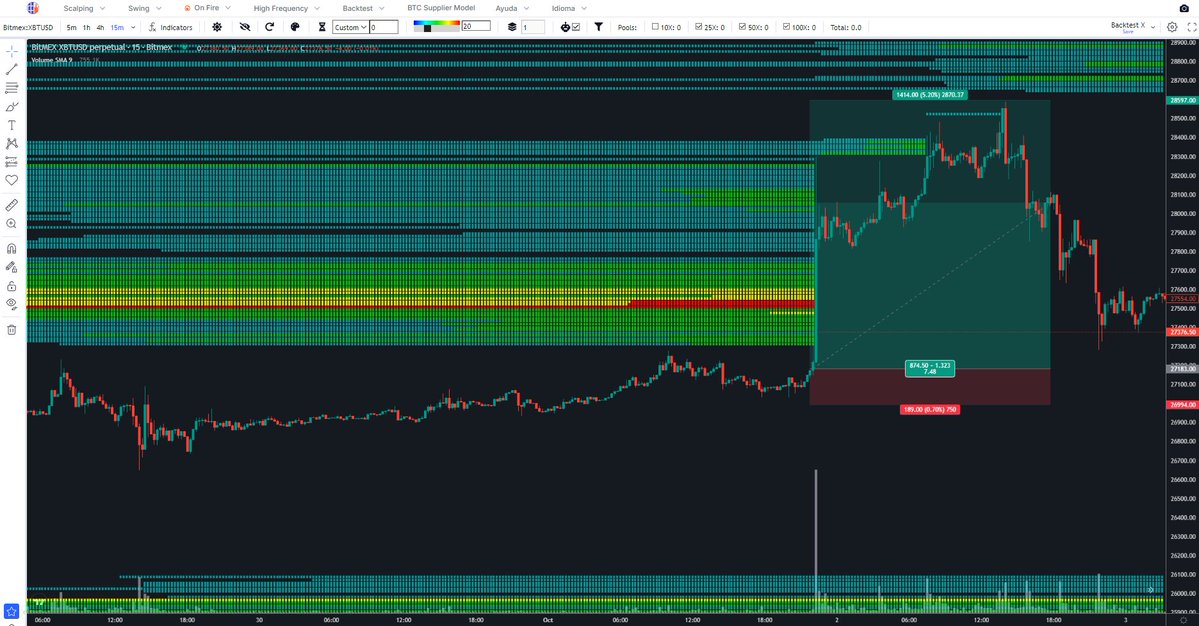
Backtest 29/09/23
Una de las formas más eficientes de enfrentar el mercado de #Bitcoin, donde la manipulación aún juega un papel importante, es validar previamente una estrategia mediante datos históricos.
La herramienta Backtest permite analizar el comportamiento pasado del precio, identificar patrones recurrentes y cuantificar la efectividad de una estrategia antes de aplicarla en tiempo real, aumentando así la probabilidad de éxito.
https://t.co/seCsXnCMSv
La liquidez continúa siendo uno de los principales factores que condicionan los movimientos de #Bitcoin.
A través de Liquidation Heatmap es posible identificar las zonas donde se concentra una mayor cantidad de posiciones apalancadas y evaluar su potencial, a la hora de atraer al precio.
Por otro lado, High Frecuency grafica la actividad de bots que ejecutan cientos de trades por segundo para manipular el precio.
Ejemplo:
https://t.co/NgNxnzcEXR