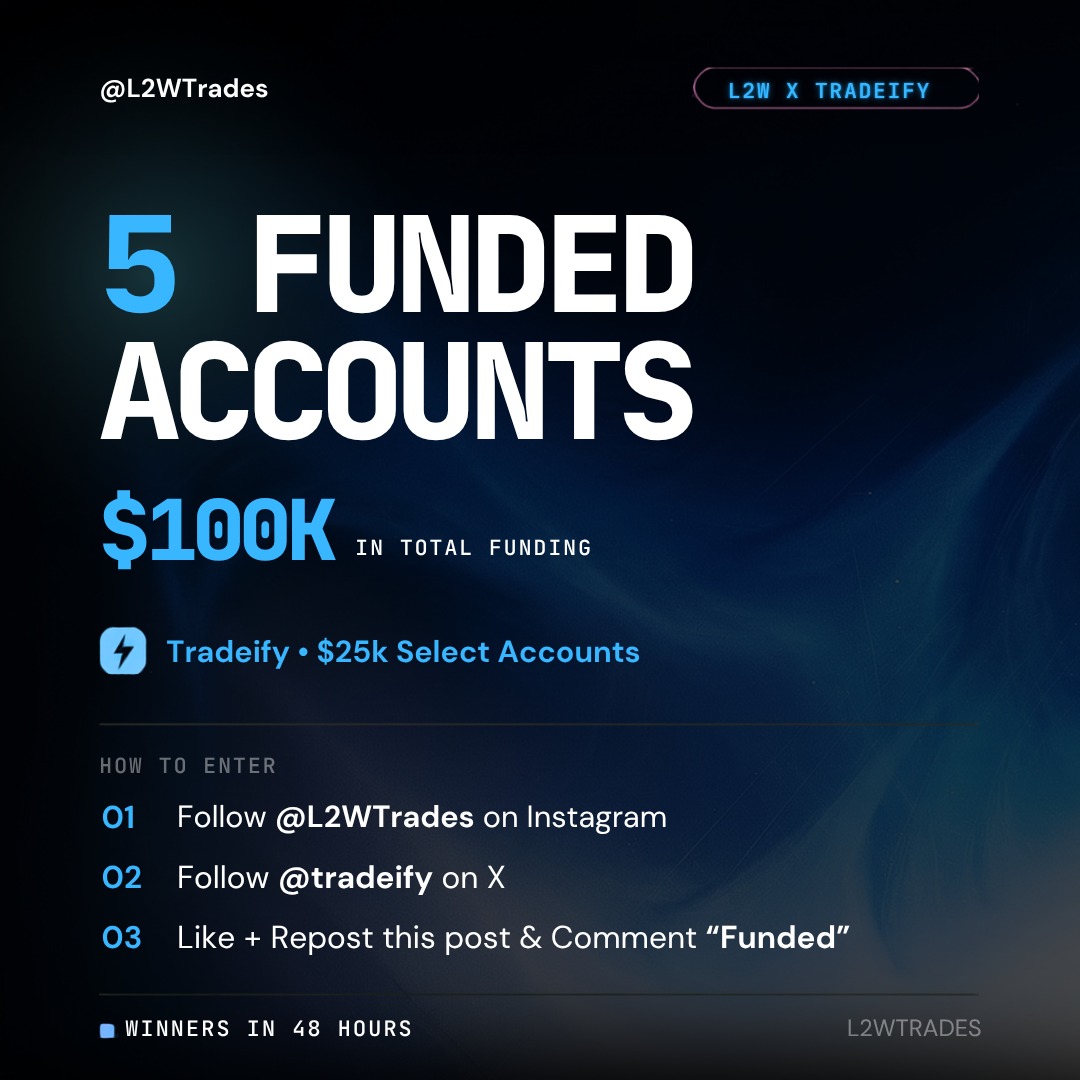
I'm giving away 5x @Tradeify accounts to 5 people
$100k in total funding with one of the best firms out there
to enter the giveaway:
- follow @l2wtrades on Instagram
- follow @Tradeify on X
- Like + Repost this and comment "funded"
code "L2W" gets you 40% off on Tradeify
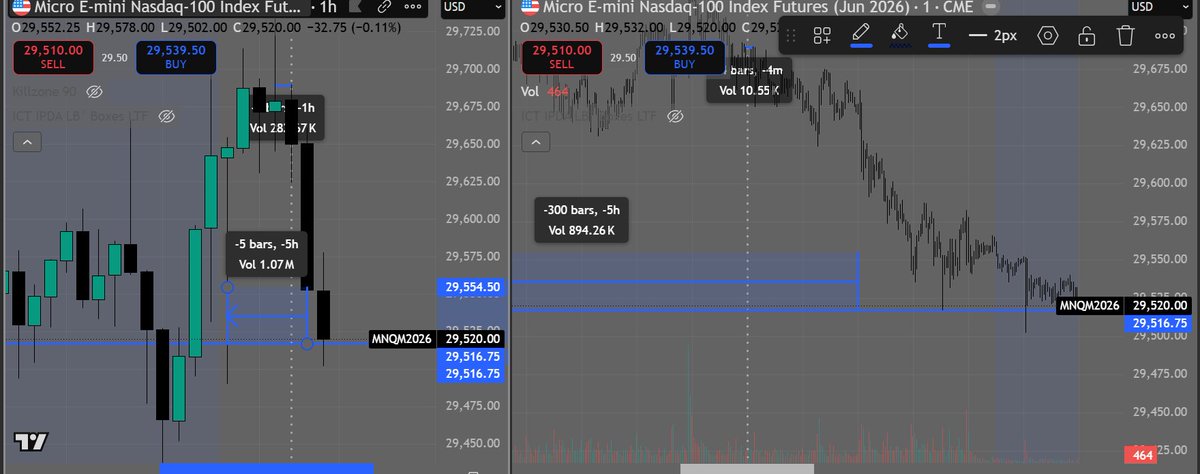
@freexjt they form after enough time has been spent pairing orders and allowed to move to the next liquidity level on that time frame. But how is this usefull when applying a lookback "I see that 2h fvg printed meaning 6h had to pass
to celebrate hitting 20k followers i'm giving away 5 @Tradeify 150k lightning funded accounts 🤍
that's over $2,500 in INSTANT funded accounts - a HUGE giveaway. Tradeify knows how to do it best :))
to enter:
- follow me + @Tradeify
- like + repost
- reply "AW"
winners in 6 days.
i couldn't be more thankful for all of you along the way to 20k🫶
@freexjt Yes. You’re trying to get em to see something but I cannot lol once the 77m fvg is hit it will continue price in the direction or price will reverse altogether but depending on what happens Theres a certain sequence of how price is referring proximal and distant time hmmmmmm
giveaway time :))
giving away 5 lucid 50k DIRECT funded accounts - no eval, straight to funded. you just trade!!
to enter:
- follow me + @TradingLucid
- like + repost
- reply "in"
winners in 5 days 🤝
@freexjt If I’m looking at a chart rn and there are 4 up close 77m candles the algo will either continue meanig or start repricing within that range? Idk what you mean up to 77m
@freexjt Now when the consecutive delivery is done and we are inside that range we now that in that time frame it took liquidity but again what is the importance of knowing we are in a consecutive delivery of a 77m time frame lets say 4 up candles
@freexjt you can define any range with consecutive delivery being just one candle or multiple candles (consecutive up or down) now it might not be your normal 1h it might be the 77 m time frame that shows this but once it has been define how is that even useful?
@freexjt following up on this. any swing high to low can be seen as 1 candle and it can be divided into 4ths lets say from a low to a high we have a 231 minutes time fram range and you divide that to smaller time frame where you have consecutive delivery. but now what time is active
@freexjt hierarchical liquidity mapping across timeframes, where different extremes of a candle “source liquidity” from different temporal scales. Like a bullish 4 hour after it opens it will use 5m lookback discount to a 1 hour lookback premium let show you an example