I spy RSI 🔎 (context in comments)
I have started DCA'ing #bitcoin for my long term bag.
FYI this is not trading capital. It is retirement account cash that I have allocated for accumulating again during this bear market.
I'm not focused on timing bottoms with this allocation. I focus on current value and future value. The DCA will run until the end of the year.
This is what you want to see when #Bitcoin is actually attempting to put in a real bottom.
These screenshots are from a previous post, but with more colour on the signals that matter.
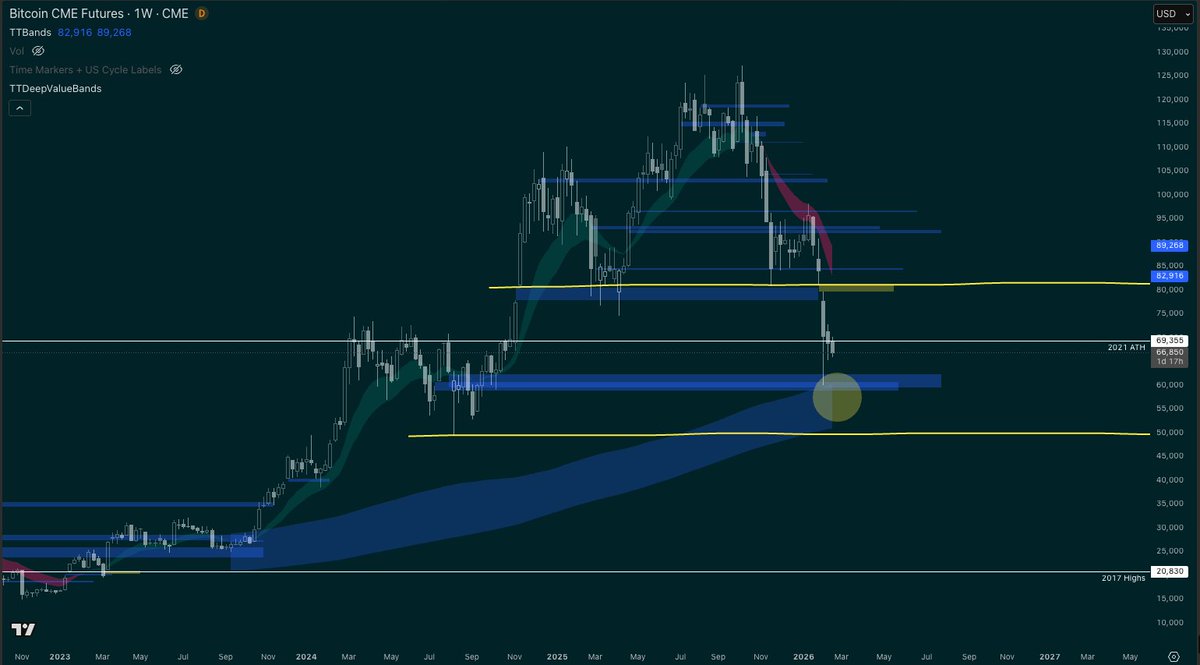
Start with the weekly chart.
The macro trend (bull vs bear) is dictated by the weekly structure.
A true bottom typically begins with capitulation into the weekly structure lows (or slightly through them).
At the same time you want to see weekly RSI forming bullish divergence.
That combination, structural capitulation + momentum divergence, is one of the first high-probability signals that a cycle low could be forming.
But price action is only part of it. Sentiment needs to break.
Fear and panic should dominate.
Most of the loud bulls have turned bearish.
Even the stubborn ones stop confidently calling for higher and start saying things like:
“Just part of the game, you have to accept the risk.”
After that capitulation event, markets rarely V-bottom.
Historically price tends to range for weeks to months (often ~6–8 weeks) while sentiment stays decisively bearish.
The next structural signals will then begin to appear.
I don't know when, but I know WHAT I need to see, and I will share it as I see it.
I spy RSI 🔎 (context in comments)
I have started DCA'ing #bitcoin for my long term bag.
FYI this is not trading capital. It is retirement account cash that I have allocated for accumulating again during this bear market.
I'm not focused on timing bottoms with this allocation. I focus on current value and future value. The DCA will run until the end of the year.
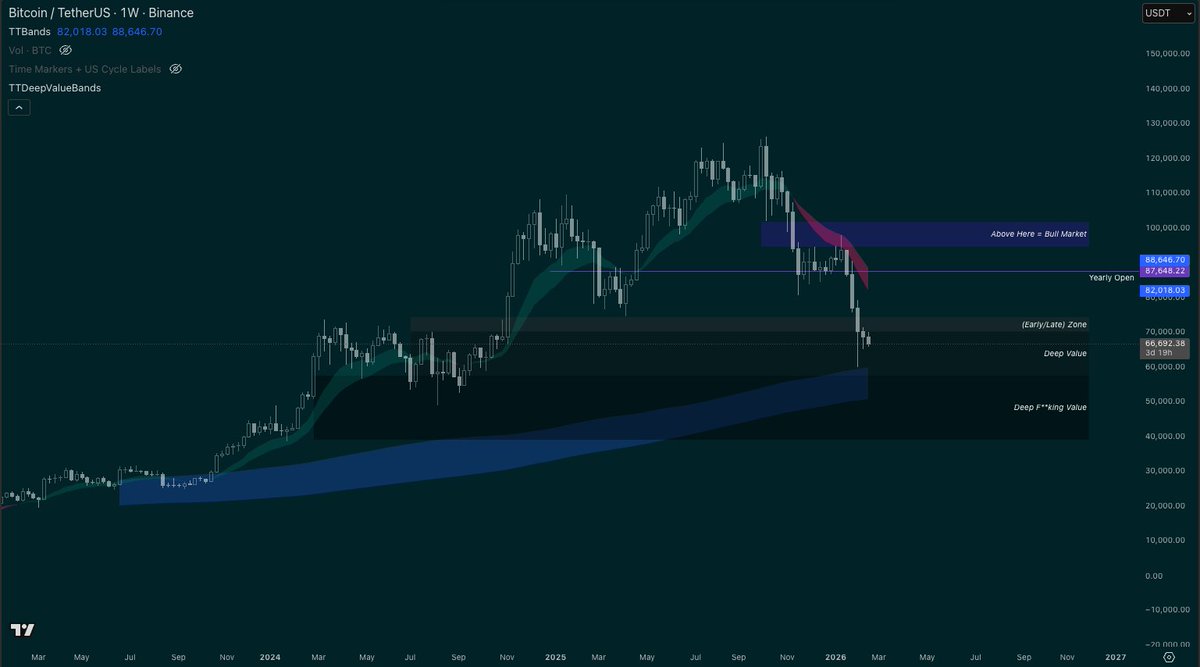
Bookmark this if you’re trying to work out where to buy #Bitcoin in the next bull cycle.
Yes, there will be another bull market.
No, I don’t know when.
In my framework, price and time matter equally.
Price:
I study historical cycles, market structure, and cross-asset signals.
Time:
I track macro regime shifts and liquidity conditions.
These charts are not predictions.
They are not trading signals.
They are broad zones of historical significance.
Use them as context, not certainty.
One final note.
It is not unusual for price to trade below deep value bands during major bottoms.
If we reach those levels, I will care less about timing and more about long-term positioning. That is where retirement capital gets deployed.
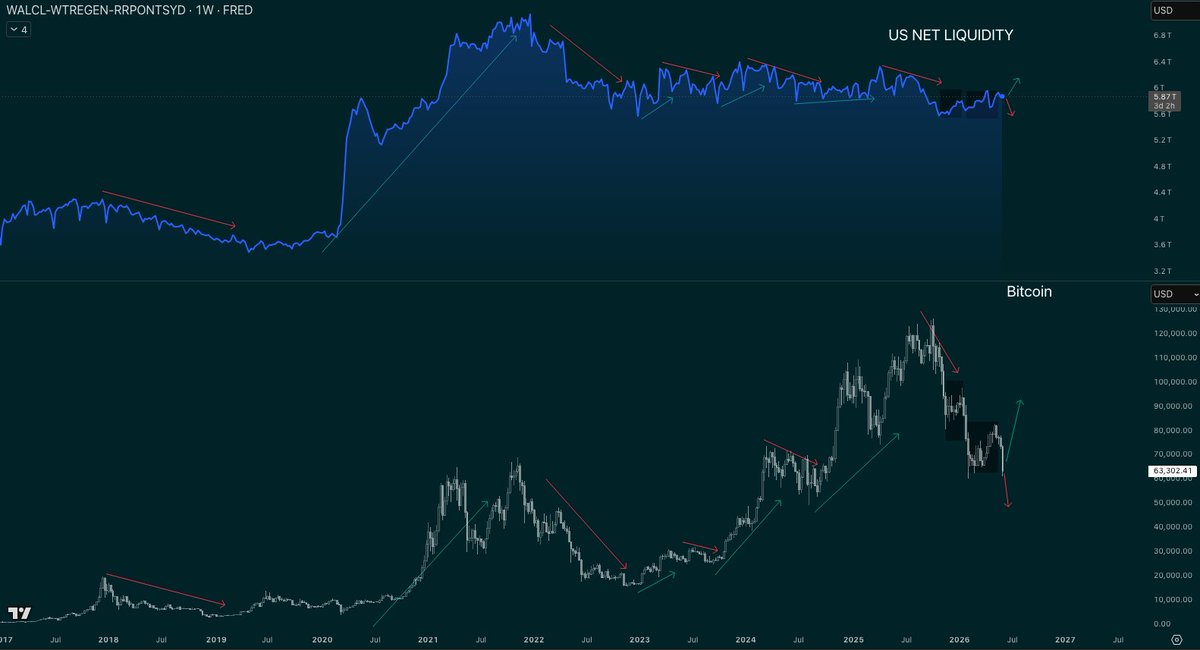
This chart tells you if #bitcoin is going up or down.
If you've been following me for a while... you know what this is.
I call it US NET LIQUIDITY. It is:
Fed Balance Sheet
TGA Wallet
Reverse Repo
Put simply:
Net liquidity up = Bitcoin up
Net liquidity down = Bitcoin down
The rate of expansion or contraction impacts the speed of incline/decline in #BTC.
The most recent bull market had a more nuanced net liquidity cycle, ultimately required closer monitoring because it wasn't as simple as "fed is juicing, gov is spending".
I track this weekly as a guide on risk markets - this does not impact ONLY bitcoin.
GM Legends
From the desk today.
✅ Daily Pulse
(🟡 Monitor, de-escalated from yesterday's 🔴)
The Iran risk de-escalated — Israel-Lebanon ceasefire, House War Powers vote, Trump flagging weekend progress — and oil reversed −3.24%, unwinding Wednesday's risk-off.
Equities ex-tech bounced (DJI +1.73%, RTY +1.45%), VIX calmed. But two cracks: Broadcom −16% on an AI-chip miss dented the leadership that carried equities all week, and crypto kept falling through the bounce (BTC $63K, ETH $1,768) — now fully isolated to the downside.
Claims ticked up to 225K.
NFP lands tonight 22:30 AEST (consensus ~100K, U-rate 4.3%) — the week's binary.
@cottster1 Yeah with price sitting on March lows (inside candle) would expect some type of support here.
The main test is the primary structure low at 59k. If a bottom the cleanest setup is a test of that low, resulting in sweep and deviation. Then range/accumulate.
The thread into tomorrow: this is the W23 thesis resolving the hawkish way — ADP firm, ISM prices hot, oil re-firing inflation, 2Y holding 4.05%.
NFP (Friday 22:30 AEST) is the binary, and now it lands with the inflation impulse re-accelerating rather than fading.
2Y at 4.10% remains the line that re-arms the hike; a soft jobs print is the only thing left that reintroduces cut pricing.
✅ Daily Trader Report
Crowd at extreme fear (Fear & Greed 11), "crypto is dead" everywhere. BTC below $66K (first since April 2) after the year's 3rd-largest liquidation — $1.8B, mostly longs; it has erased all post-election gains and "broke every correlation."
Macro turned hawkish and broad:
ADP +122K (16-month high) and the hot ISM Services prices firmed yields/dollar, and the Iran escalation finally cracked equities.
✅ Daily Pulse (🔴 Attention Required — first RED of the week)
The decoupling broke. The Iran conflict escalated overnight — Iran struck Kuwait (Int'l Airport, 1 dead/63 injured) and Bahrain.
(US 5th Fleet HQ); US hit Qeshm and oil tankers — pushing oil toward $100. That re-fired the inflation impulse the cooler PCE had soothed: ISM Services prices hit 71.3, highest since Aug 2022, with employment contracting a 3rd month — a stagflationary tilt.
The week's crypto-only weakness broadened into a broad dollar-and-rates risk-off: SPX snapped a 9-day streak, DJI −1.21%, DXY firmed above 99.50, and gold sold with risk (a dollar-squeeze, not a safety bid).
All landing on NFP eve.
What happens when you put these together?
Monthly trend line broken.
Seller gap inverted + Buyer gaps created during inversion
= Demand > Supply
Historically BTC is transitioning from bear market to bull market when this happens.
The #bitcoin major trend line is now confirmed. We can now respect the move if it starts to break this trend line. All details + key signals in thread.
TLDR: When this trend line breaks (+ hidden signal below) it is highly probable that the market is moving from bear to bull.
What to pay attention to (hidden signal):
Look at the monthly FVG's created during downside expansions. The most recent represents the sell side pressure. When it is inverted it means buy side is taking over. More strength if the buy side creates new FVG's during inversion.