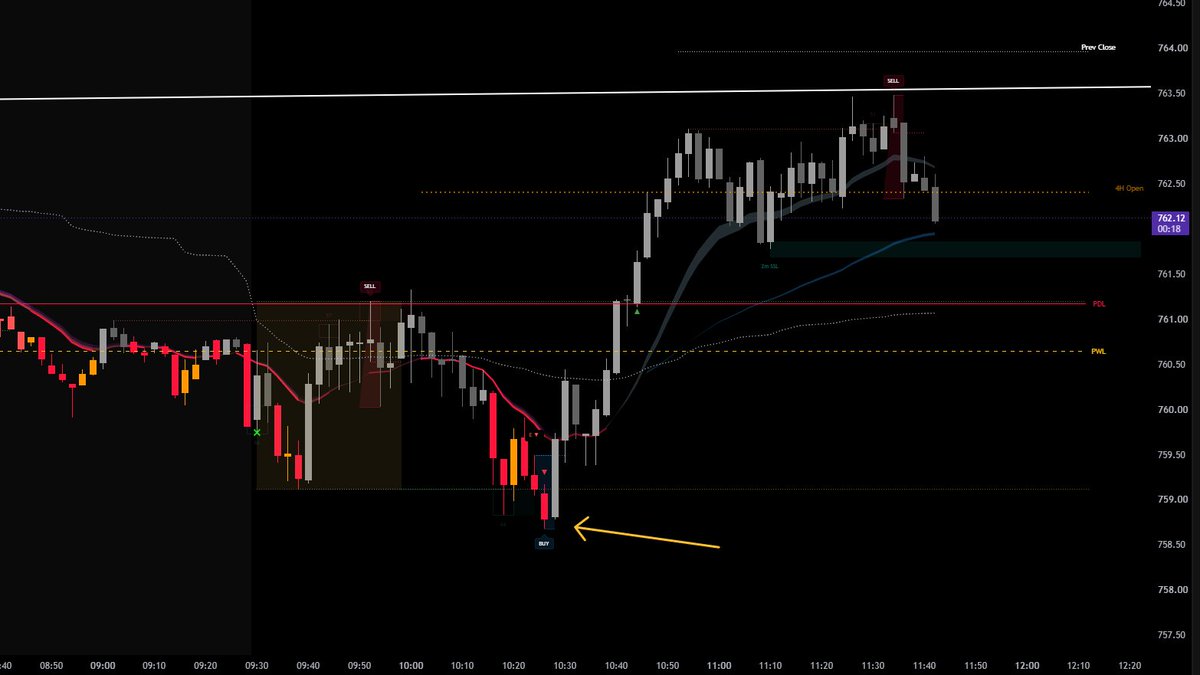
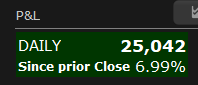
Called out all the plays on X, $AAPL just got drilled, $MSTR, and $PLTR flush continues!!!!!!! Held these winners with a smaller size. Up a total of $43,000 with these big winners
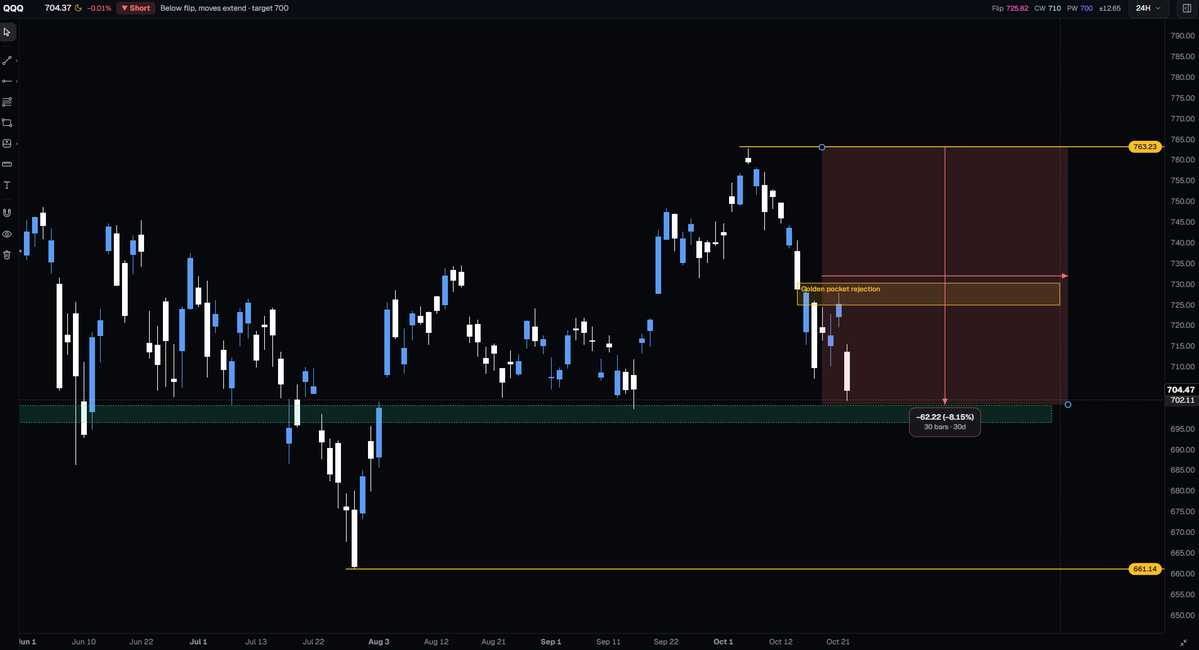
$QQQ is down -8% from an all-time high.
Pulled back and rejected the 0.618 fib retracement.
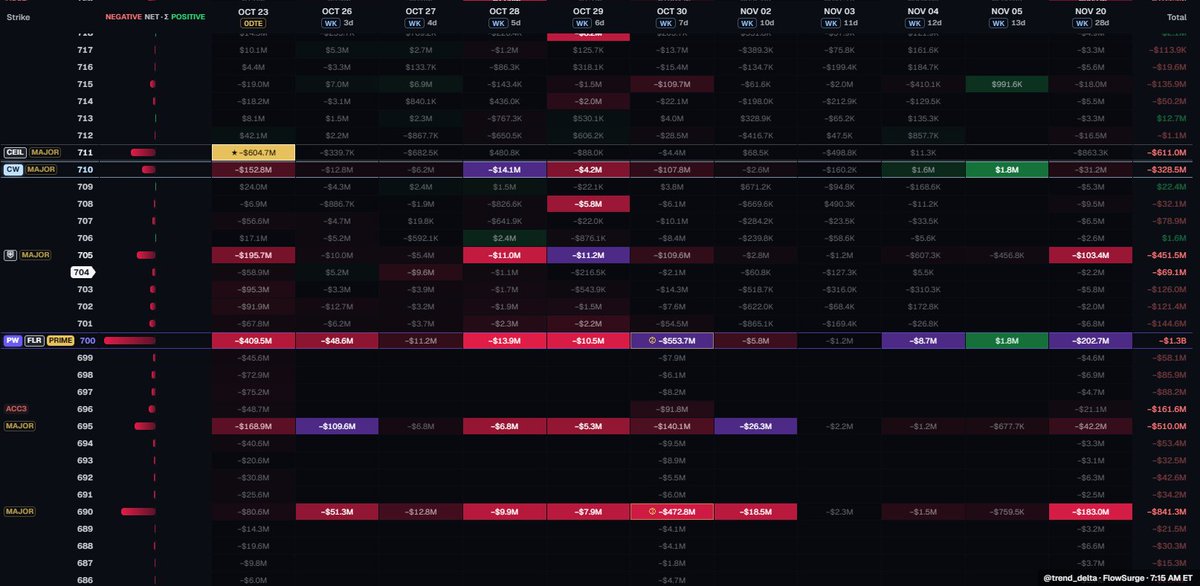
This demand zone is the make-or-break zone. It is the only zone I'd look to go long, with 693 as the stop.
The first target is 710-711, then a gap fill at 722.
Watch the 710-711 level.
$QQQ is down -8% from an all-time high.
Pulled back and rejected the 0.618 fib retracement.
This demand zone is the make-or-break zone. It is the only zone I'd look to go long, with 693 as the stop.
The first target is 710-711, then a gap fill at 722.
Watch the 710-711 level.
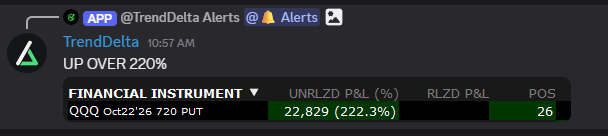
$QQQ PUTS PRINTED! Done for the week, most likely.
What a great day for everyone in the group: over a 220% gain.
Cons went from 3.63 to 12.64
Link in BIO if you wanna join us!
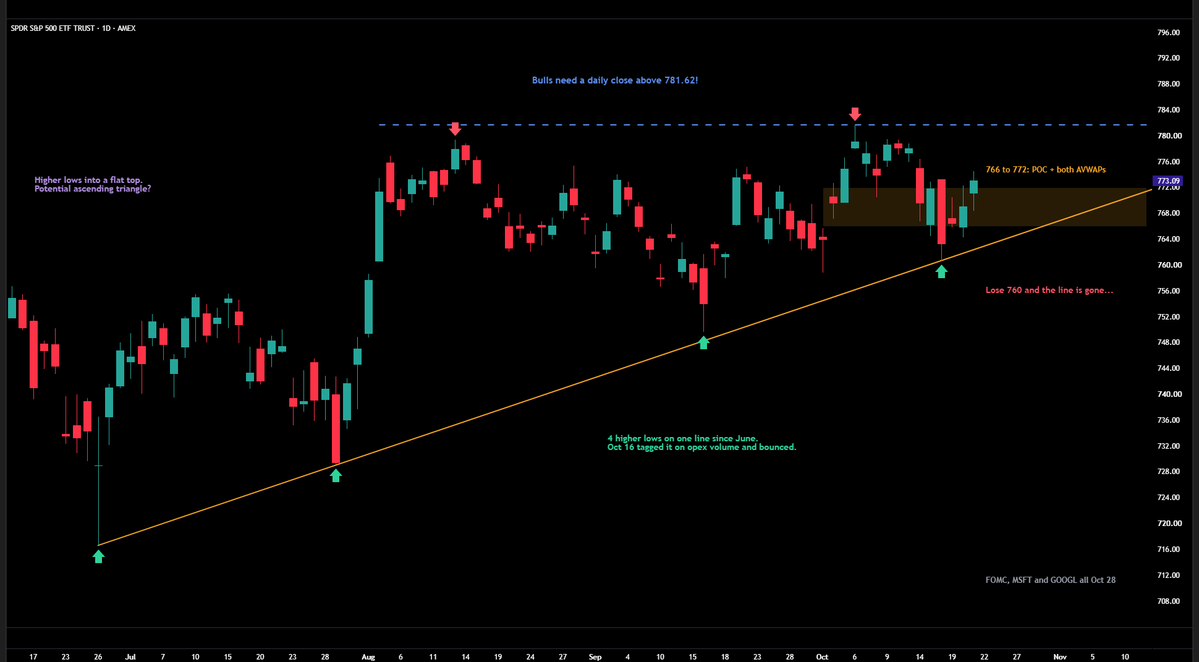
$SPY Chart Update:
1) 4 higher lows on one rising line since June. Oct 16 tagged it on opex and bounced.
2) Flat top at 781.62. Potential ascending triangle.
3) 766 to 772 = POC + both AVWAPs.
4) Close over 781.62 and we're back
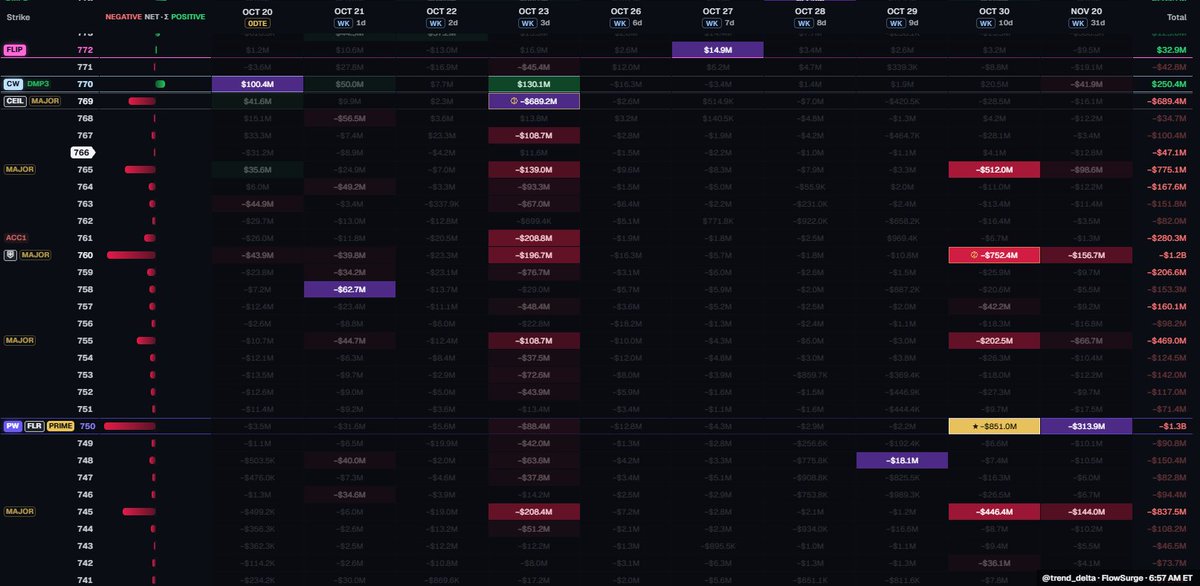
5) Lose 760, and we might get a big flush.
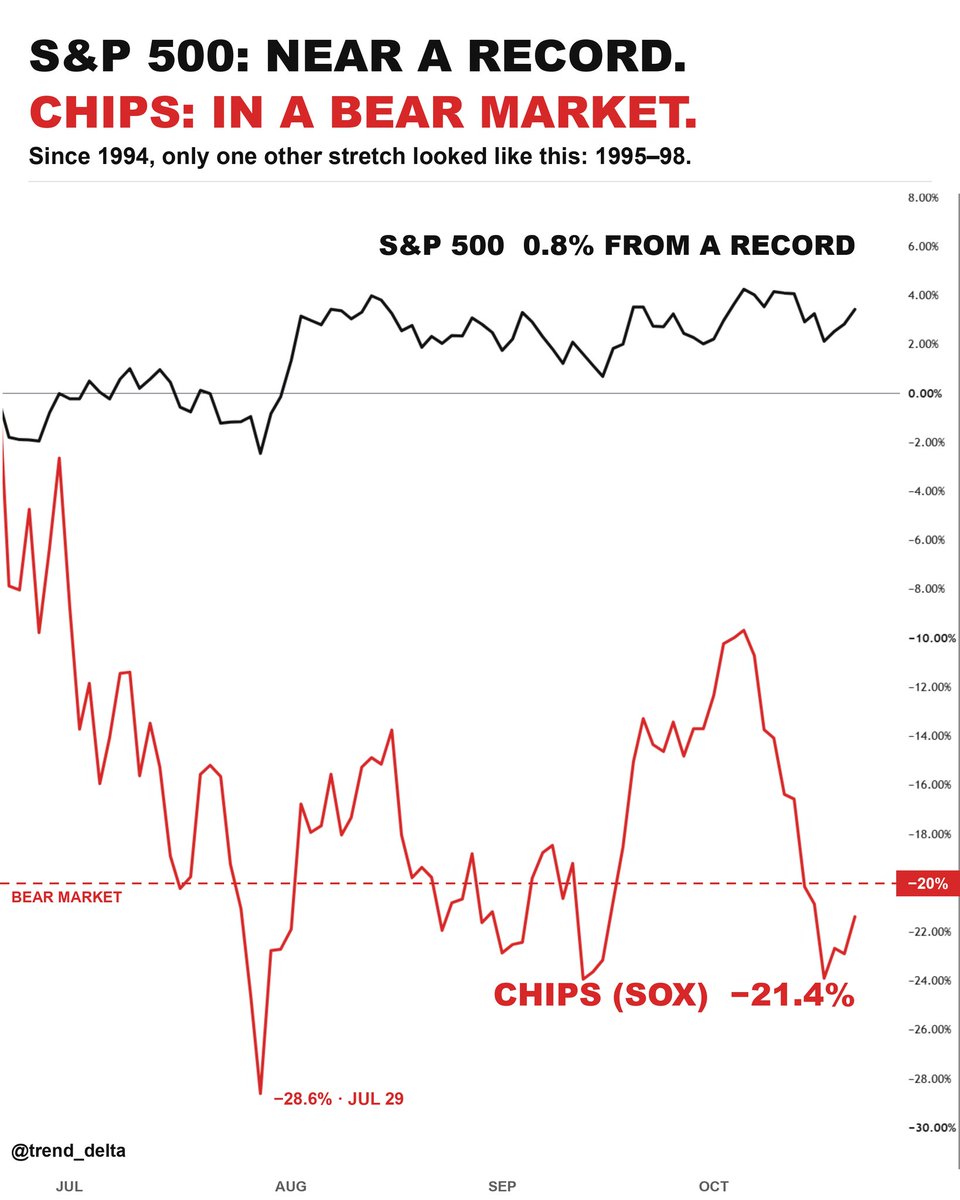
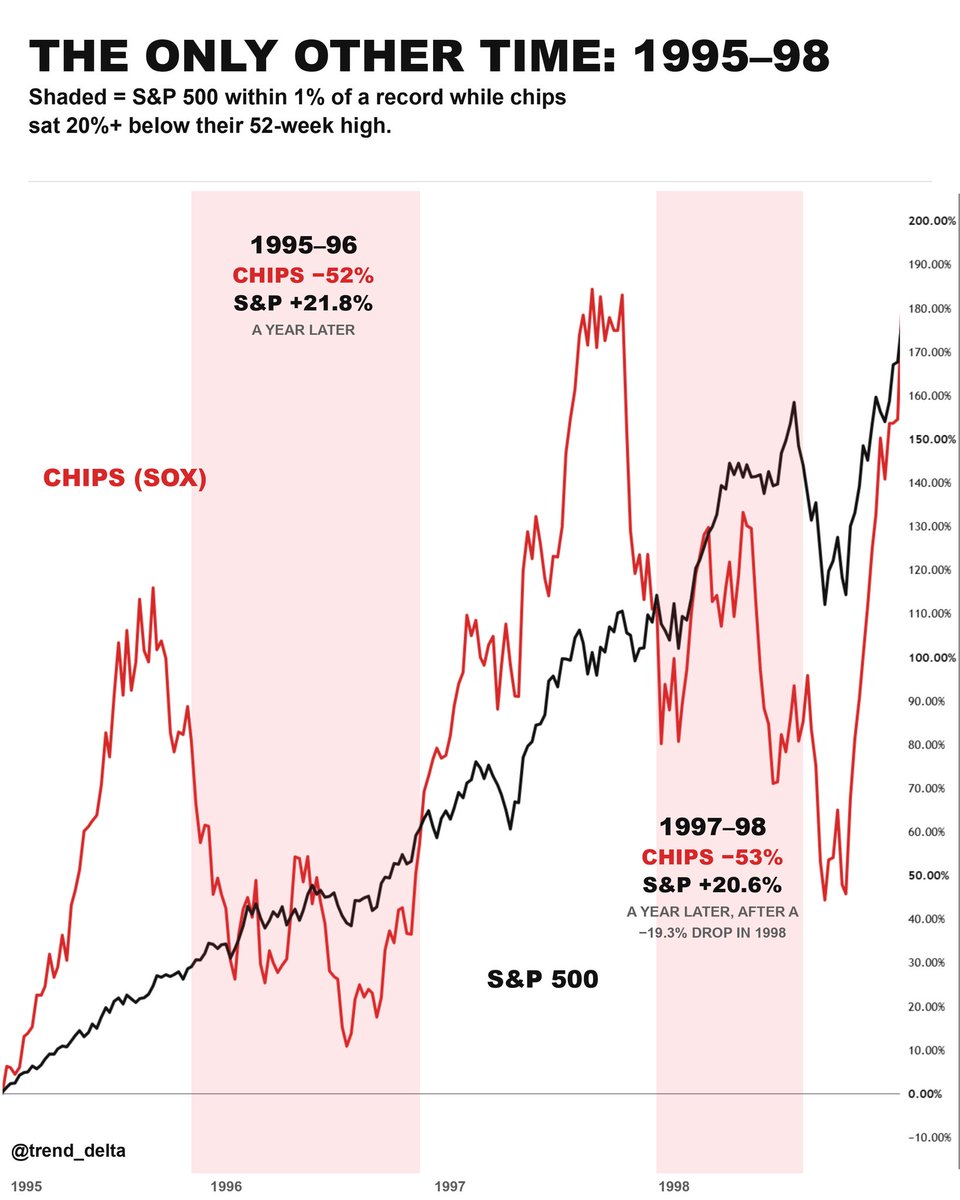
🚨The last time chips fell into a bear market, the S & P ($SPY) dropped 19.3% in 6 weeks.
That was 1998. The same divergence is back.
$SOXX is down 21.4% from its June 22 peak. The S&P 500 is 0.8% from a record.
In December 1997, chips were already down 24% from their high. The S&P didn't care. It rallied another 21.7% to a record on July 17, 1998.
Then Russia defaulted and LTCM blew up. The S&P fell 19.3% by August 31. Chips lost another 27%.
Since 1994, the only other case was 1995. That one never got worse than a 7.6% dip.
Both times the S&P was higher a year later, 1998 included.
Two examples is a tiny sample. Not a prediction.
But when the leaders stop confirming, I take caution.
$QQQ
Gave this free alert on X and held these puts overnight with conviction, along with the Discord members.
This is why you avoid doing 0DTE all the time.
Now these contracts are gonna open up around 9.50-10 (close to a 175% GAIN)
$QQQ
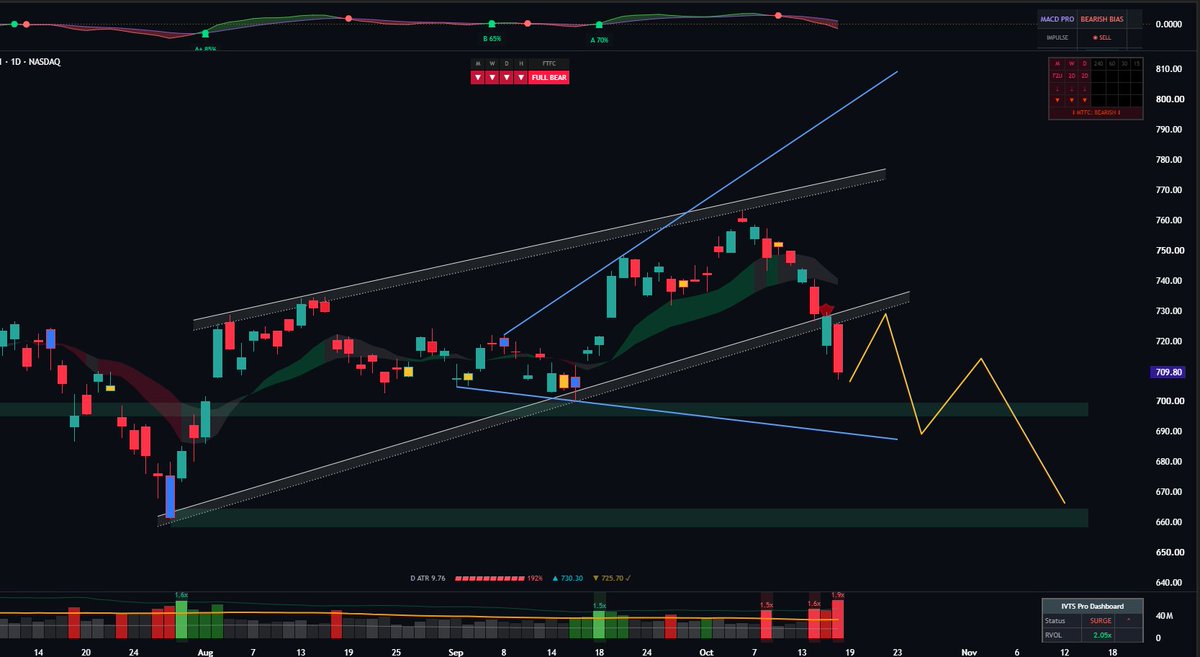
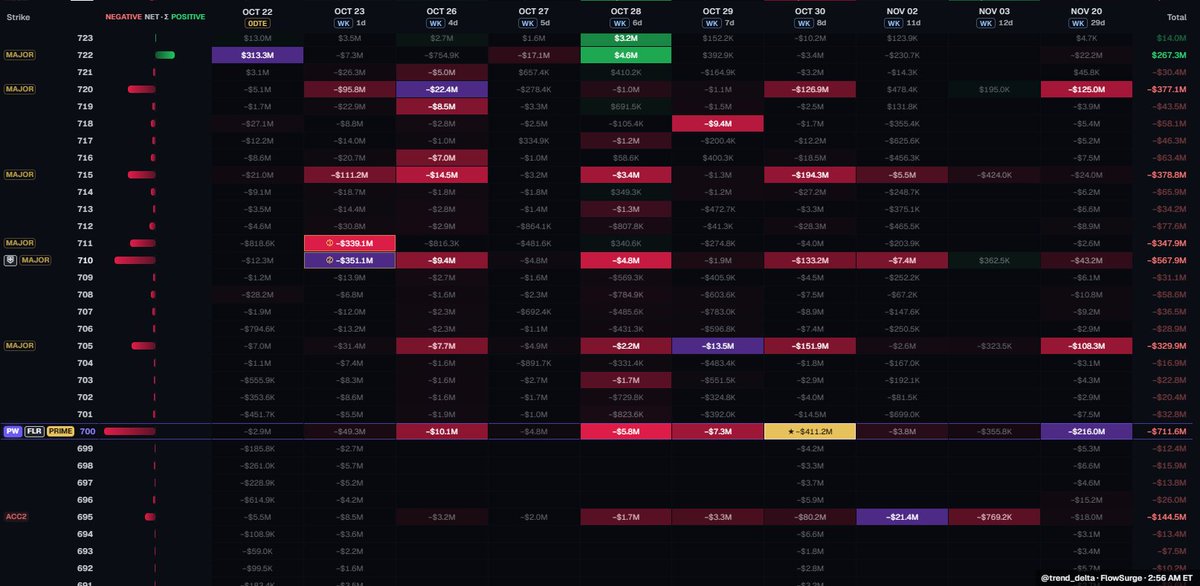
Clean breakdown out of the 3-month rising channel on big volume
10 and 20 EMA just crossed down... not buying dips here
Old trendline and the EMAs all stacked at 730-735
Rejection on that retest opens up 700.
Big put flow showing up right at these levels too...
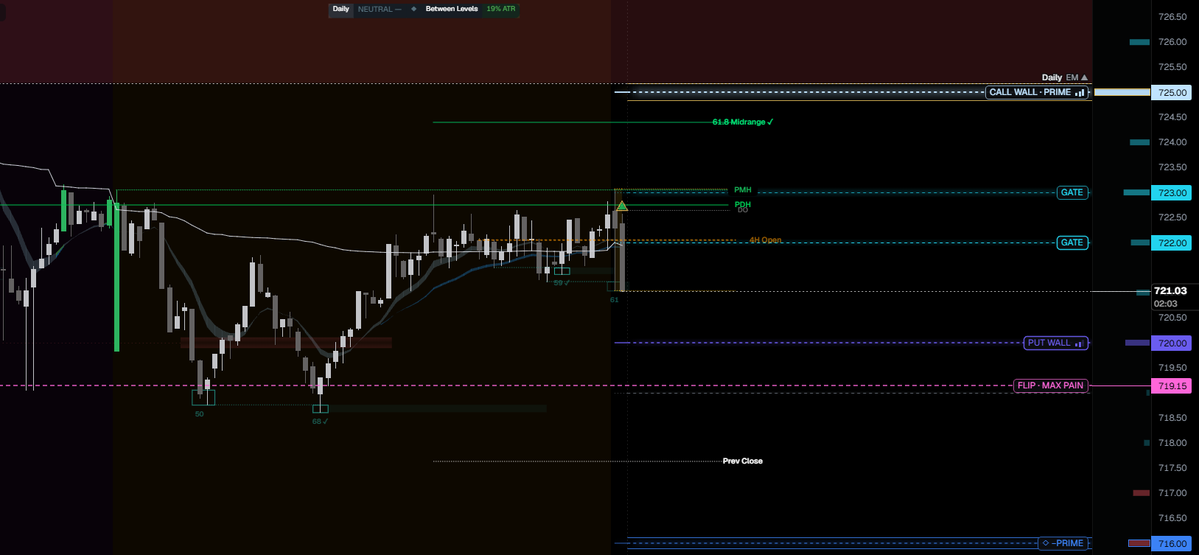
$SPY plan for the morning:
🔴 Sell 772.65 to 773.78 (Expected Move resistance + gamma flip). Stop 774.52.
🟢 Buy 764.54 to 765.45 (Expected Move support + 765 gate). Stop 763.25.
Over 773.78: 775, 778.07, 780.22
Under 764.54: 762, 760
Chop between 769 and 770.
$SPY gave a warning that it'd be a chop inside day.
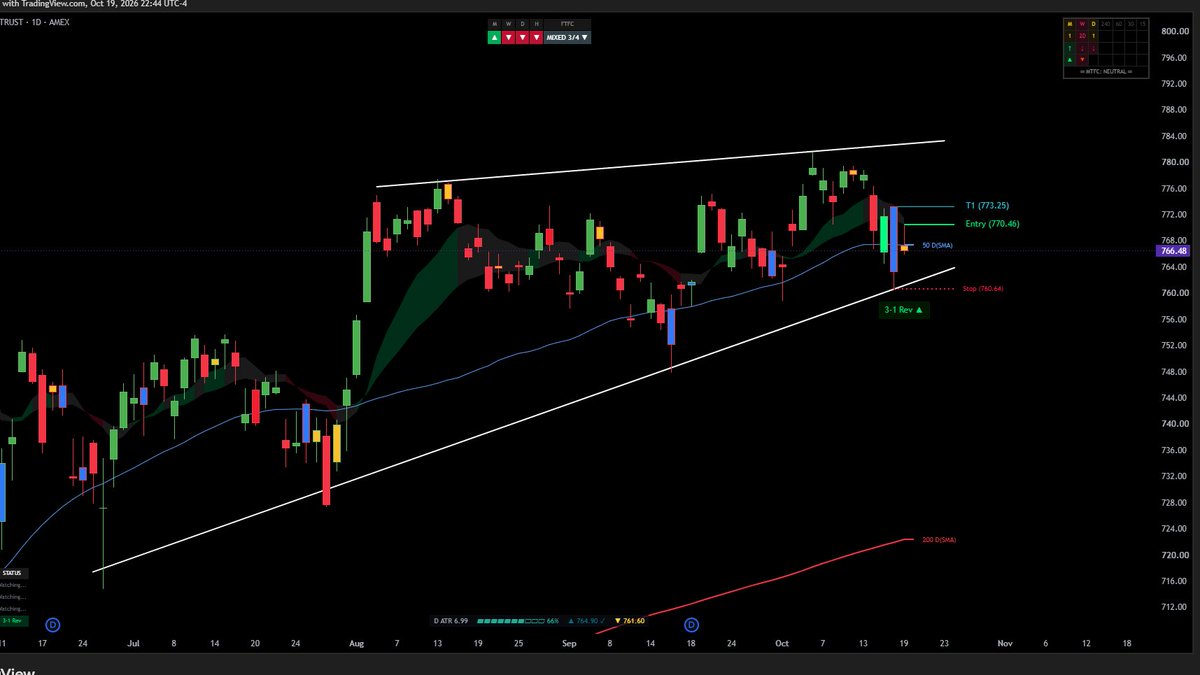
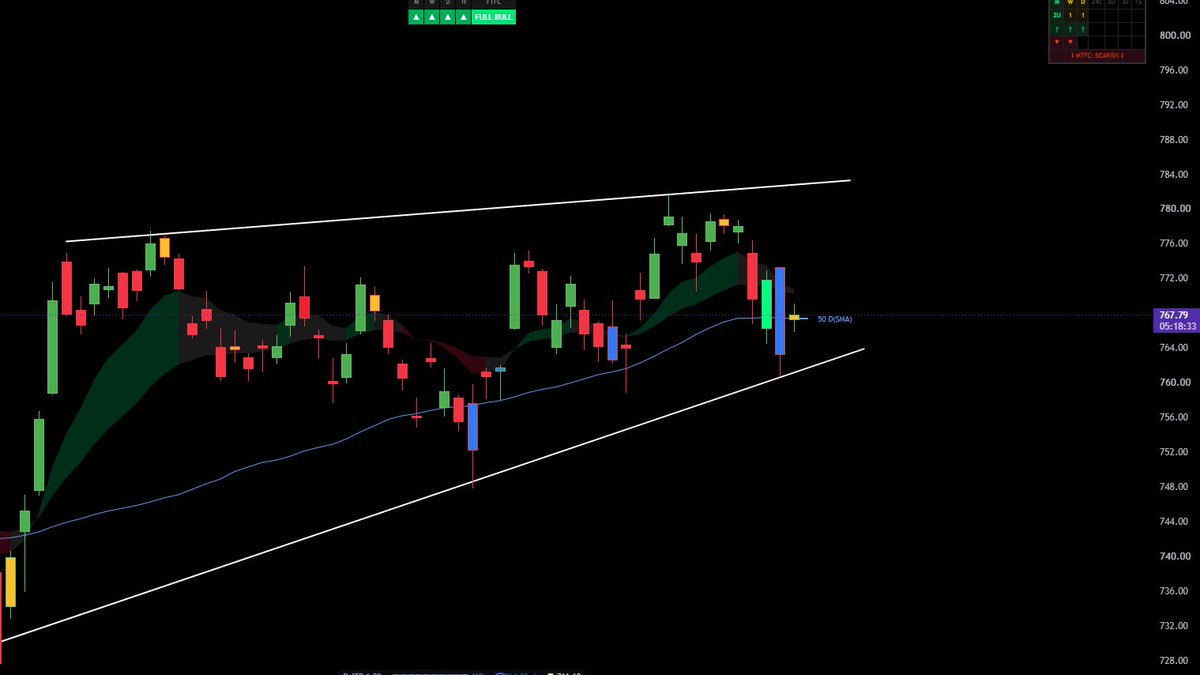
Here's the inside day setup for those who waited
Breaking above 770.46 would squeeze any shorts.
Break below 765.86, and we get some continuation to 759, 748.
$SPY Perfect rejection at this gate level.
AVOID overtrading today
Most likely chop today, with the previous Friday being an outside bar.
We'll get an inside bar setup tomorrow if it stays in range.
$SPY Perfect rejection at this gate level.
AVOID overtrading today
Most likely chop today, with the previous Friday being an outside bar.
We'll get an inside bar setup tomorrow if it stays in range.
$NVDA is holding up the monthly trendline
A break above this consolidation zone should send it to 227.5, as long as it stays above 220.
Rejection at 220 or a break above and a failure, should send it to 210.
210 level is a key major support.
$CRWV Weekly capitulation candle with the highest volume ever.
Daily setup with call entry at the break of 66.79
First target: 69.76, then a gap above to 76.33
$QQQ
Clean breakdown out of the 3-month rising channel on big volume
10 and 20 EMA just crossed down... not buying dips here
Old trendline and the EMAs all stacked at 730-735
Rejection on that retest opens up 700.
Big put flow showing up right at these levels too...