$JRSH is moving after the company reported much stronger earnings than last year. Their revenue is up 46.6%, they’re back to profitability and have plans to expand production capacity.
Because of the good news buyers stepped in so we took the $6.40 break as a gamble play and price went on to hit $9.93 for a +55.16% move 💸
We’re 3/3 green so far this morning 💚
$JRSH Q4 2026 earnings: Massive Operating Leverage Drives Record Profits, Despite Margin Dilution
Jerash finished FY26 with an exceptional quarter. Revenue accelerated 46.6% YoY to $42.9 million, clearing out previous shipping backlogs. The real story, however, is on the cost side: operating expenses actually fell in absolute dollars YoY despite the massive revenue surge, causing operating income to multiply more than 5x to $2.3 million. However, underneath the headline earnings beat, gross margins slightly compressed as the company trades pricing power for volume by diversifying its customer base.
Full article with charts - link in bio
🐂 𝐁𝐮𝐥𝐥 𝐂𝐚𝐬𝐞
• 𝐔𝐧𝐩𝐫𝐞𝐜𝐞𝐝𝐞𝐧𝐭𝐞𝐝 𝐎𝐩𝐞𝐫𝐚𝐭𝐢𝐧𝐠 𝐋𝐞𝐯𝐞𝐫𝐚𝐠𝐞 — Total operating expenses plummeted to 11.7% of revenue in Q4, down from 16.4% a year ago. Management has successfully normalized logistics costs and controlled SG&A, letting top-line growth drop straight to the bottom line.
• 𝐕𝐢𝐬𝐢𝐛𝐢𝐥𝐢𝐭𝐲 𝐚𝐧𝐝 𝐂𝐚𝐩𝐚𝐜𝐢𝐭𝐲 𝐄𝐱𝐩𝐚𝐧𝐬𝐢𝐨𝐧 — The company's production facilities are fully booked through December 2026. To meet this, Phase 1 of their factory expansion will add 15% capacity by late 2026, and an additional 20-25% capacity will come online by mid-2027.
🐻 𝐁𝐞𝐚𝐫 𝐂𝐚𝐬𝐞
• 𝐆𝐫𝐨𝐬𝐬 𝐌𝐚𝐫𝐠𝐢𝐧 𝐃𝐞𝐭𝐞𝐫𝐢𝐨𝐫𝐚𝐭𝐢𝐨𝐧 — Q4 gross margin fell to 17.1% from 17.9% YoY. The company is securing new clients (like Hansoll Group), but these orders carry a lower margin profile, requiring volume and automation to compensate.
• 𝐍𝐞𝐠𝐚𝐭𝐢𝐯𝐞 𝐅𝐫𝐞𝐞 𝐂𝐚𝐬𝐡 𝐅𝐥𝐨𝐰 — Despite record net income, cash dropped $2.6 million YoY because the company aggressively spent $5.1 million on CapEx (including a new manufacturing building) to chase future growth.
⚖️ 𝐕𝐞𝐫𝐝𝐢𝐜𝐭: 🟢
Bullish. Jerash is successfully capitalizing on the macro shift of global brands diversifying away from Asian manufacturing. While customer mix is diluting gross margins slightly, the sheer volume and tight OpEx control are driving massive earnings acceleration.
𝐊𝐞𝐲 𝐓𝐡𝐞𝐦𝐞𝐬
🟢 𝐌𝐚𝐜𝐫𝐨 𝐓𝐚𝐢𝐥𝐰𝐢𝐧𝐝: 𝐓𝐡𝐞 "𝐂𝐡𝐢𝐧𝐚 𝐏𝐥𝐮𝐬 𝐎𝐧𝐞" 𝐒𝐮𝐩𝐩𝐥𝐲 𝐂𝐡𝐚𝐢𝐧 𝐒𝐡𝐢𝐟𝐭
Jerash is heavily benefiting from global apparel brands shifting their supply chains away from Southeast Asia and China. Jordan is emerging as a preferred manufacturing hub due to free trade agreements and duty-free import advantages to the US, keeping Jerash's order books fully booked through December 2026.
🟢🟢 𝐀𝐠𝐠𝐫𝐞𝐬𝐬𝐢𝐯𝐞 𝐂𝐚𝐩𝐚𝐜𝐢𝐭𝐲 𝐄𝐱𝐩𝐚𝐧𝐬𝐢𝐨𝐧 [NEW]
To service the accelerating demand, management is aggressively expanding. Jerash purchased a new manufacturing building and land for $3.4 million. Phase 1 of renovation will add 15% to capacity and 700 workers by late 2026. A secondary expansion phase by mid-2027 will contribute another 20-25% in capacity. This provides a clear runway for double-digit revenue growth through FY27 and FY28.
🟢 𝐋𝐨𝐠𝐢𝐬𝐭𝐢𝐜𝐬 𝐑𝐨𝐮𝐭𝐞 𝐎𝐩𝐭𝐢𝐦𝐢𝐳𝐚𝐭𝐢𝐨𝐧 𝐚𝐧𝐝 𝐀𝐮𝐭𝐨𝐦𝐚𝐭𝐢𝐨𝐧
Jerash has structurally lowered its operating costs by shifting import/export routes to the Aqaba port in Jordan to avoid the geopolitical disruptions at Israel's Haifa port. Management also explicitly cited "increased automation" as their primary technology driver to enhance production efficiencies and protect margins amid scaling.
🔴 𝐂��𝐬𝐭𝐨𝐦𝐞𝐫 𝐃𝐢𝐯𝐞𝐫𝐬𝐢𝐟𝐢𝐜𝐚𝐭𝐢𝐨𝐧 𝐢𝐬 𝐃𝐢𝐥𝐮𝐭𝐢𝐧𝐠 𝐆𝐫𝐨𝐬𝐬 𝐌𝐚𝐫𝐠𝐢𝐧𝐬
Despite management touting "economies of scale," the actual data contradicts the narrative that volume is improving unit profitability at the gross level. Q4 gross margin fell to 17.1% (from 17.9% YoY). Furthermore, Q1 FY27 guidance sets gross margin expectations even lower at 15-17%. Jerash is winning new customers, but it is clear they are doing so at lower price points or less favorable product mixes.
🔴 𝐆𝐞𝐨𝐩𝐨𝐥𝐢𝐭𝐢𝐜𝐚𝐥 𝐚𝐧𝐝 𝐏𝐨𝐫𝐭 𝐂𝐨𝐧𝐜𝐞𝐧𝐭𝐫𝐚𝐭𝐢𝐨𝐧 𝐑𝐢𝐬𝐤𝐬
While both Aqaba and Haifa ports were operating normally this quarter, Jerash's operations are highly sensitive to Middle Eastern geopolitical stability. Previous quarters saw millions in revenue deferred due to port bombings and Red Sea transit issues. Any flare-up could instantly freeze outbound shipments, trapping cash in inventory.
⚪ 𝐂𝐚𝐩𝐢𝐭𝐚𝐥 𝐈𝐧𝐭𝐞𝐧𝐬𝐢𝐭𝐲 𝐑𝐞𝐯𝐞𝐫𝐬𝐢𝐧𝐠 𝐂𝐚𝐬𝐡 𝐅𝐥𝐨𝐰 𝐏𝐫𝐨𝐟𝐢𝐥𝐞 [NEW]
Despite posting $3.6 million in Net Income for FY26, Free Cash Flow was negative. Operating cash flow of $2.49 million was entirely consumed by $5.13 million in CapEx. With significant facility build-outs planned through mid-2027, investors should expect capital expenditures to remain elevated, suppressing free cash generation.
𝐎𝐭𝐡𝐞𝐫 𝐊𝐏𝐈𝐬
𝐎𝐩𝐞𝐫𝐚𝐭𝐢𝐧𝐠 𝐄𝐱𝐩𝐞𝐧𝐬𝐞𝐬 (% 𝐨𝐟 𝐑𝐞𝐯𝐞𝐧𝐮𝐞): 11.7%
Accelerating operating leverage. Total operating expenses in Q4 were $5.0 million, representing just 11.7% of revenue, an almost 500-basis-point drop from 16.4% in the prior year quarter. This was driven by significantly improved control over export logistics costs and lower stock-based compensation.
𝐈𝐧𝐯𝐞𝐧𝐭𝐨𝐫𝐲: $30.0 million
Stable. Inventories rose modestly to $30.0 million from $27.7 million a year ago. Given the 46.6% surge in Q4 revenue and 20%+ guidance for Q1, this indicates highly efficient inventory turns and validates that goods are actively moving out of ports without bottlenecks.
𝐆𝐮𝐢𝐝𝐚𝐧𝐜𝐞
𝐅𝐘𝟐𝟕 𝐐𝟏 𝐑𝐞𝐯𝐞𝐧𝐮𝐞: ~$47.5 - $48.3 million (+20% to +22% YoY)
Accelerating vs historical averages, though sequentially decelerating from Q4's massive 46% surge (which benefited from catch-up shipments). This guidance indicates that the expanded baseline of demand from new customers is structural, not a one-off.
𝐅𝐘𝟐𝟕 𝐐𝟏 𝐆𝐫𝐨𝐬𝐬 𝐌𝐚𝐫𝐠𝐢𝐧: 15.0% - 17.0%
Decelerating. This is a step down from the 17.1% achieved in Q4 FY26. Management explicitly noted this is due to an "increased emphasis on customer diversification and reduced seasonality." Winning new business is currently coming at the expense of peak margin realization.
𝐊𝐞𝐲 𝐐𝐮𝐞𝐬𝐭𝐢𝐨𝐧𝐬
𝐌𝐚𝐫𝐠𝐢𝐧 𝐅𝐥𝐨𝐨𝐫 𝐟𝐨𝐫 𝐍𝐞𝐰 𝐂𝐮𝐬𝐭𝐨𝐦𝐞𝐫𝐬
As we diversify the customer base to smooth out seasonality, we are seeing gross margin compression. What is the structural gross margin floor we should expect as these new, lower-margin orders become a larger part of the mix?
𝐀𝐮𝐭𝐨𝐦𝐚𝐭𝐢𝐨𝐧 𝐑𝐎𝐈 𝐓𝐢𝐦𝐞𝐥𝐢𝐧𝐞
You cited increased automation as the primary lever to improve gross margins via economies of scale. When exactly will the capital deployed for automation begin to demonstrably expand the gross margin percentage?
𝐂𝐚𝐩𝐄𝐱 𝐑𝐞𝐪𝐮𝐢𝐫𝐞𝐦𝐞𝐧𝐭𝐬 𝐟𝐨𝐫 𝟐𝟎𝟐𝟕 𝐄𝐱𝐩𝐚𝐧𝐬𝐢𝐨𝐧
With the Phase 2 expansion aiming to add 20-25% capacity by mid-2027, how much additional CapEx is modeled for FY27, and will we need to tap the $20 million in undrawn credit facilities to fund it?
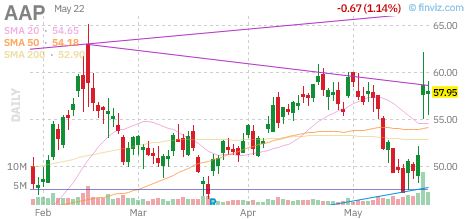
I'm following the $AAP flow. Bought some July $67.50 calls for $2.30.
Monthly finally cleared through its long term downtrend. Retested, held, and started a new uptrend with room to $67-$68. If it breaks through, will have further upside to $74-$75.
Large short interest in this name as well.
$AAP (Advance Auto Parts Inc.)
Reclaimed the high-volume edge (HVE) level, which is now acting as short-term support and a potential launch area for continuation. Structure is improving as price stabilizes above the reclaimed zone.
Verdict: Buy.
Hard disk and storage stocks have been flying 10-20x last year. Most of them like WDC, STX and SNDK are already gone but this $NTAP thing is interesting!
26 years of building this triangle!!! 👀 Breakout could send to Mars and beyond!
Not confirmed yet... But def. looking good! 💪
"NetApp (NTAP): Focused on intelligent data infrastructures for cloud and hybrid environments"