New: House members are losing their bids for higher office at a historically high rate. What's going on? We dive in, with data going back over 30 years.
https://t.co/LIz310Zert
Latest in House exodus from @50plus1news: A record number of sitting House members are running for other offices — and losing in the primaries. Many chose to enter crowded primary fields, and a dozen have already failed to secure their party's nomination.
https://t.co/sckpbeye8e
@IanPrchlik@lukewines Hi Ian -- This piece uses (and includes links to) FiveThirtyEight data going back to the first Trump admin. Beyond that, I'd recommend CQ Roll Call's vote studies. They have an extensive historical database of presidential agreement using similar very methodology.
Excited to carry on the Trump Score name with @VoteHub! I gathered Trump's positions on 282 floor votes in 2025 to calculate how often each member of Congress agreed with the president, and dug into what issues and dynamics have dominated floor action in Trump's second term. 🧵
@kunkel_dan23596@VoteHub Hi Daniel, The last section and chart in the article provide comparisons to previous years. High agreement w/in the majority has become an increasing norm in *both* parties over recent years.
And dig into the data to see how your lawmaker voted in 2025 using the full interactive (by @lukewines and Lauren Kim) here: https://t.co/Bl5opFNuJP /8
🚨 NEW from VoteHub: the Trump Score 🚨
Trump's influence over Congress in 2025 was massive. @tsyang27 shows who followed and who defied.
In the tradition of FiveThirtyEight’s presidential agreement projects. 🧵
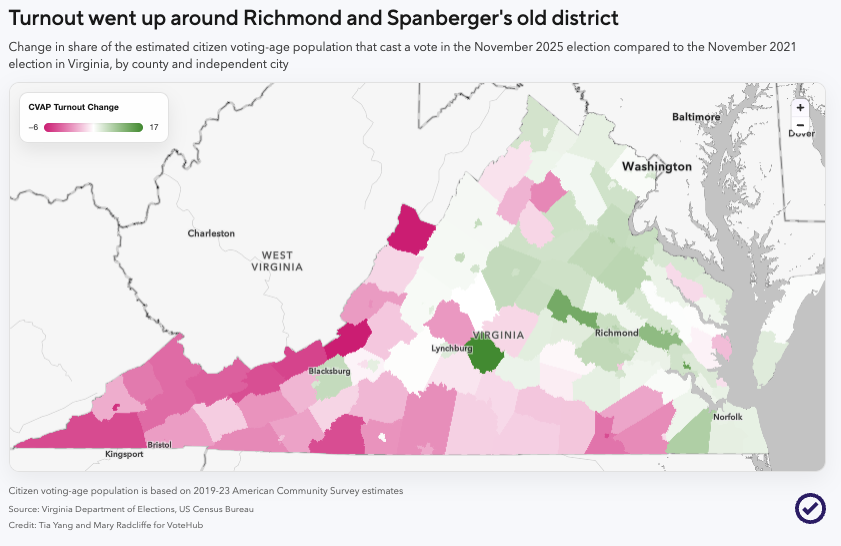
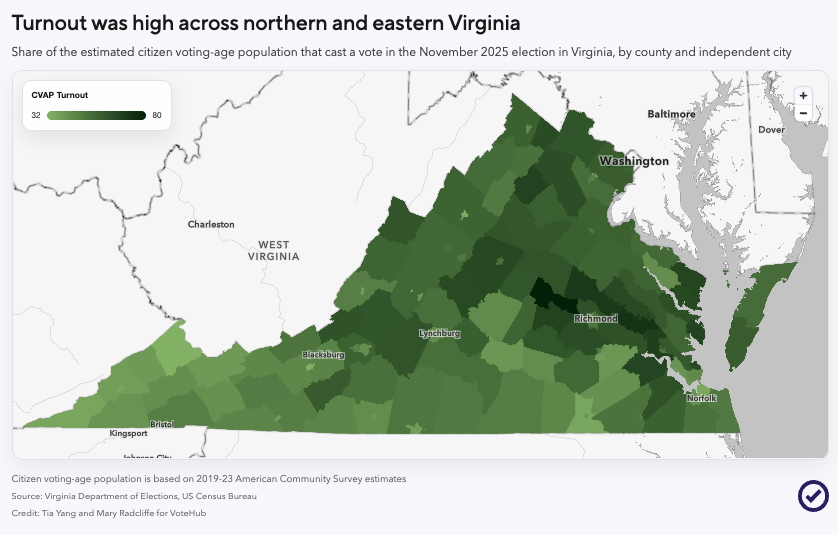
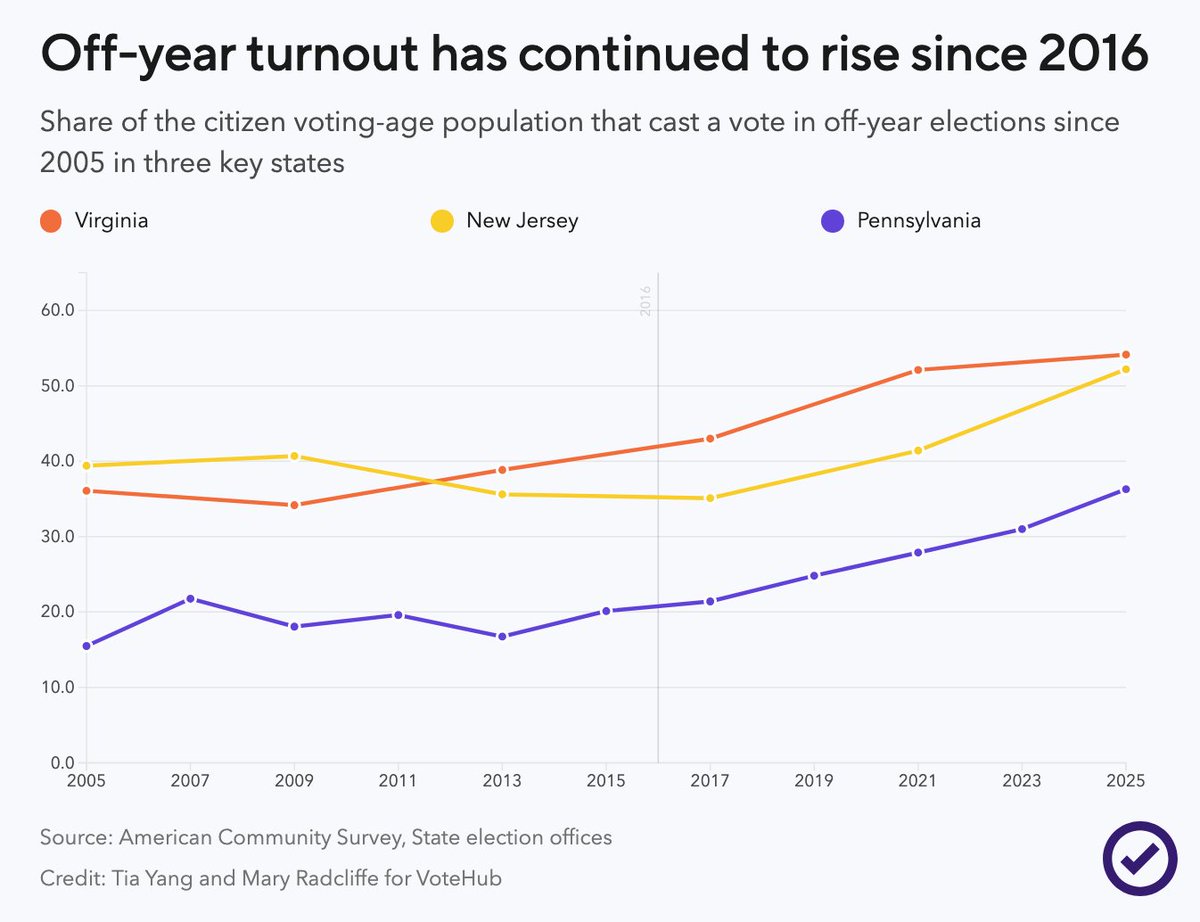
In a new analysis for @VoteHub, @marywitha4 and I dug into county-level turnout in VA, PA, and NJ to explore off-year turnout trends, and how electorates changed after the 2016 election. (Spoiler: suburban voters love to vote.)
@msquared517 Hi Matt, thanks for reading! So that we could consistently compare turnout results to historical elections where complete turnout results by county are not available, turnout was calculated as the total votes for the ballot item(s) at the top of the ticket. (1/2)
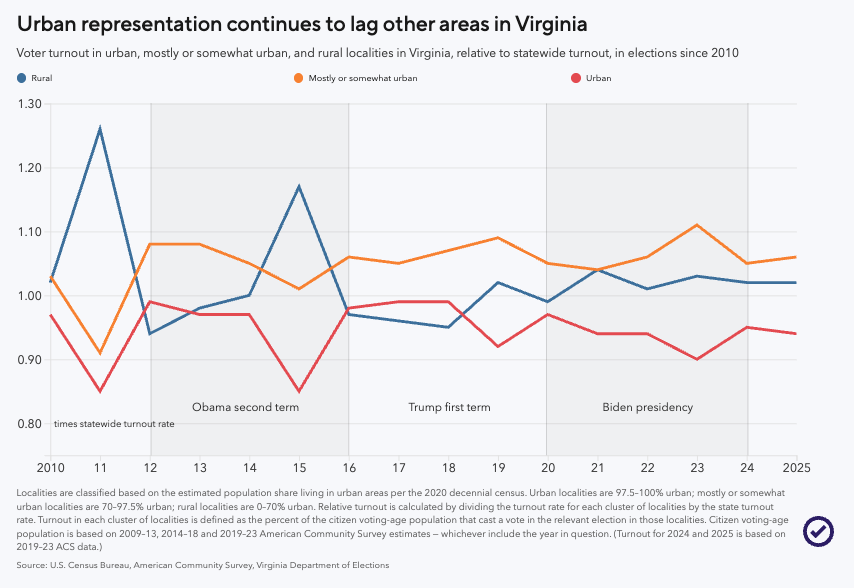
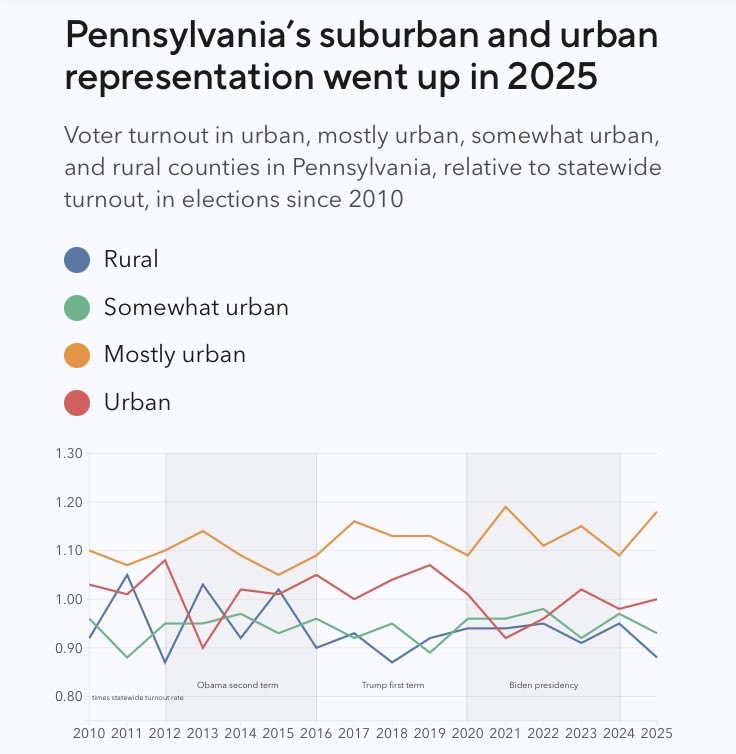
@tsyang27 and I got to add a few more years for one of my favorite charts I’ve ever conceived of. Behold, the urban density spikey charts for PA and VA. And check out the piece below for more turnout analysis, also featuring NJ!
🚨 NEW—Off-year turnout hit a 20-year high in 2025.
Following the same method as their 2023 analysis at 538, @tsyang27 and @marywitha4 analyzed data from PA, VA, and NJ to see how off-year electorates have evolved in recent cycles. Full breakdown below 👇
Some news for '26: Last month was my final at @ABC. Grateful for the fantastic career highlights & a lot of fun along the way.
I'm now sorting out what's next -- if you’re hiring or know someone who is, send them my way. [email protected]