THE NEW AI INFRASTRUCTURE STACK
Piper Sandler mapped the new AI infrastructure stack across 8 layers from the power grid all the way to the agent as AI scaling creates bottlenecks across power, cooling, networking, storage, cloud & inference:
Layer 1 | Power, Grid & Real Estate
• $NEE building renewable power backbone hyperscalers need to scale AI
• $CEG monetizing 24/7 nuclear power AI data centers increasingly require
• $TLN building behind the meter nuclear power model for AI campuses
• $IREN turning scarce power & interconnects into hyperscale AI capacity
• $DLR owning physical real estate underneath global AI infrastructure
• $EQIX owning interconnection layer where AI networks & clouds meet
Layer 2 | Physical Datacenter, Shell & Cooling
• $VRT building 800V DC powertrain needed for next jump in AI rack density
• $SMCI assembling liquid cooled rack systems that turn GPUs into usable compute
Layer 3 | Silicon & Hardware
• $NVDA building compute platform underneath AI economy
• $AMD building second full stack accelerator platform at hyperscale
• $AVGO designing custom AI silicon behind Google TPUs & Meta MTIA as hyperscalers move deeper into proprietary compute
• $GOOGL turning TPUs from an internal advantage into a hardware business sold directly into customer data centers
• $INTC turning 14A into a real external foundry business with $TSLA as an anchor customer and its largest reported foundry deal yet
• $ARM moving into full server CPUs & capturing the full value of the chip instead of dollars per core
Layer 4 | Scale Up & Scale Out Networking
• $ANET building Ethernet backbone connecting hyperscale AI clusters
• $CSCO extending enterprise networking into AI data center fabric
• $CLS manufacturing physical networking hardware connecting AI clusters
Layer 5 | High Performance Storage
• $PSTG using DirectFlash to reclaim power & rack space for AI infrastructure
• $DELL bundling servers & storage into an integrated enterprise AI stack
• $NTAP connecting enterprise data estates to cloud AI workloads
• $HPE bringing enterprise storage into an infrastructure as a service model
Layer 6 | Orchestration & Workloads
• $IBM turning Red Hat OpenShift into enterprise control plane for private & hybrid AI deployments
• $NTNX bringing AI infrastructure stack into private & on prem environments
Layer 7 | GPUaaS & Cloud
• $CRWV proving GPU residual value with fully priced A100 capacity contracted through 2029
• $NBIS building an AI cloud around 5GW of contracted power with customers prepaying 50% of capex
• $DOCN bringing AI compute & inference below hyperscale cloud layer
• $MSFT turning Azure into one of largest distribution layers for AI compute
• $AKAM pushing AI inference closer to where users consume it
• $AMZN monetizing AI through hyperscale cloud infrastructure & its own silicon
• $ORCL building AI cloud capacity against a heavily concentrated backlog of large customer commitments
Layer 8 | Model Execution, Tokens & Agents
• $NET becoming distribution layer between AI agents and the internet as non human traffic crosses more than 50% of its network
• $FSLY moving inference closer to the end user through edge compute
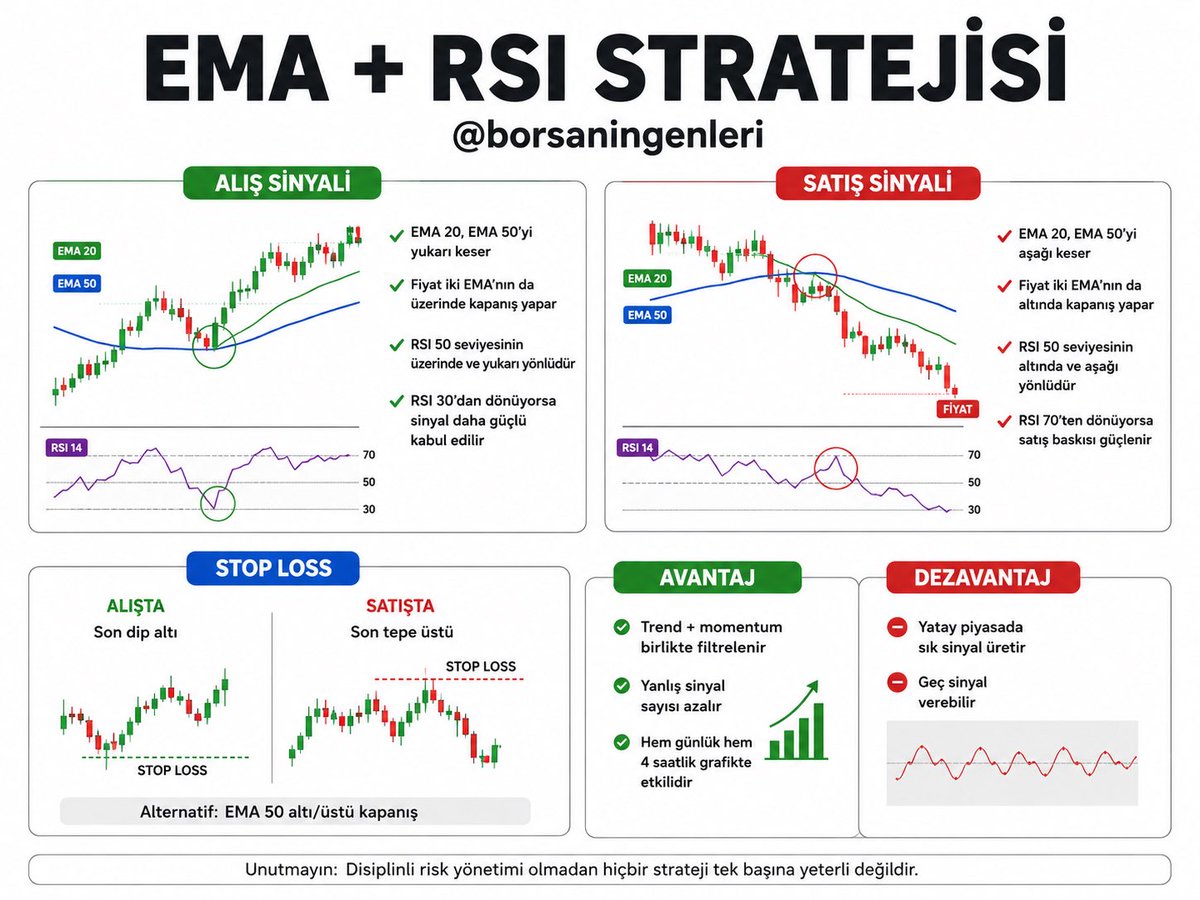
EMA + RSI STRATEJİSİ
#TEKNİKANALİZ#BIST
EMA (Üssel Hareketli Ortalama) + RSI (Göreceli Güç Endeksi) birlikte kullanıldığında hem trend yönünü hem de momentum gücünü ölçerek daha filtreli sinyal üretir.
KULLANILAN GÖSTERGELER
➠ EMA 20 (kısa vade trend)
➠ EMA 50 (orta vade trend)
➠ RSI 14
ALIŞ SİNYALİ
➠ EMA 20, EMA 50’yi yukarı keser
➠ Fiyat iki EMA’nın da üzerinde kapanış yapar
➠ RSI 50 seviyesinin üzerinde ve yukarı yönlüdür
➠ RSI 30’dan dönüyorsa sinyal daha güçlü kabul edilir
SATIŞ SİNYALİ
➠ EMA 20, EMA 50’yi aşağı keser
➠ Fiyat iki EMA’nın da altında kapanış yapar
➠ RSI 50 seviyesinin altında ve aşağı yönlüdür
➠ RSI 70’ten dönüyorsa satış baskısı güçlenir
STOP LOSS
➠ Son dip altı (alışta)
➠ Son tepe üstü (satışta)
➠ Alternatif olarak EMA 50 altı/üstü kapanış
AVANTAJ
➠ Trend + momentum birlikte filtrelenir
➠ Yanlış sinyal sayısı azalır
➠ Hem günlük hem 4 saatlik grafikte etkilidir
DEZAVANTAJ
➠ Yatay piyasada sık sinyal üretir
➠ Geç sinyal verebilir
#netcd #empae #isdmr #doas #eregl #akhan #atatr #beste
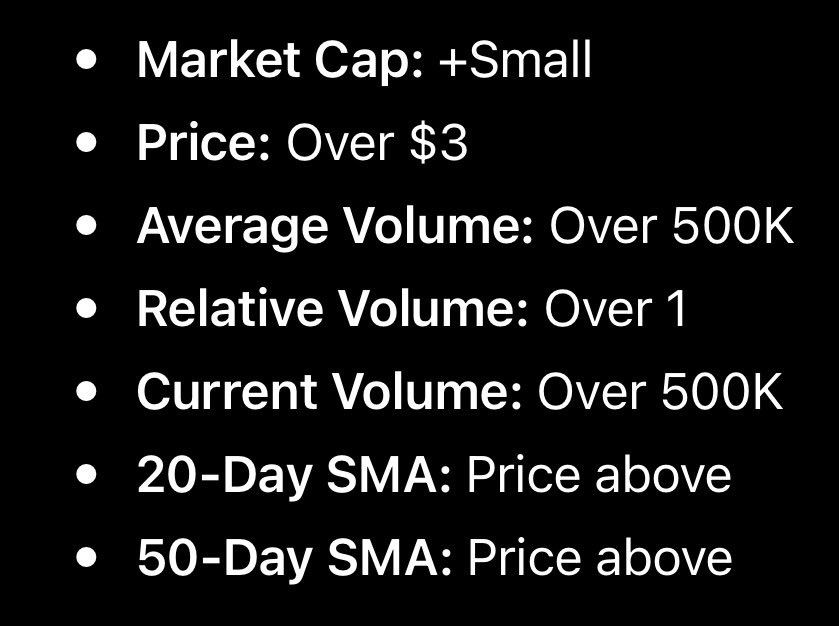
I know this is the BEST Market Scanner
It finds the name in every sector BEFORE they MOVE
Today it found:
$SPCX
$SMCI
$NBIS
$CRWV
Study this. Have this. Use this. Time to make Millions.
Most people use technical indicators to chase breakouts.
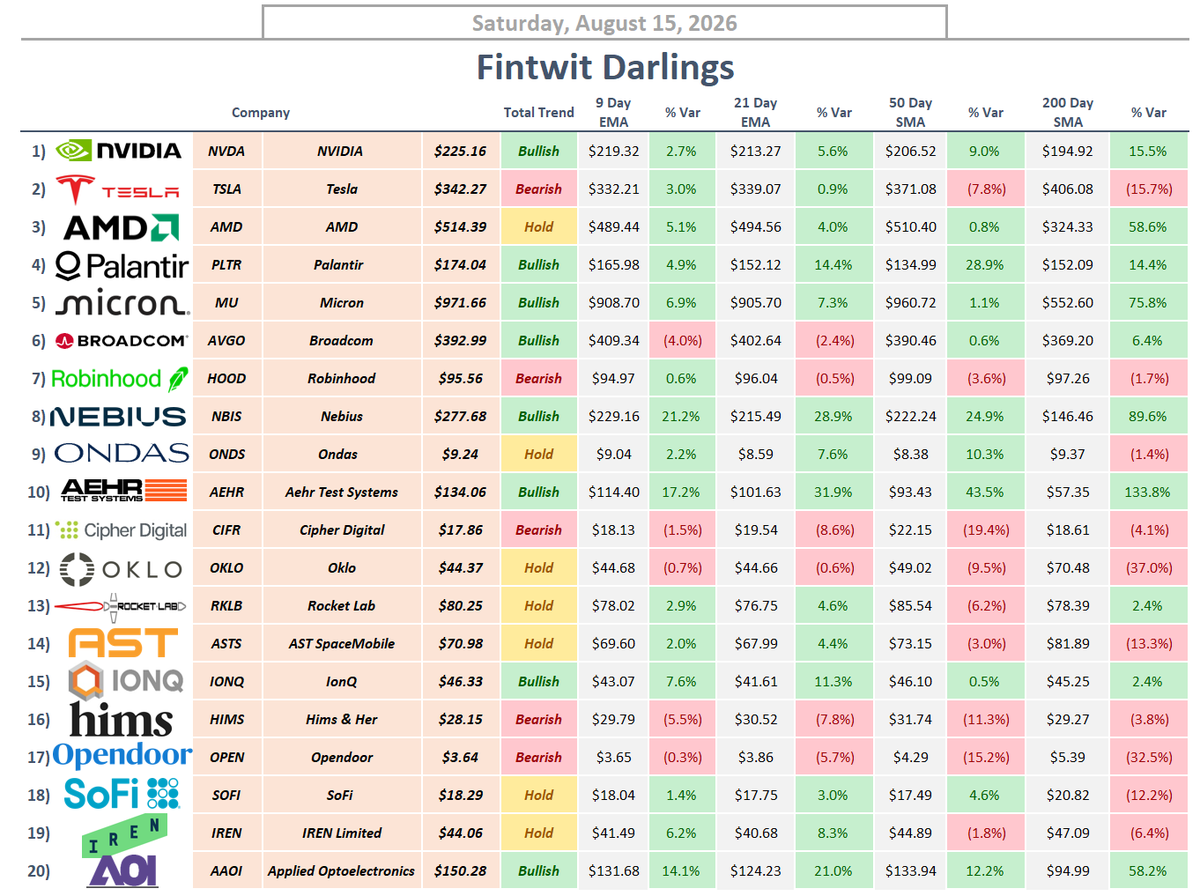
I use them to sell options and time my LEAP entries on stocks like $AMZN $MRVL $IREN $CRDO $RKLB
These are the 5 indicators I lean on before every trade, plus a bonus at the end that tells me how much capital to deploy:
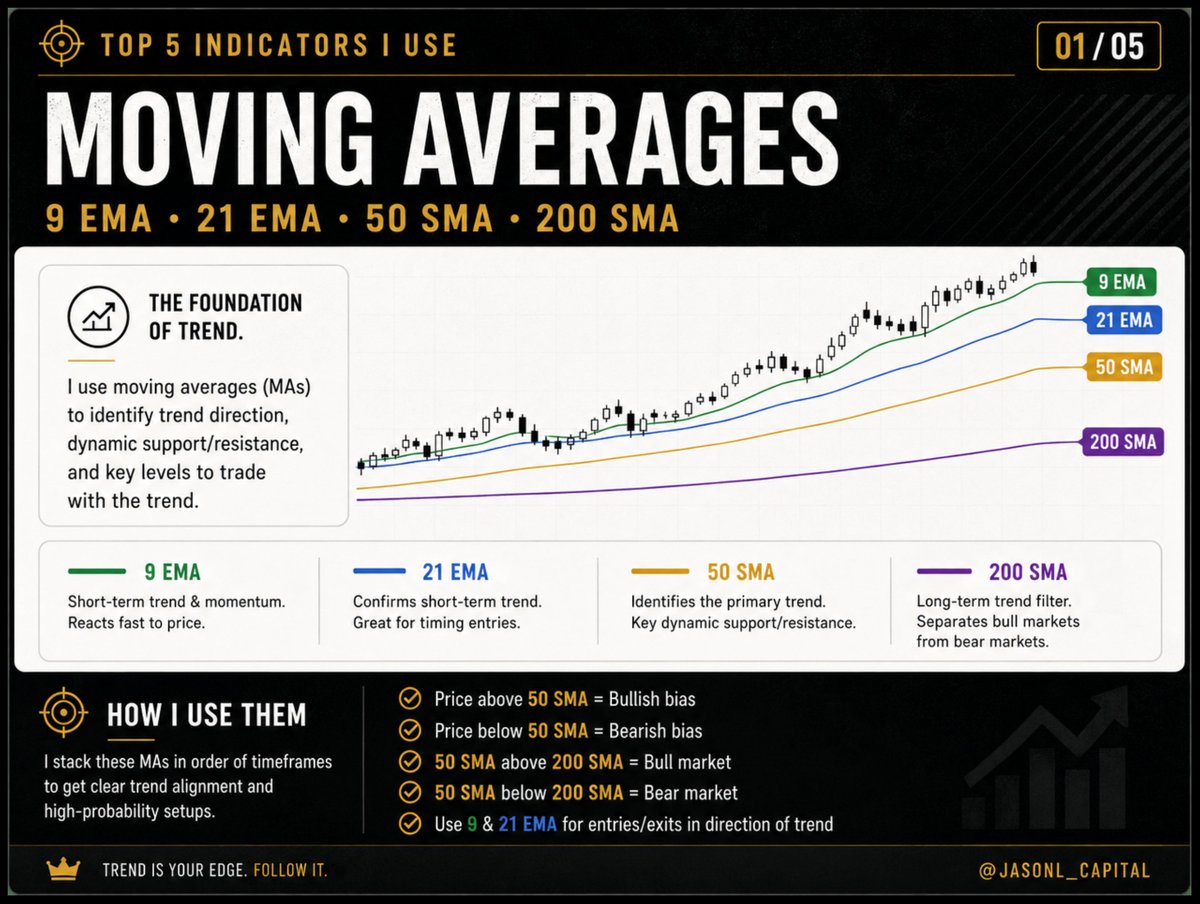
1. Moving Averages (9/21 EMA + 50/200 SMA)
The 50 and 200 SMA give me the regime: I want to be selling puts on stocks holding above a rising 200 SMA. The 9/21 EMA gives me short-term momentum: the 9 crossing back over the 21 after a pullback is usually my window. The 50 SMA also works as a strike guide - a put sold near it means the market has to break real support before assignment is even a conversation.
One of the biggest mistakes new investors and traders make:
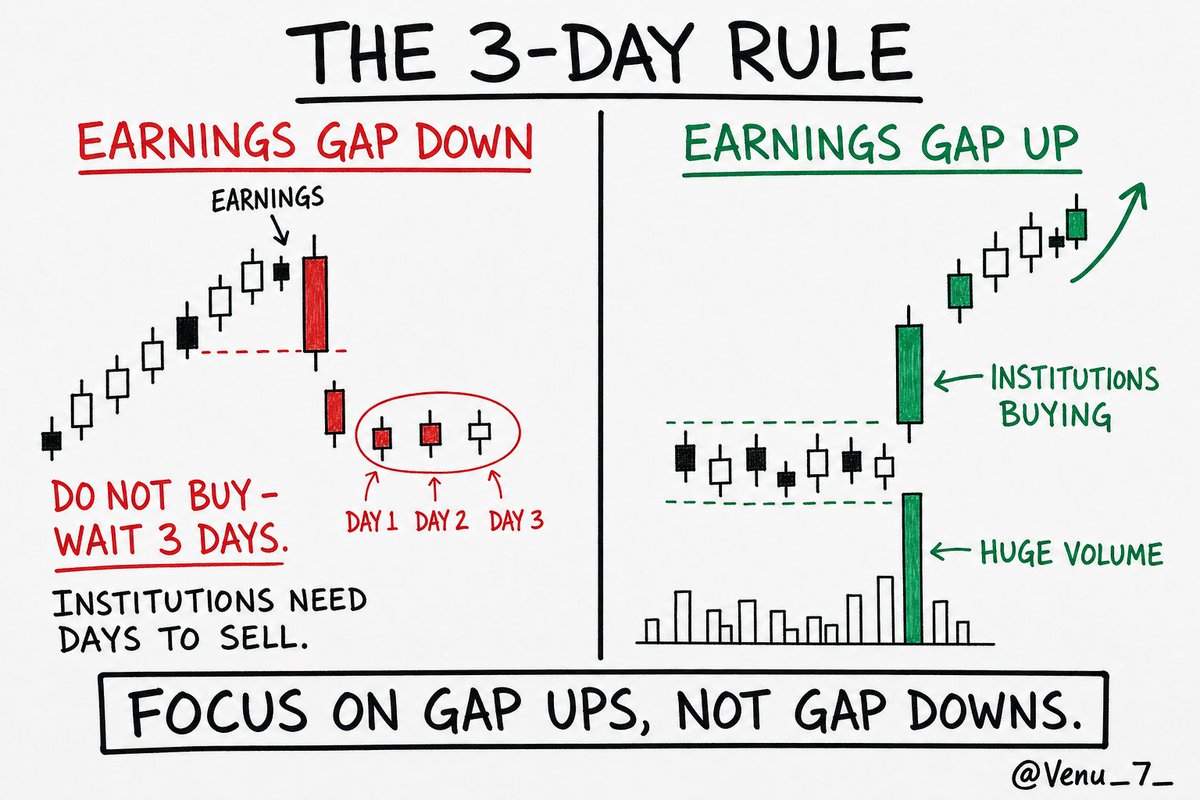
Buying a stock that gaps down after earnings.
It looks like a discount. It's usually a trap. To avoid falling into that trap, follow one simple rule:
The 3-Day Rule.
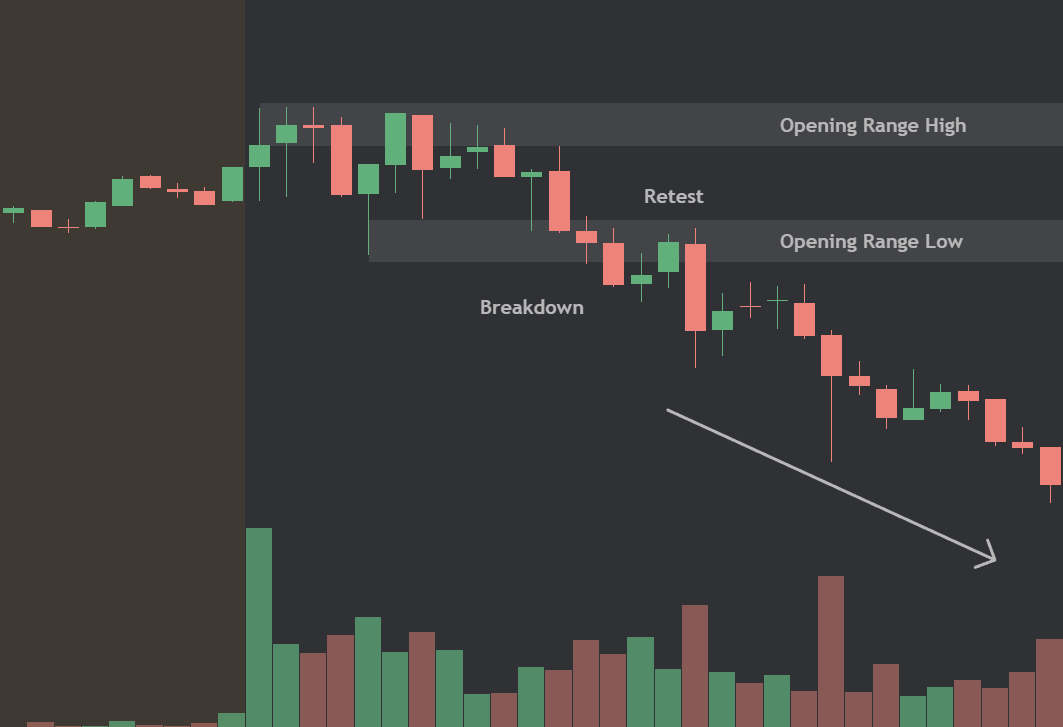
When a stock gaps down on earnings, wait at least 3 trading days before even thinking about buying.
Why?
Institutions holding millions of shares can't exit in one day. The gap down isn't the end of their selling - it's the beginning.
- Day 1: Bounce = dip buyers + short covering, not real demand.
- Days 2-3: You'll see whether the selling pressure actually dries up.
- After Day 3: The stock will tell you if it's stabilizing or still bleeding.
You're trading with evidence, not hope.
And remember:
Our focus should always be on earnings gap ups, not gap downs.
A gap up on heavy volume usually signals institutional buying like $PLTR - and their buying often takes days or even weeks to complete. That's the fuel behind many of the market's biggest winners.
Gap down = big money leaving.
Gap up = big money arriving.
Own what they're accumulating. Don't try to catch what they're distributing.
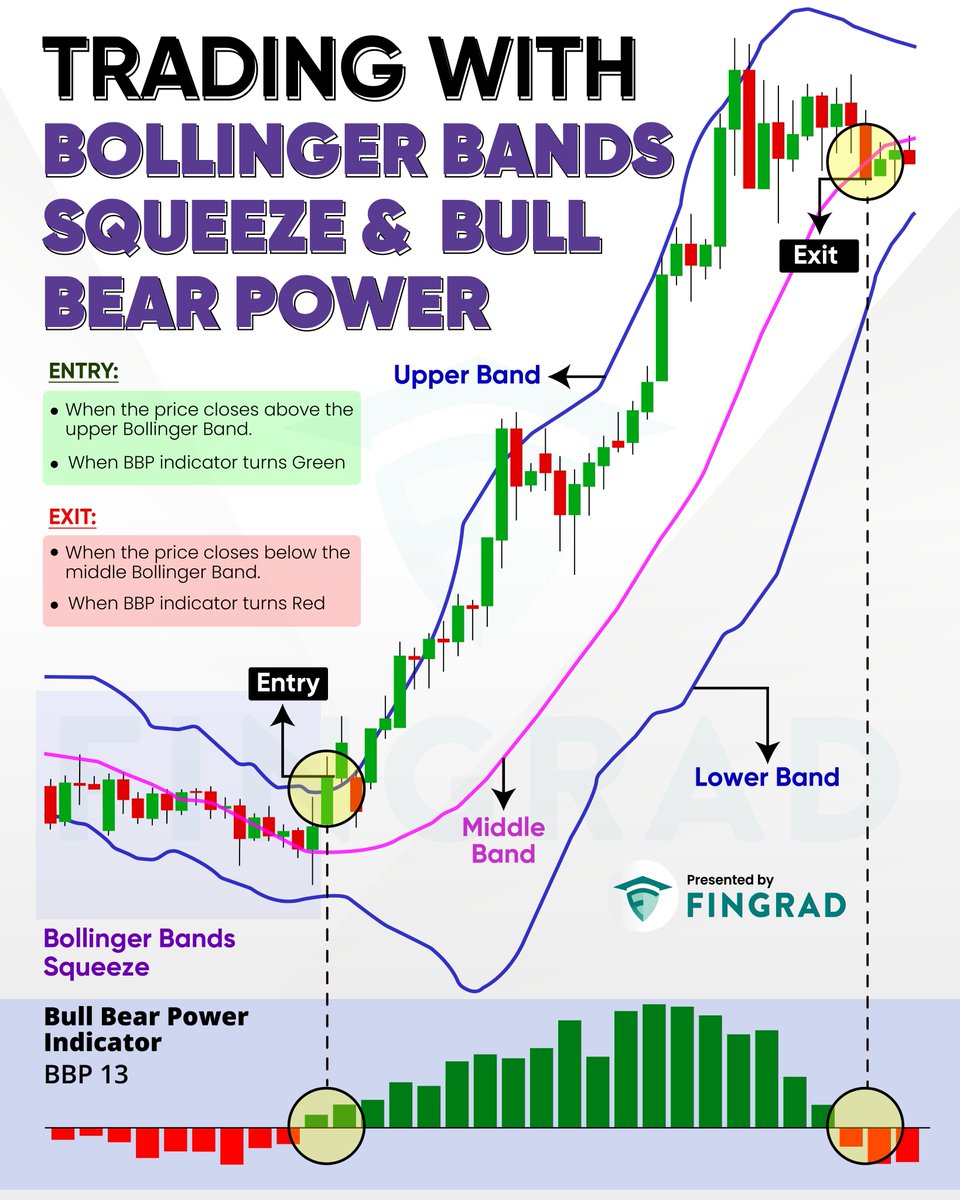
This strategy combines the Bollinger Band Squeeze with the Bull Bear Power (BBP) indicator to identify breakout opportunities. It aims to capture strong trending moves by entering after volatility expansion with bullish momentum confirmation and exiting when momentum weakens.