$RIOT (July 20, 2026-Daily Chart)
The most recent bearish signal (yellow candle) appeared while $RIOT was trading between $26–$29. Since then, the stock has been in a steady downtrend. Following this indicator could have helped investors avoid a 35% drawdown.
Currently, momentum bars show support at $14.30, $16.50 and $17.30. Near-term resistance zone sits between $21.50 and $22.00.
Bear calls at resistance 📉
Puts in the room to seal it
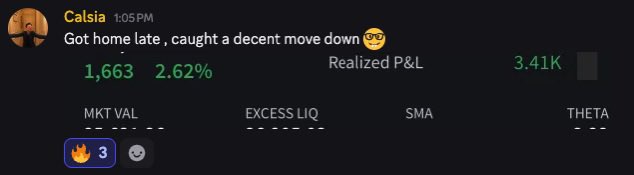
$SPX dropped 40 pts back to the market open while I held puts 💥
That’s how you close the week GREEN ✅
Small account growing ahead of next month’s challenge 💰
Get ready with us and build it the right way 👇
https://t.co/NWob9g2Akg
$SPX $XSP $SPYx
I AM OFFICIALLY RESTARTING THE $1,000 TO $1,000,000 $SPY CHALLENGE NEXT MONDAY! 💸
I’M GOING TO RESTART AND LET EVERYONE FOLLOW MY EXACT TRADES FOR COMPLETELY FREE IN A PRIVATE X GROUP CHAT! 🦅
LIKE, REPOST, & COMMENT “$1K” TO BE ADDED! ❤️🔥
YOU MUST BE FOLLOWING ME TO JOIN! ☢️
👀 Did someone say pancakes for dinner?!
Is your hob up to scratch? Is your kitchen batter-ready? If yours lets you down when it’s time to flip, our trusty Fixers are here to help. Simply book via our website or app. 🔥🛠️
#PancakeDay#HomeRepairs#HomeMaintenance#JustFix