#POCUS#Nephpearls#FOAMed
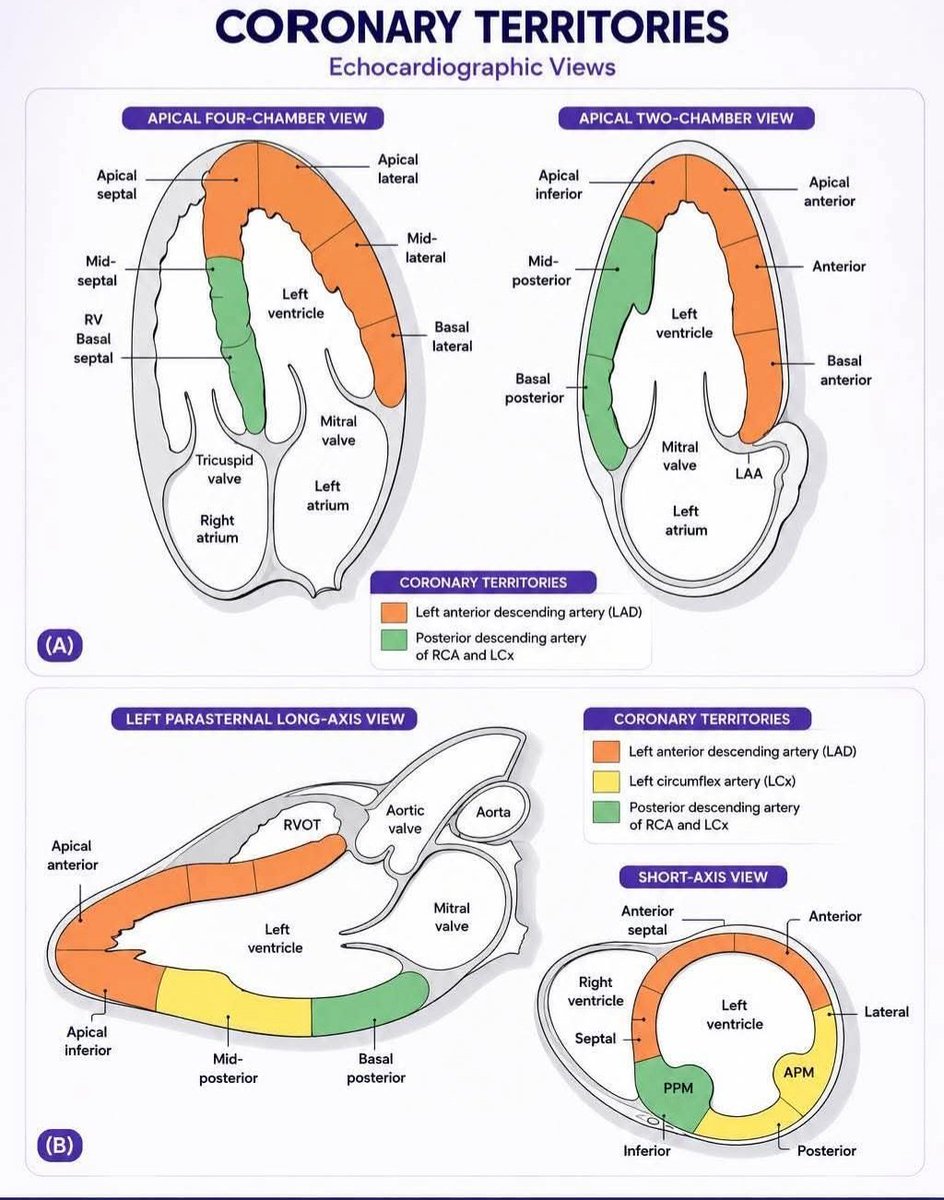
The RV should normally appear smaller than the LV in the apical 4-chamber view and should not exceed about two-thirds of the LV size. If the RV appears equal to or larger than the LV, significant RV dilation should be suspected.
Another helpful visual clue is when the RV becomes the apex-forming ventricle instead of LV. While this finding has not been formally validated with quantitative thresholds, it generally suggests at least moderate RV dilation.
If you remember just one measurement, remember this: the upper limit of normal RV basal diameter is 4.2 cm, measured at end-diastole in an RV-focused apical 4-chamber view.
Also assess RV wall thickness. An RV end-diastolic free wall thickness >5 mm (typically measured in the subcostal view) indicates RV hypertrophy, which often accompanies chronic pressure overload and RV dilation.
Finally, don’t forget to look for interventricular septal flattening on the parasternal short-axis view. Septal flattening (“D-shaped” LV) is another important clue to RV pressure and/or volume overload.
كأول سعودي وعربي..
حقق الدكتور مراد بن عوض الرشيدي عضو هيئة التدريس بكلية طب الأسنان بـ #جامعة_القصيم جائزة Paul P. Taylor Award 2026 المقدمة من الأكاديمية الأمريكية لطب أسنان الأطفال (AAPD)، إحدى أرفع الجوائز العلمية العالمية في تخصص طب أسنان الأطفال.
وتُمنح الجائزة سنويًا لأفضل بحث علمي منشور في مجلة Pediatric Dentistry خلال العام السابق.
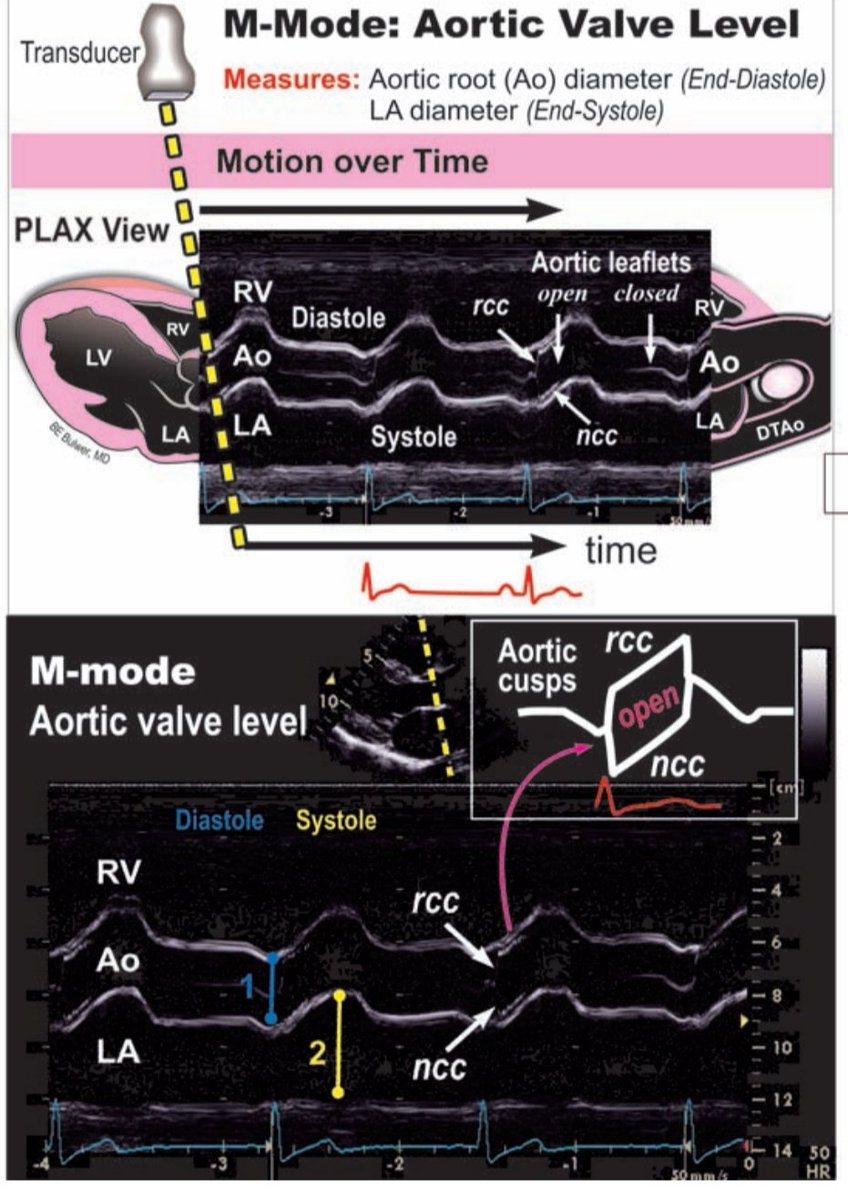
M-Mode Echocardiography at Aortic Valve Level (PLAX View)
This M-mode image captures the motion of the heart over time at the aortic valve level, offering high temporal resolution.
✅ Cursor Alignment
The M-mode cursor (dashed yellow line) is placed perpendicular to the aortic root, passing through the aortic valve cusps (RCC & NCC), the aortic root (Ao), left atrium (LA), and right ventricle (RV). Precise alignment is key for accurate measurement.
✅ Normal Aortic Cusp Motion
- During systole, the RCC and NCC move apart, creating a box-like opening, a hallmark of normal aortic valve excursion.
- During diastole, the cusps coapt centrally, forming a thin linear closure line.
✅ Measurements
1️⃣ Aortic Root Diameter (blue): Measured at end-diastole, when the aortic valve is closed.
2️⃣ Left Atrial Diameter (yellow): Measured at end-systole, when LA size is maximal.
M-mode at the aortic valve level is a fundamental tool for evaluating valve motion, root dilation, and LA enlargement.
Ref: Figure 6.12, Basic Echo PLAX M-mode Assessment
Series of HCM cases:
Case 1:
https://t.co/AwUUNVxMrP
Case 2:
https://t.co/W4Ij1nZOlA
Case 3:
https://t.co/gaaopHhe4Z
Case 4:
https://t.co/8TAHL6cY3w
Case 5:
https://t.co/QK6tjUWsTD
Case 6:
https://t.co/bDz6lMwaQt
Myocardial Performance Index (Tei Index)= Interesting one 😍
The Tei Index, named after Dr. Chuwa Tei is a Doppler-based, noninvasive measure of global ventricular function, combining both systolic & diastolic performance.
How it’s measured:
⬜ Obtained using pulsed and continuous wave Doppler of mitral inflow (A4C view) and LV outflow (A5C view).
⬜ Key time intervals are measured:
a. IVCT ➡️ Isovolumetric Contraction Time
b. IVRT ➡️Isovolumetric Relaxation Time
c. ET ➡️ Ejection Time
Formula:
Tei Index = (IVCT + IVRT) / ET
or
Tei Index = (a - b) / b
a = time from mitral valve closure to opening
b = aortic ejection time
Normal Values:
LV Tei Index: ≤ 0.40
RV Tei Index: ≤ 0.43
Interpretation:
🔵 Higher Tei Index = Worsening ventricular function
🔵 Sensitive for detecting early dysfunction, even when LVEF is preserved.
Clinical Significance:
- Helpful in evaluating cardiomyopathies, heart failure, congenital heart disease, and transplant rejection.
- Valuable in both pediatric and adult cardiology.
(Ref: Bulwer BE & Solomon SD. In Essential Echocardiography: A Companion to Braunwald’s Heart Disease. Elsevier, 2019)
Mastering M-Mode in the PLAX View
This annotated image breaks down how M-mode reflects real-time motion of the heart through three key planes in the parasternal long axis (PLAX) view:
1️⃣ Aortic Valve (AV) M-mode:
▶️ Captures movement of RCC and NCC across the aortic root.
▶️ Systole = AV opens (valve leaflets move apart)
▶️ Diastole = AV closes (leaflets come together)
▶️ Useful for assessing AV motion symmetry, cusp separation, and aortic root dimensions.
2️⃣ Mitral Valve (MV) M-mode:
⬜ Shows anterior and posterior leaflets opening/closing through the cardiac cycle.
⬜ E and A waves represent early diastolic filling and atrial contraction.
⬜ EPSS (E-point septal separation): Increased distance suggests LV systolic dysfunction.
⬜ Abnormal patterns can indicate mitral stenosis, regurgitation, or LV dysfunction.
3️⃣ Left Ventricle (LV) M-mode:
🟦 Measures LV internal diameters at end-diastole (EDD) and end-systole (ESD).
🟦 Also shows septal and posterior wall motion.
🟦 Enables calculation of ejection fraction and wall motion abnormalities.
An excellent visual reference by Dr. BE Bulwer.
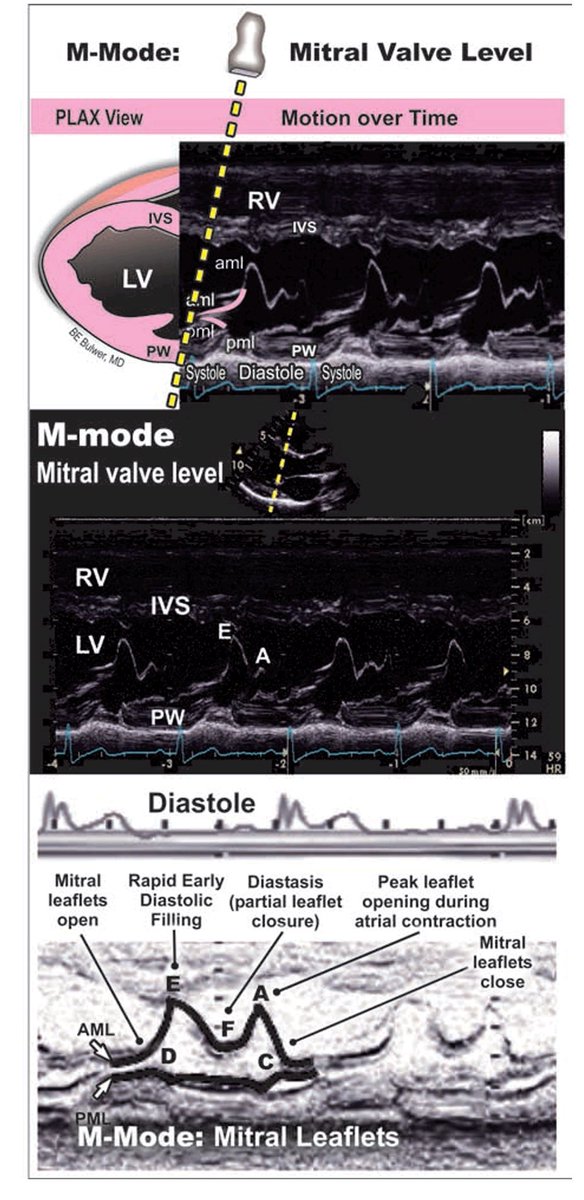
Normal M-mode echocardiography in the parasternal long-axis (PLAX) view at the mitral valve level provides a high–temporal resolution assessment of mitral leaflet motion and left ventricular filling dynamics.
The characteristic cyclical pattern of the mitral valve reflects transmitral inflow physiology across diastole. In early diastole, there is abrupt opening of the leaflets, producing the E wave, which corresponds to rapid passive LV filling driven by the pressure gradient between the left atrium and left ventricle. This is followed by diastasis, during which the pressure gradient decreases and the leaflets move toward partial closure. In late diastole, atrial contraction generates the A wave, resulting in a secondary opening of the mitral leaflets and contributing to final ventricular filling.
The E–F slope of the anterior mitral leaflet (AML) is a key parameter and reflects the rate of early diastolic closure. A steep EF slope indicates normal, brisk LV filling and good compliance, whereas a reduced or flattened slope suggests impaired filling dynamics, classically seen in conditions such as mitral stenosis. In such cases, the normal M-mode waveform becomes more "box-like," reflecting restricted leaflet mobility and reduced transmitral flow.
The posterior mitral leaflet (PML) demonstrates motion that mirrors the AML, maintaining coordinated valve dynamics. Additional structures visualized in this M-mode line include the interventricular septum (IVS) and the posterior wall of the left ventricle, which help provide anatomical context and timing relative to the cardiac cycle.
Overall, M-mode at the mitral valve level remains a simple yet powerful tool for understanding diastolic physiology, valve motion, and early pathological changes in mitral valve disease.