A Russian lab worker has died and thousands are in quarantine after a plague outbreak, per Sky News.
The World Health Organisation says the pneumonic form of plague is especially contagious and "can trigger severe epidemics".
Remind me where $STLN CFO and COO both worked previously? Oh that’s right, $MCK.
$MCK telling you value-add HC services multiples are too cheap and $STLN no doubt on their radar after $OPCH.
Probably wrong, NFA.
$STIM has indeed hit the inflection, and market has a hard time digesting operating lvg from volume acceleration.
VWAP something squiggly line drawers often miss. Like, why do we care what retail is doing in tiny lots again?
Probably wrong, NFA.
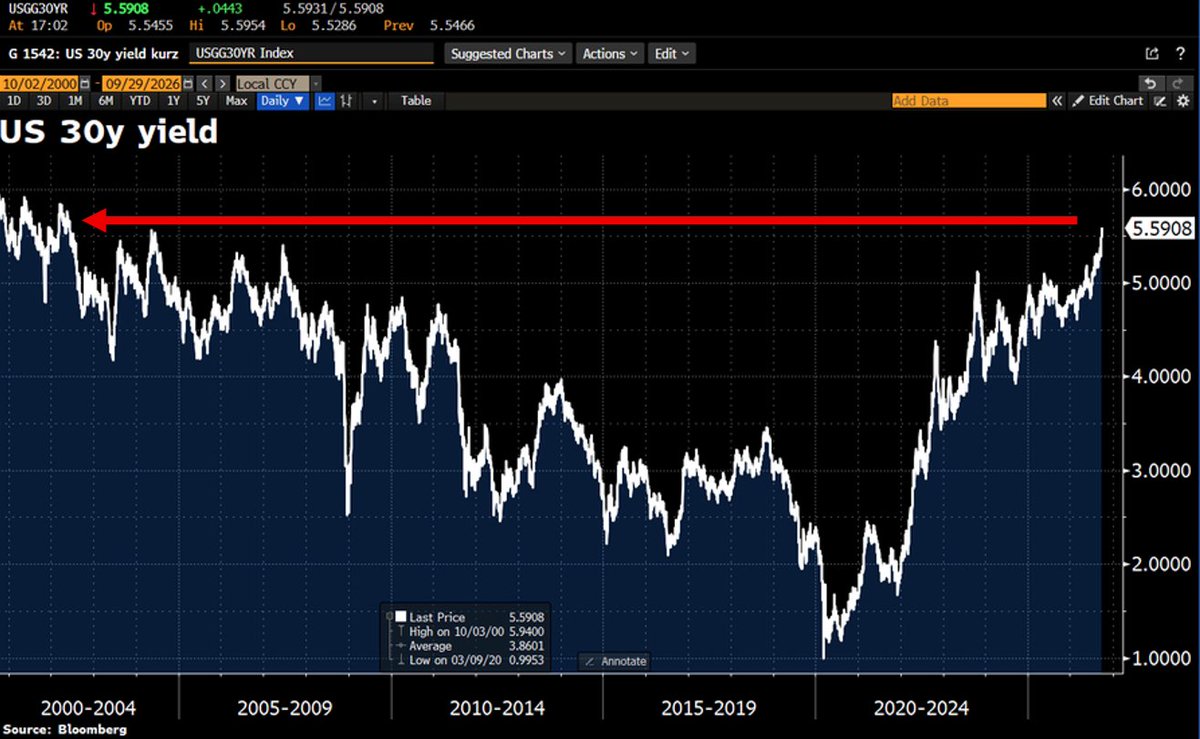
US Treasury yields are absolutely EXPLODING:
The 30-year Treasury yield is up to 5.61%, its highest level in 24 years.
This marks a +33 basis points move in just one week!
This is unprecedented.
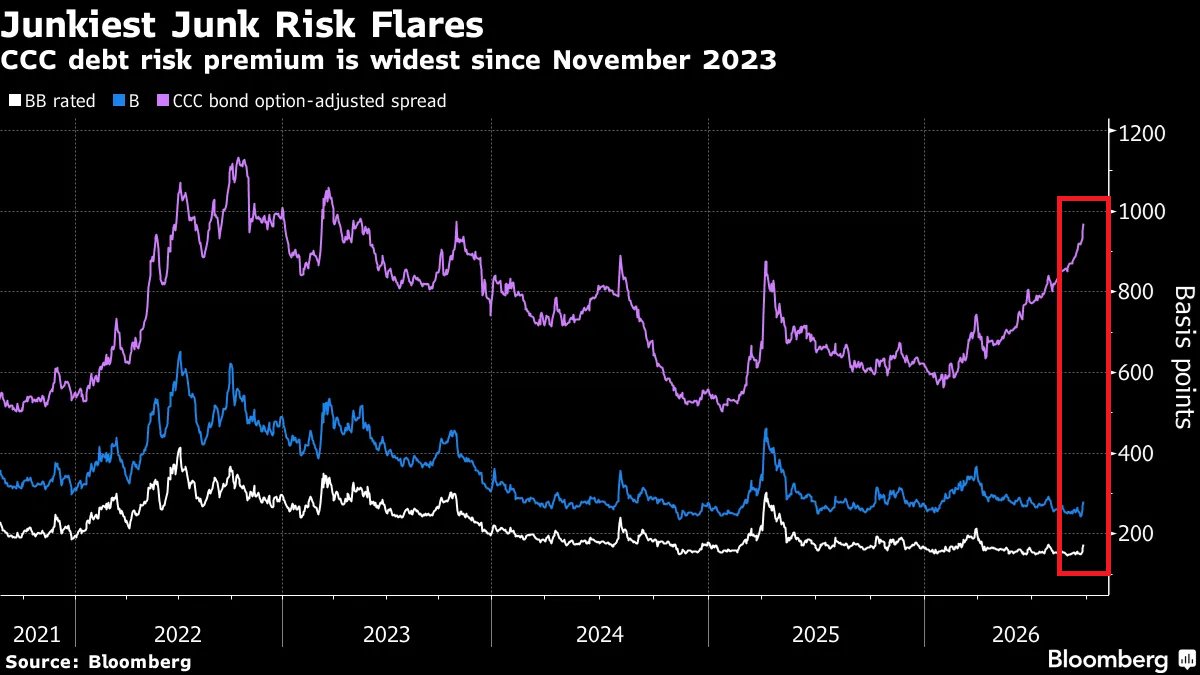
Credit risk is skyrocketing in the junk bond market:
The average spread on US high-yield bonds has widened to 294 basis points, its highest level since April, as a surge in corporate bond issuance puts pressure on credit markets.
The deterioration is much more severe at the lowest-quality end, with CCC-rated bond spreads spiking to 968 basis points, their widest level since November 2023 and approaching the March 2023 banking crisis levels.
This comes as September high-yield issuance has already reached $38.51 billion, making it the busiest month of the year, while another $44.4 billion of investment-grade high-yield bonds is expected to be issued by Paramount this week.
Rising Treasury yields are adding further pressure, making investors demand greater compensation for taking corporate credit risk.
Meanwhile, Goldman estimates that nearly $600 billion of AI-linked debt has been issued across credit markets so far in 2026, with ~40% coming from hyperscalers.
The weakest parts of the corporate bond market are coming under severe pressure.
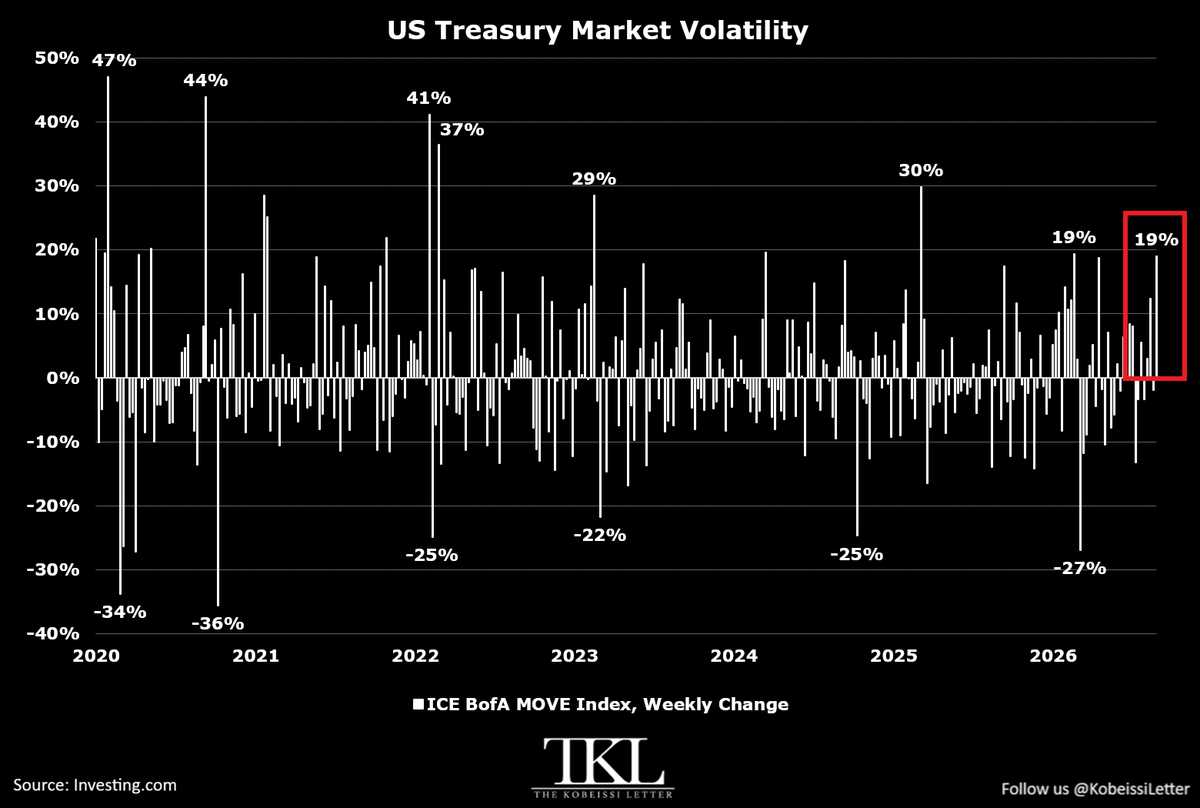
US bond market volatility is at historic levels.
The MOVE index jumped +19% last week, its largest weekly increase since April 2025, following "Liberation Day."
This index is also called the "VIX of bonds" and measures the yield volatility of 2Y, 5Y, 10Y, and 30Y Treasuries.
This marks its 3rd-largest weekly increase since the 2022 bear market.
The move comes as the 10Y Note Yield jumped +17 basis points last week, to 5.17%, its highest level since June 2007.
At the same time, the 30Y Note Yield rose +16 basis points and surpassed 5.50% for the first time since June 2004.
To put this into perspective, in the week ending March 17th, 2023, the MOVE Index surged +29% following the US banking crisis, when 3 regional banks collapsed.
The US Treasury market is experiencing crisis-like volatility.
S&P 500 returns over the last four years:
2023: 🟢 +26.79%
2024: 🟢 +25.73%
2025: 🟢 +18.14%
2026: 🟢 +12.26% (YTD)
Without looking it up, who knows the last time we had a 4 year stretch with better returns than this?
US Treasuries are lagging equities by a historic margin:
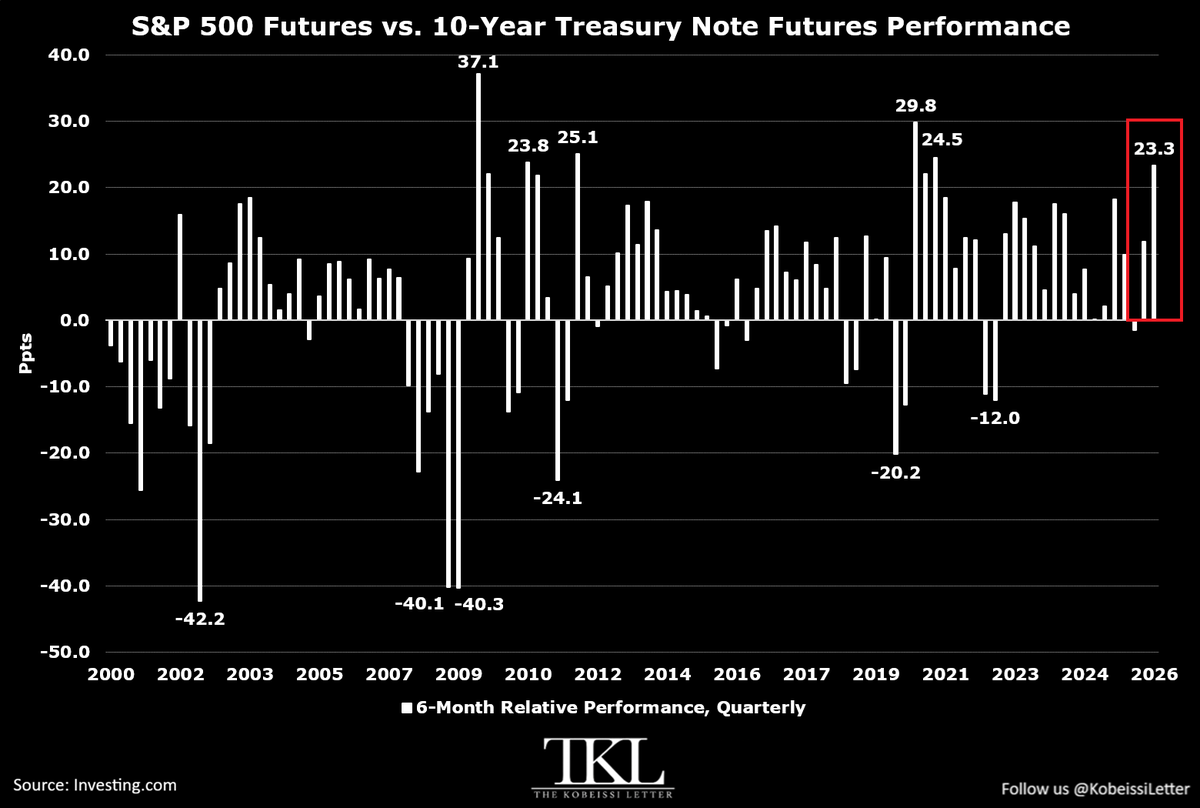
S&P 500 futures have outperformed 10Y Treasury note futures by +23.3 percentage points over the last 6 months, the largest outperformance since 2021.
This also marks the 6th-largest underperformance of 10Y Note futures this century.
This comes as S&P 500 futures have risen +17.6% over this period, trading near their all-time high.
At the same time, 10Y Note futures have declined -5.7%, to their lowest level since June 2007.
To put this into perspective, 10Y Note futures outperformed S&P 500 futures by as much as +40.3 percentage points during the 6-month period in the 2008 Financial Crisis.
Stocks and Treasuries are diverging at a historic pace.
US equity market breadth is extremely weak:
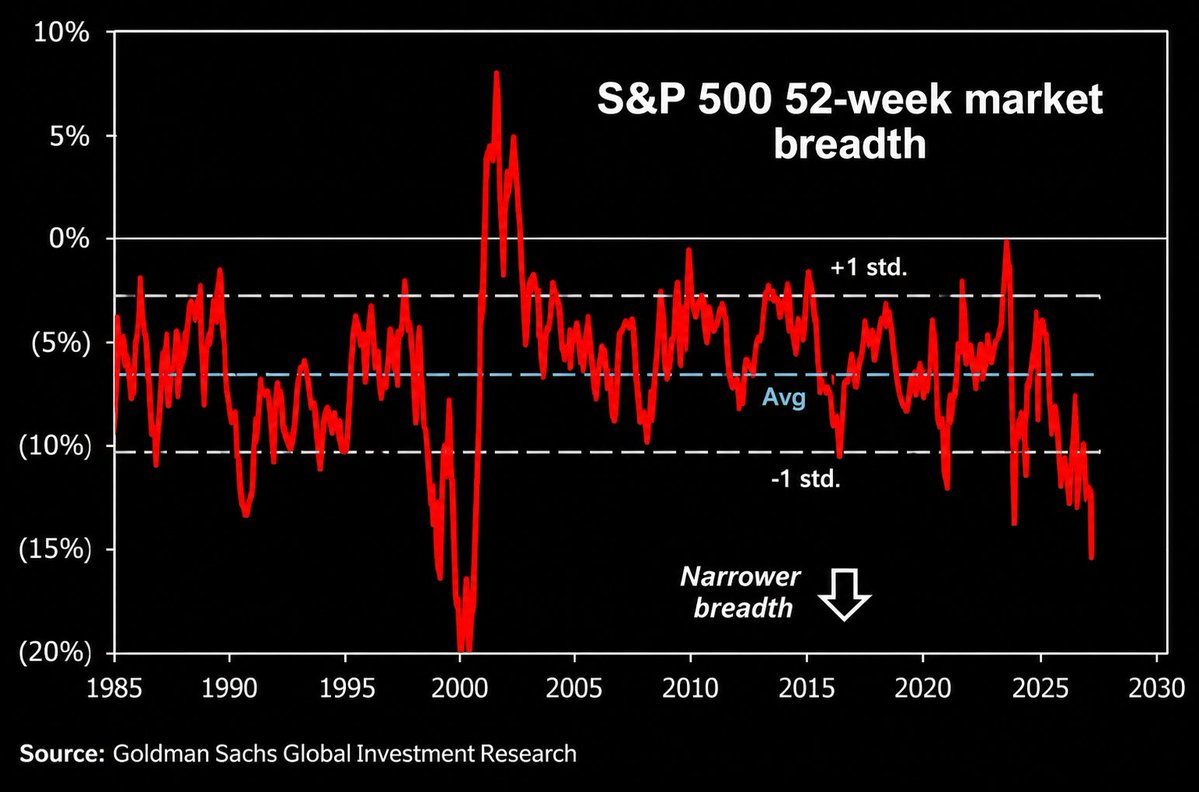
S&P 500 market breadth has fallen to nearly -15%, its lowest level since the 2000 Dot-Com Bubble and far below its long-term average of around -6%.
This measures how far the S&P 500 index is from its 52-week high relative to the median stock.
This comes as the index is near its highs while the average stock is far below its own peak.
Furthermore, ~25% of S&P 500 stocks are above their 50-day moving average, while fewer than 50% are above their 200-day moving average, both at their lowest levels since early April.
All while NYSE 52-week lows have exceeded new highs for 10 straight trading sessions and on 14 of the past 15 sessions.
S&P 500 index performance is masking a lot of weakness across the broader market.