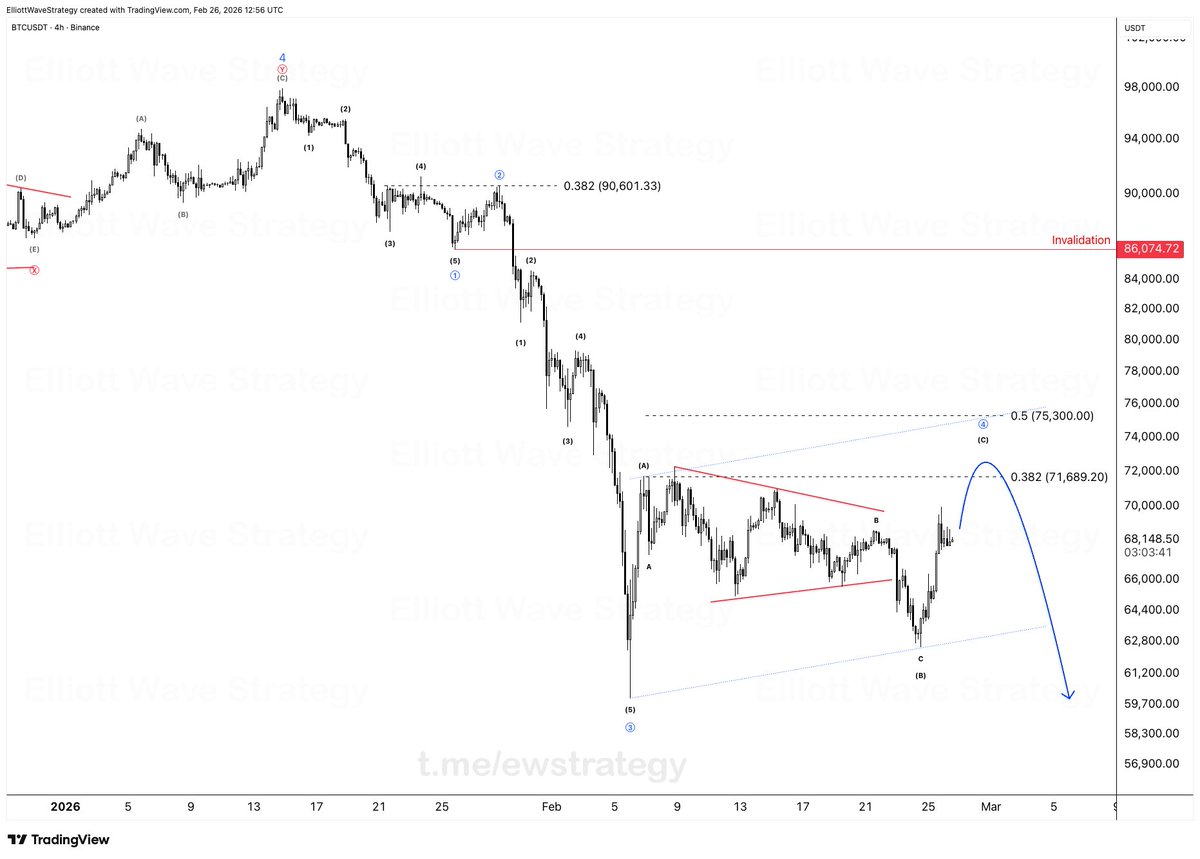
$BTCUSDT is setting the ultimate Bull Trap. 🪤
Wave 4 is extending, giving late buyers false hope. But the structural reality remains 100% Bearish. We are tracking this A-B-C move right into the heavy reversal zone.
Once this relief rally hits the structural resistance ($71.6K)... Wave 5 initiates. 📉
Don't be someone else's exit liquidity. Trade the structure, not the FOMO.
#Cardano (#ADA) 🇺🇸 Expected Crypto Path on the 4-Hour Timeframe
🐻 Bears in Control
👌 The bearish outlook dominates the pair’s direction, as we have already seen a strong decline through the internal structure of wave (1) within an impulsive downward move. This move could represent waves (3)–(5) within wave 5 of a larger decline, targeting the 0.2379 – 0.2024 area as an important support zone.
📉 If no reversal appears at this level, the decline may extend further through the sub-waves of wave 5, implying continued selling pressure in the medium term.
⏳ In the near term, we may see the formation of wave two, which could take a corrective form such as a sharp pattern contained within a price channel. A break of a key level would confirm the continuation of the downtrend. 🔑
📊 Monitoring price development remains essential to determine the next moves.
Our Daily Premium Analysis 👉 : https://t.co/p1Y24s1hGo…
For Our Educational Program Analysis 👉 :
https://t.co/XBwdSyq4uP…
#elliottwave #tradingview #technicalanalysis #swingtrading #waveanalysis #BTCUSD #cryptocurrencies #btctrading #forexdubai #forexeurope #forexuk #ETHUSD #tradingstrategies #priceactiontrader #ethereumtrading #ethereuminvestment #ethereumprice #bitcoinsignals #priceactiontrading #forexmalaysia #forexespanol #forexfrance #tradingacademy #forexaustralia #bitcointrading #Dogecoin #ADAUSDT
#BTCUSDT
As we warned in our last post: "Do not mistake this bounce for a new Bull Market.”
We are currently consolidating in Wave 4.
Technical Reality:
• Resistance: Price is struggling to break the 0.382 Fib ($71,689).
• Pattern: A bearish continuation structure (Red Lines) is forming.
• Projection: The blue path shows one final shakeout before the real drop!
The trend is still your friend, and the trend is DOWN!
#Bitcoin - (#BTCUSD) 🇺🇸
Follow-up on the Expected Wave Path on the 4-Hour Timeframe
A Decline Followed by a Rise! 🚀
One of the proposed scenarios is the formation of an impulsive wave within a contracting diagonal pattern, representing wave (1)/(A). 📈
We expect a downward move targeting common correction zones, which align with the Fibonacci ratios of 50–78.60% of the length of the previous wave. 📊
If reversal signals appear from these areas, this could be a positive indication supporting the bullish scenario! 🌟 Additionally, breaking a key level may further confirm this outlook. 🔑
Bullish Wave Targets:
The target of the upward wave is to achieve at least a new high, and ideally reach 100% of the length of wave (1)/(A)! 🏆
For Our Daily Premium Analysis 👉 : https://t.co/p1Y24s1hGo…
For Our Educational Program Analysis 👉 :
https://t.co/XBwdSyq4uP…
#elliottwave #tradingview #technicalanalysis #swingtrading #waveanalysis #BTCUSD #cryptocurrencies #btctrading #forexdubai #forexeurope #forexuk #ETHUSD #tradingstrategies #priceactiontrader #ethereumtrading #ethereuminvestment #ethereumprice #bitcoinsignals #priceactiontrading #forexmalaysia #forexespanol #forexfrance #tradingacademy #forexaustralia #bitcointrading #Dogecoin #BTCUSDT
🚨 BREAKING
THE OCTOBER FLASHCRASH INSIDER JUST OPENED EVEN MORE $ETH LONGS, NOW TOTALING $220 MILLION!
AND ONCE AGAIN, HE DID IT RIGHT BEFORE TRUMP ANNOUNCEMENT!
ALL EYES ON THE INSIDER 👀
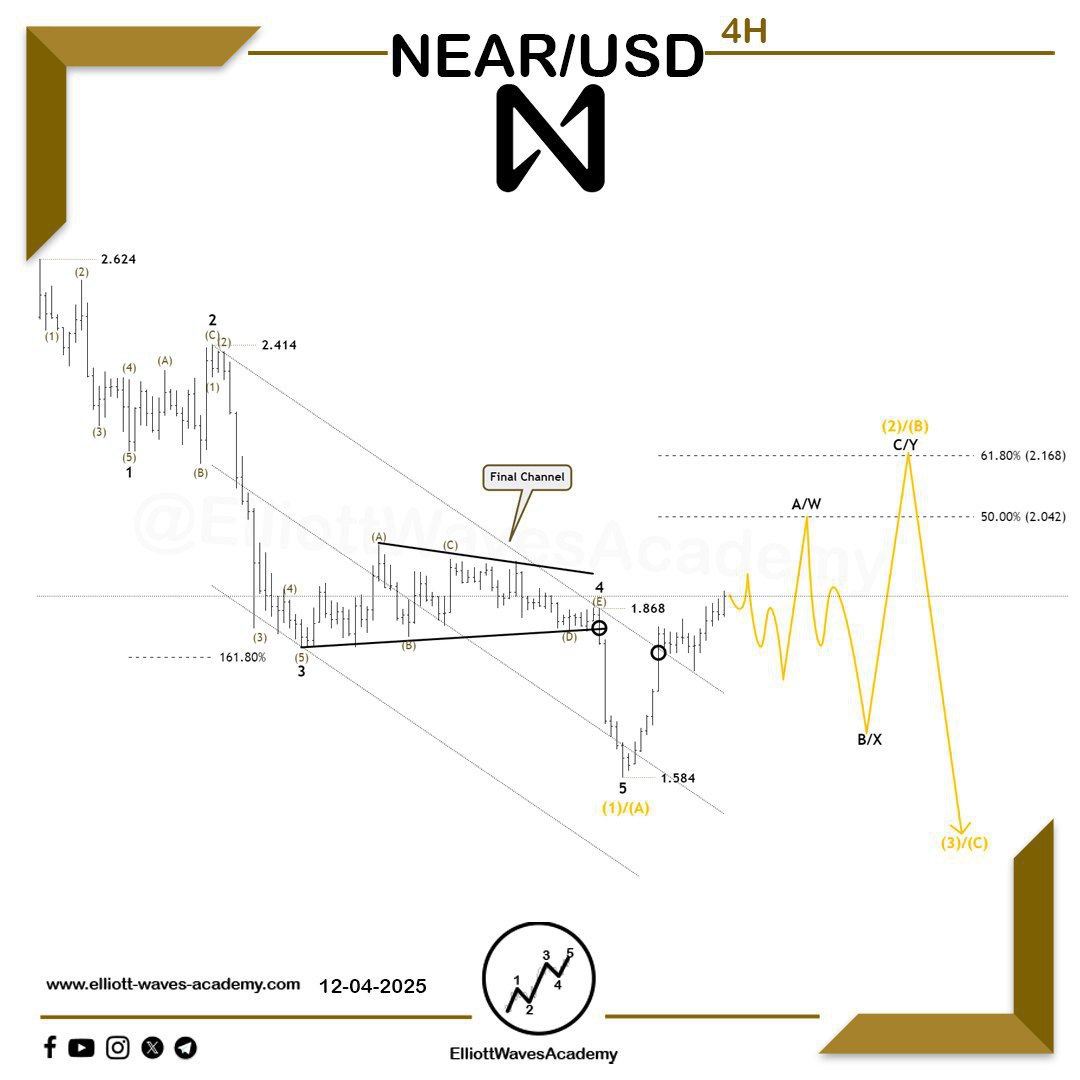
Tracking the wave count of the cryptocurrency #NEAR 🇺🇸 on the 4-hour timeframe:
Ongoing recovery 📈
🧐 It appears that the downward impulsive wave has come to an end, as indicated by the breakout of a key level specific to this bearish wave, in addition to breaking above the upper boundary of the ending channel.
Expectations 🚀
1. A recovery in price through wave A/W.
2. A minor corrective wave representing wave B/X.
3. A subsequent impulse through wave C/Y.
4. Price reaching the 50–61.8% zone.
✨ Closely monitoring these movements is essential to strengthen the upcoming bullish outlook and achieve the desired targets, as a breakout above the previous high would support further upside later on.
For Our Daily Premium Analysis 👉 : https://t.co/p1Y24s1hGo…
For Our Educational Program Analysis 👉 :
https://t.co/XBwdSyq4uP…
#elliottwave #tradingview #technicalanalysis #swingtrading #waveanalysis #BTCUSD #cryptocurrencies #btctrading #forexdubai #forexeurope #forexuk #ETHUSD #tradingstrategies #priceactiontrader #ethereumtrading #ethereuminvestment #ethereumprice #bitcoinsignals #priceactiontrading #forexmalaysia #forexespanol #forexfrance #tradingacademy #forexaustralia #bitcointrading #Dogecoin #NEARUSDT
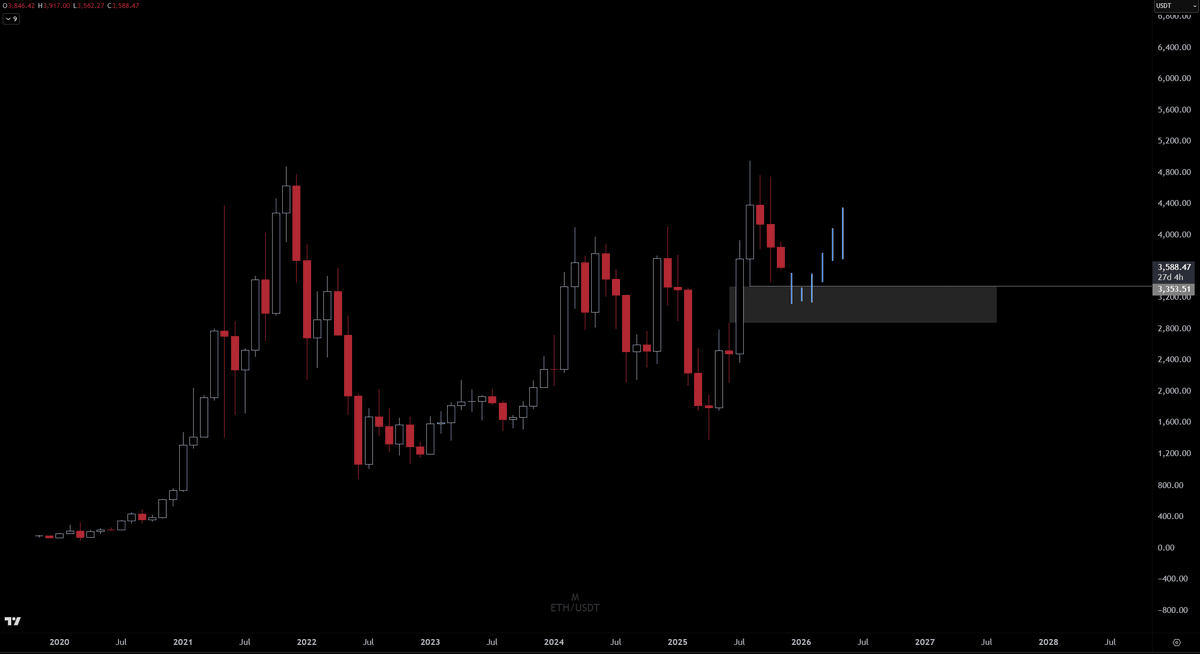
$ETH
Monthly FVG is where I'd be interested, 3350-2900~
Wide zone, but yeah, this market looks like it needs some juice before heading back up. That may mean some consolidation or wicks into the Monthly FVG.