e this by taking the ratio between Supply in Profit and Supply in Loss. This oscillator has achieved escape velocity this year, confirming the transition out of a regime of loss dominance near cycle lows, observed on only 415-of-4638 trading d
ed out of a regime of unrealized loss, towards one of unrealized profit, shown by the sharp divergence between supply held in profit vs loss. As this takes place, the incen
al baseline of around 2k transactions per block, to over 4.3k per block. Since Bitcoin has a blocksize limit, such a significant increase in transaction counts
rint of text inscriptions, and large the fees BRC-20 users were willing to pay, miners were able to fill blocks with a record number of transactions. A new ATH dail
rice action to the $21k to $23k region involved reclaiming multiple on-chain pricing models, which has historically signified a psychological shift in holder behavior patter
ining 'price', which accounting for all the mining variables in one number. A log-log regression between Market Cap and Difficulty yields a R2 value above 0.95, indicative of the strong relationship between asset value and mining competition.
Regression Model is one approach for estimating the all-in-sustaining-cost of production for a unit of BTC. It considers Difficulty as the ultimate distillatio
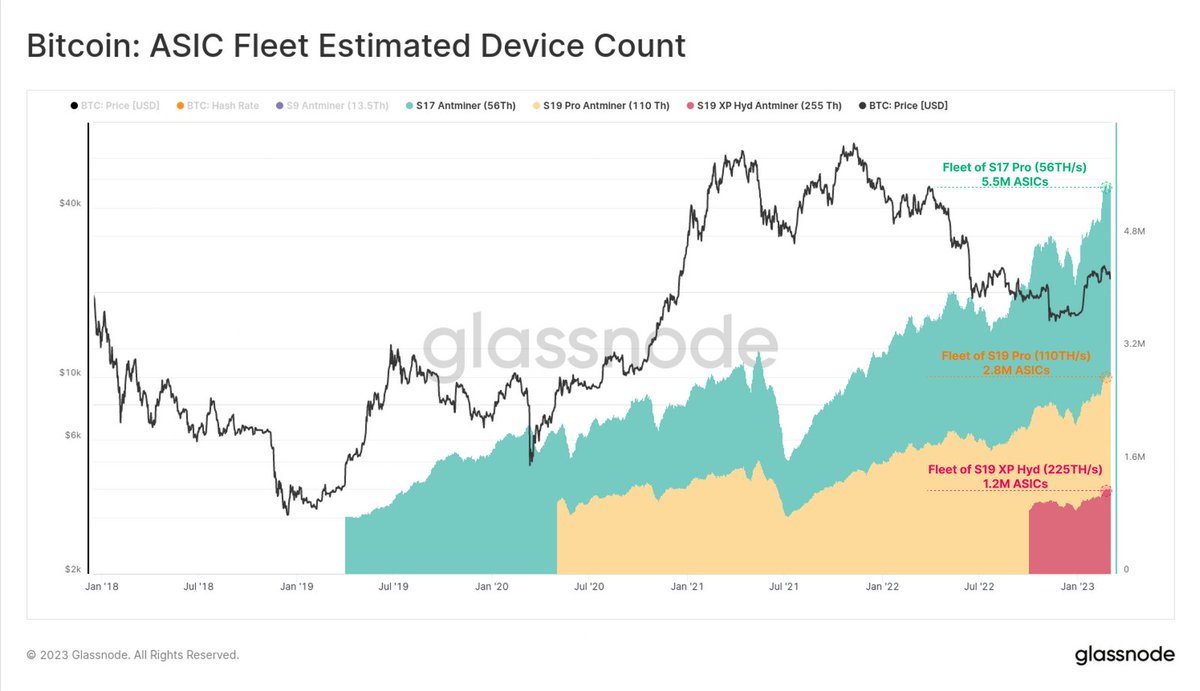
es computing many trillions of SHA-256 hashes each second. The chart below shows the estimated number of modern rigs (assuming a single device fleet) would be required to generate the observed hashrate, with counts in the millions of ASIC devices.
e considered as the number of attempts miners make in aggregate, per second, to find a valid block hash. The observed hashrate is generated by millions of ASIC ma