A low-cost, high-yield model for colorectal screening in vulnerable populations is worth the bang for the buck, according to a new study by @UTAustin’s #DellMed & @TheLBJSchool of Public Affairs. https://t.co/uJ4uw3cgnh
1st time at @UCSFHospitals we have near real-time data fueling a campus-wide dashboard! Response to #COVID19 includes forming DAV (data/analyt/vis) collab, pooling skills across the org, transforming how we work. 🦄dash/mart dev by Rhiannon Croci, J Yim. #healthinformatics
again:
pregnant people are not more likely to be severely infected by #COVID19 than non-pregnant people
they are more likely to be severely AFFECTED
they deserve our focus and they deserve our innovation to ensure we can provide the care and support they need
The way you spend your time changes significantly when you have a baby (especially if you're a woman who decides to breastfeed). I think this is best explained visually. Here's what my time looks like before and after:
@ChrisMoriates@CostsofCare My bill was over $50k for my outpatient 5th metatarsal ORIF. Guesses from Welsh and Norwegian colleagues: $2-5k. Off by an order of magnitude! Shows how foreign and ridiculous our US healthcare billing practices are to the rest of the world. #choosingwiselyberlin
.@ValueVictoria discussing w colleagues from Wales and Netherlands her story of the bill from her outpatient foot surgery and the absurdity of medical costs in the US.
<jaws dropped>
“But that’s immoral!”
“This is so foreign, it’s like we are talking to aliens with tentacles”
20 medical educators from around the world meeting today in Berlin to advance Choosing Wisely education in our countries.
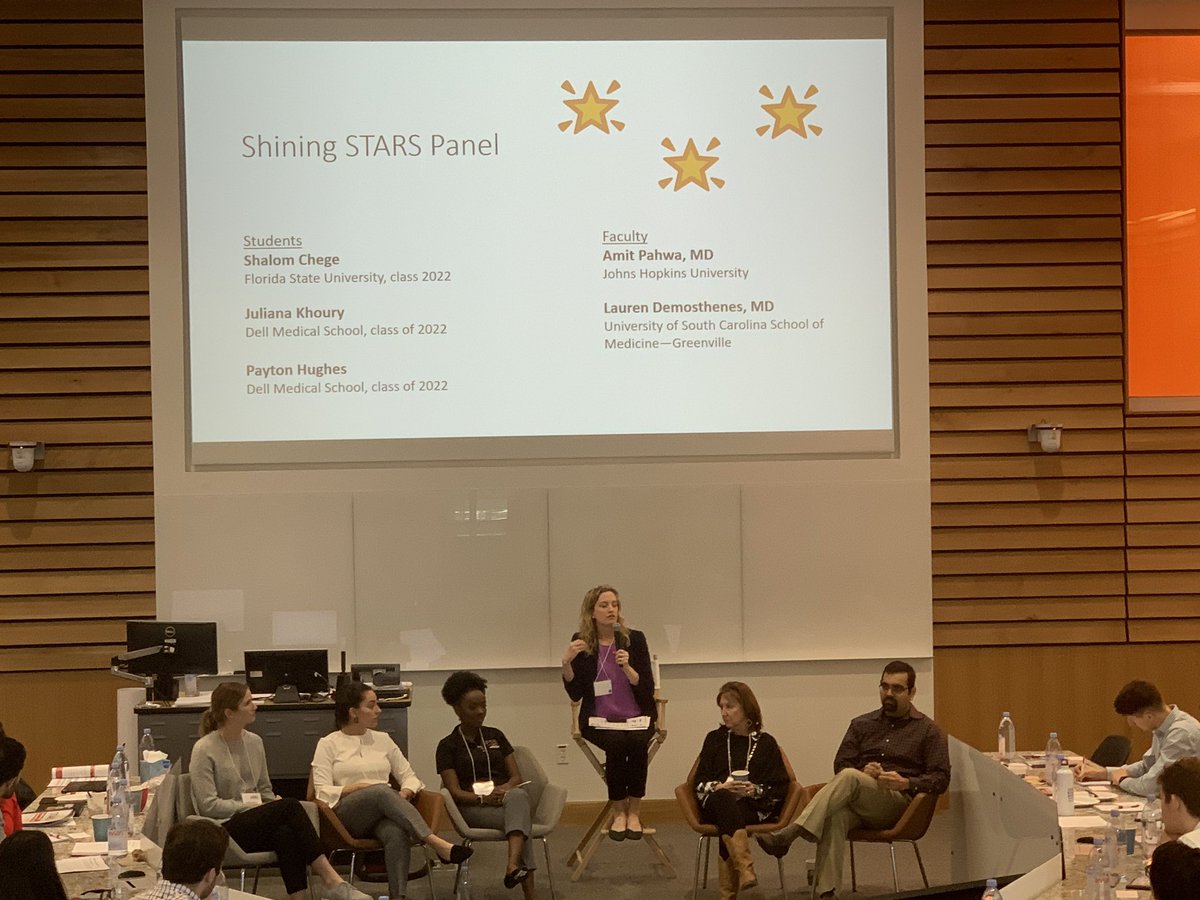
Students are helping lead the movement through STARS and other similar programs:
https://t.co/VGm46822ge
So I’m on the stats/pets spam text list now? I’m not replying but adorable-ness in dogs is abstract and relative so not sure you could do this. Plus both are cute so who cares you silly stats text bot.
Tip for debugging plots (in ggplot2) from @ClausWilke:
1. Save your plot (for example, as 'figure')
2. Call layer_plot(figure)
Now you can see the data that ggplot2 is using to generate your plot to help you debug! #rstats