we mapped tents in Rafah by applying machine learning to high resolution satellite imagery from @planet. we also show damaged buildings from analysis done by @coreymaps and @JamonVDH. 🛰️
read here 🎁: https://t.co/g91DLrDWE8
a small thread with some model specifics 🧵
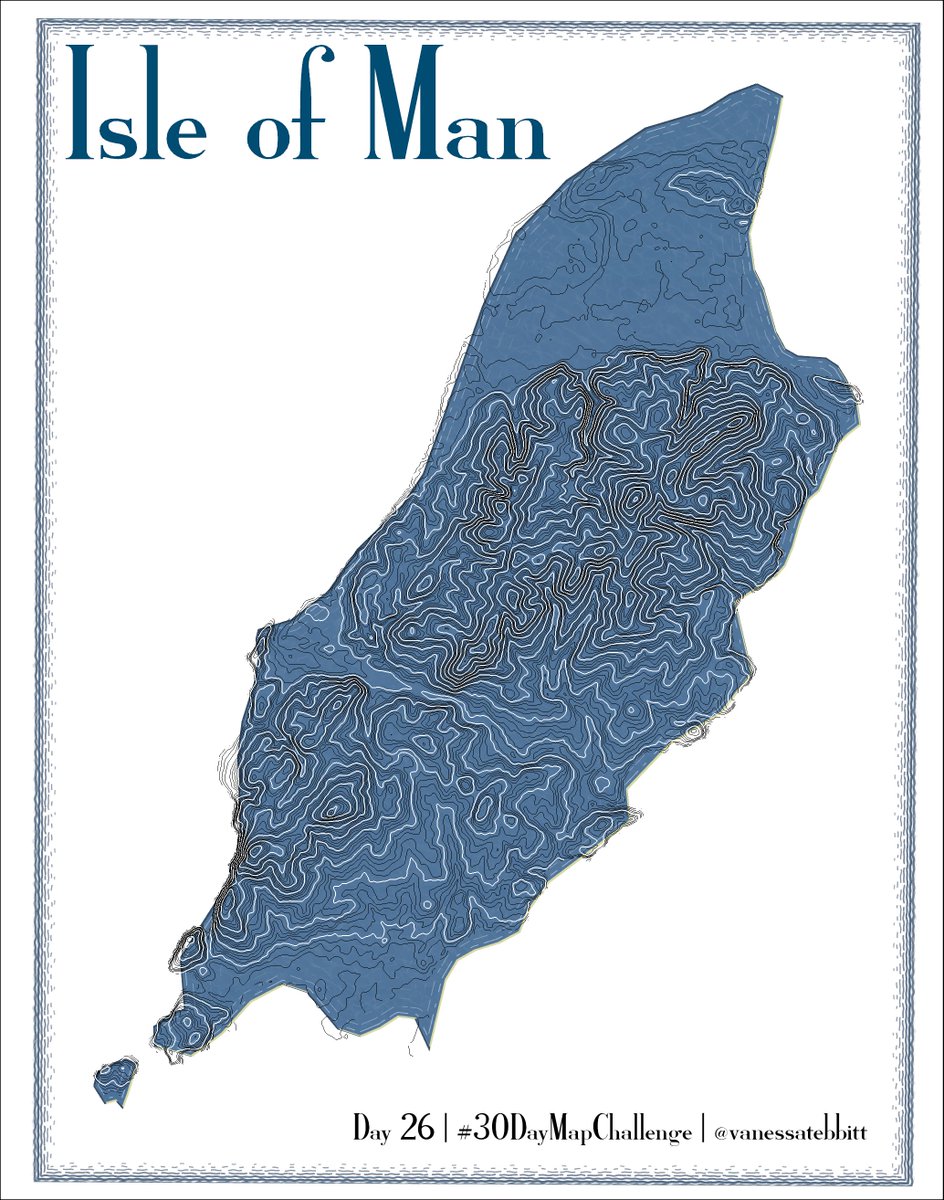
Wow #30DayMapChallenge I did it! I made a map for every day of November!! I'M SO PROUD OF MYSELF!
It has been so inspiring to see such incredible talent in the geospatial community. You are all amazing!!
Now I better go focus on my wedding coming up next week!!! 😅🤣
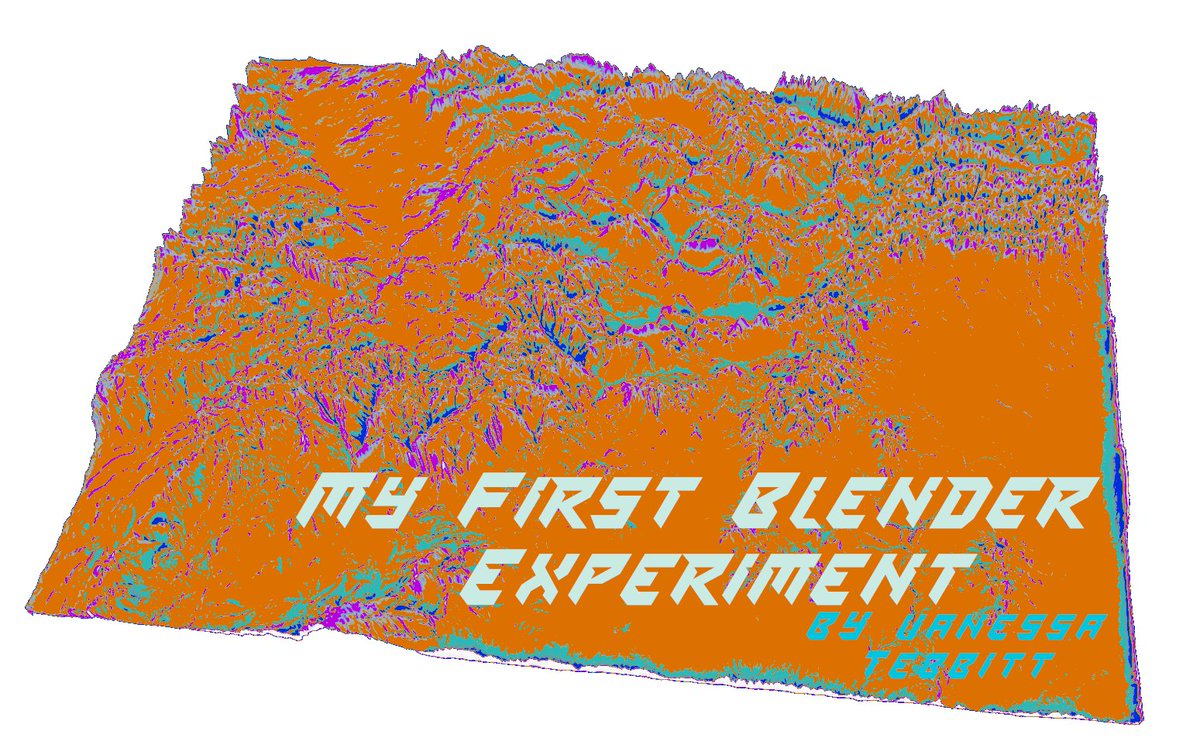
Very much out of my comfort zone with this one! I tried Blender for the first time and it is definitely not the kind of tool you can learn in an hour or two!!
Day 29 - Out of my comfort zone #30DayMapChallenge
I followed @pinakographos exceptional tutorial!! Thank you Daniel!
🔴 and ⚫️ Copenhagen for Day 25 - 2 colours
#30DayMapChallenge
Made in #QGIS
Data OSM Contributors
I will be visiting this city for the first time in about a week!! 😀
This animation shows all suspected automatic identification system (AIS) disabling events by commercial fishing vessels between 2017 and 2019.
In other words times big commercial fishing boats turned off their trackers.
More info below 👇
Day 23 - Movement #30DayMapChallenge