the Nautical Chart API for web apps & maritime robotics. Add beautiful, informative vector nautical charts to your maritime product. Built by @zydromarine
Team shipping hard on @vectorcharts every day. Some recent highlights:
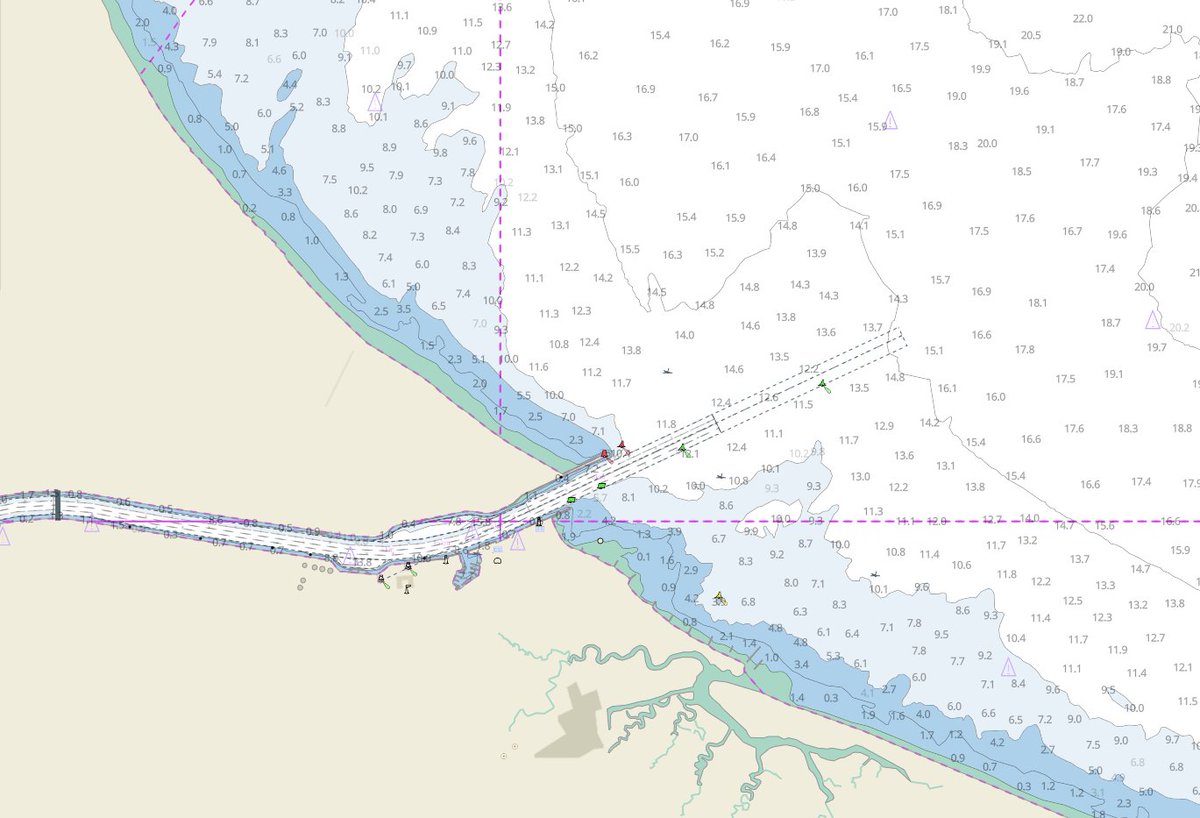
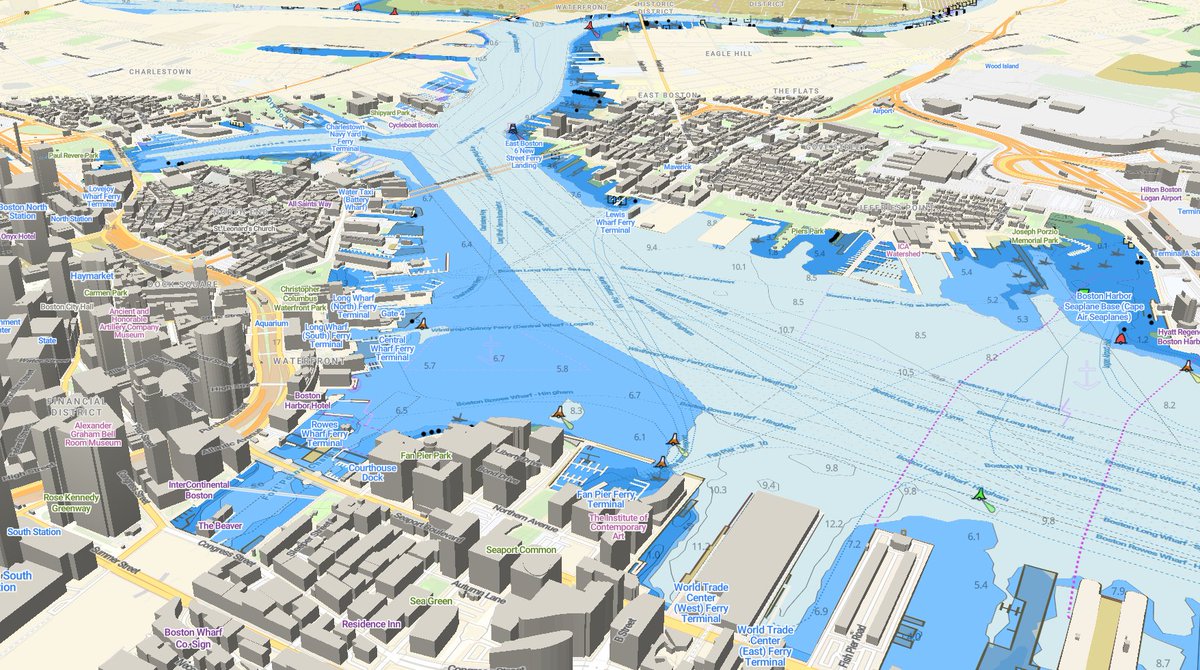
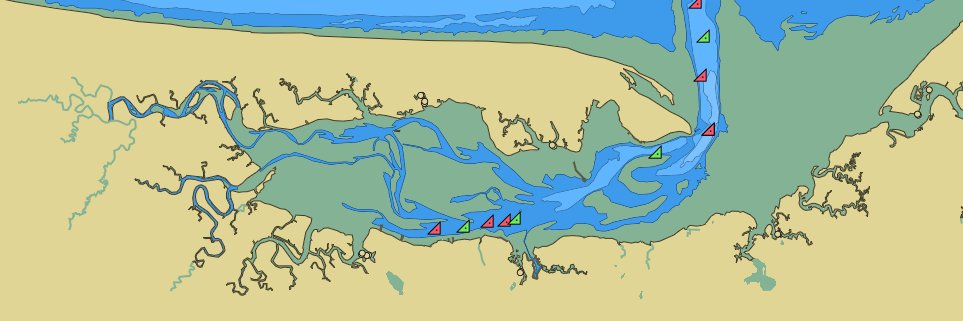
First, the flashy stuff. We've polished our map style, cleaning up iconography, and improved our mosaicing and symbology engine - The best in the world for vector tile rendering of nautical charts (1/4)
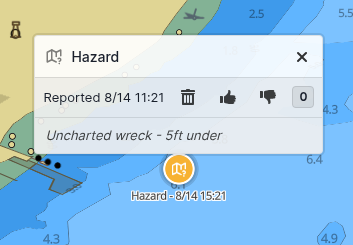
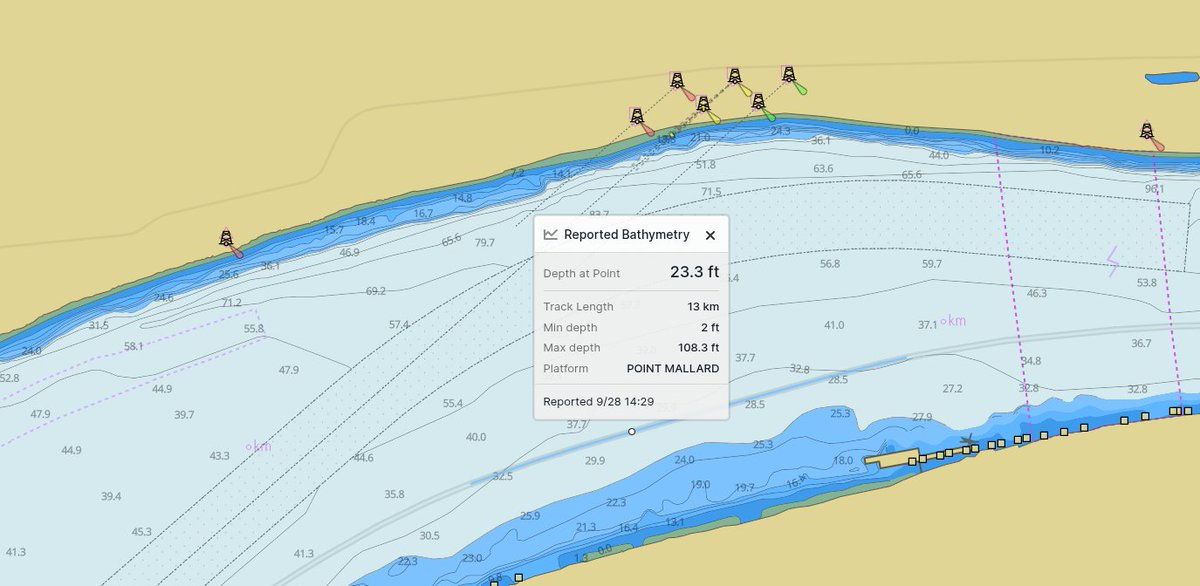
We just launched the Crowdsourced Data API in @vectorcharts.
Crowdsourced data allows platform developers & users to opt into sharing hazard and depth reports, improving chart data for everyone!
We run a managed API making it extremely simple to start contributing this data. (1/3)
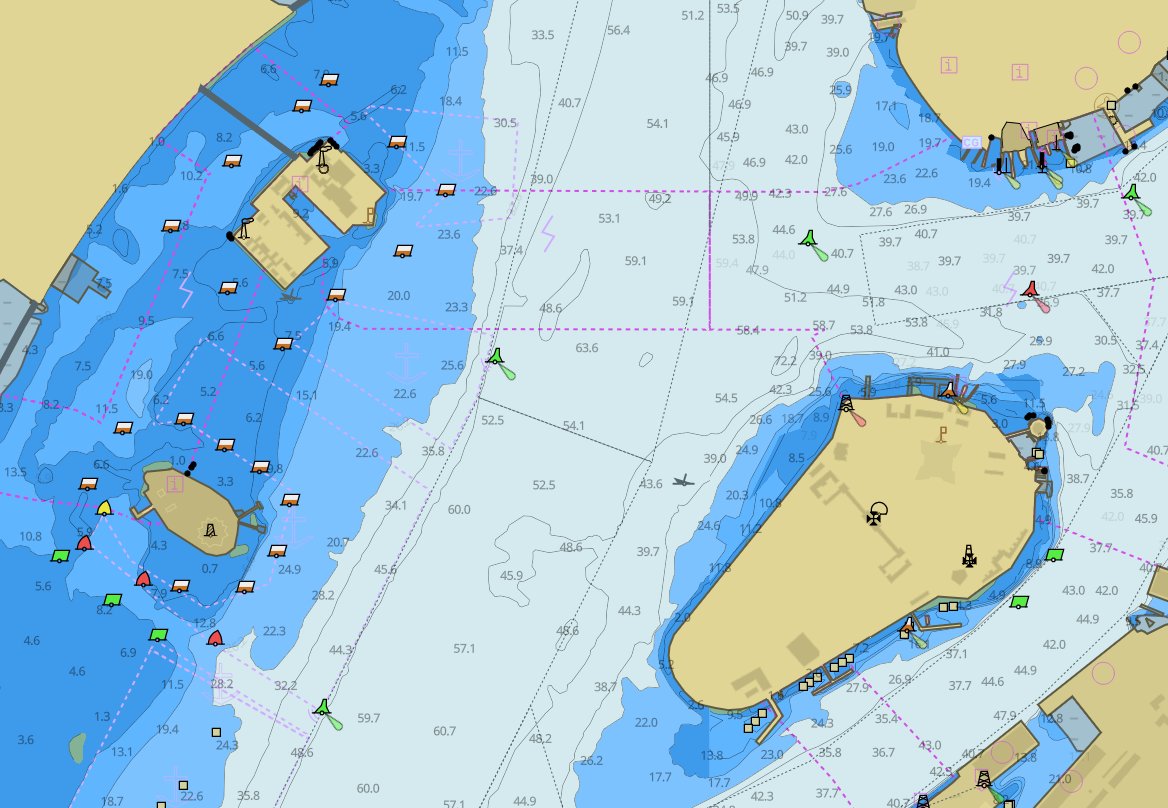
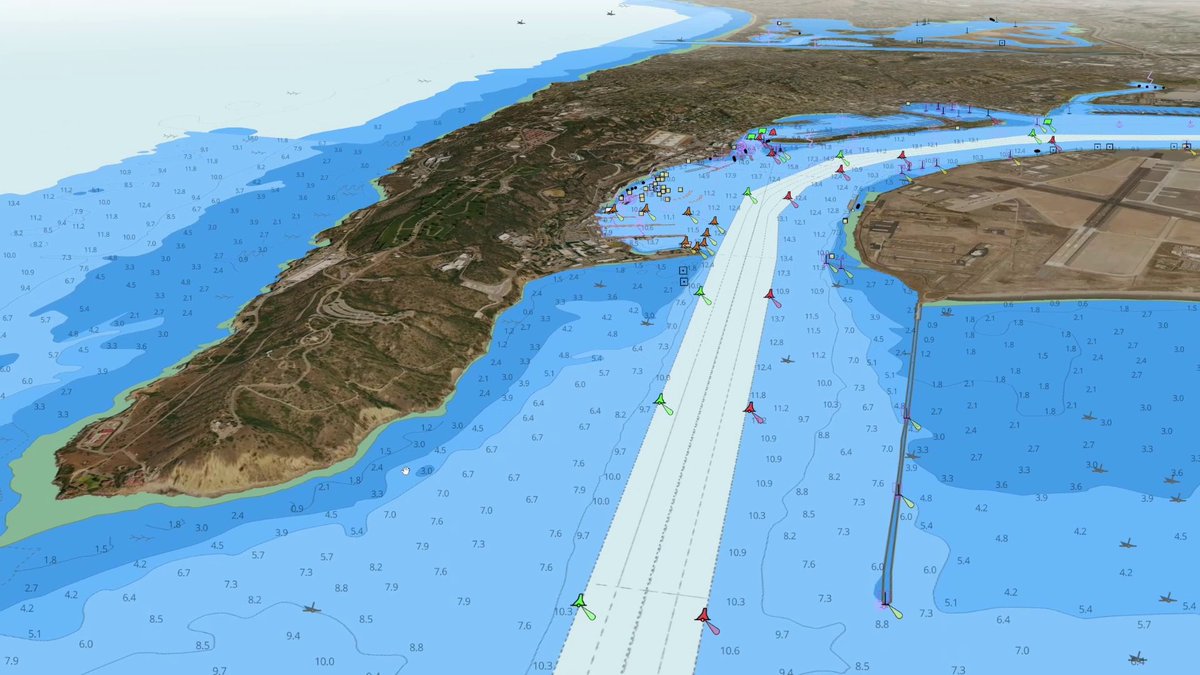
At @zydromarine we love pushing the limits of maritime geospatial data in the browser.
Pictured: our recent work visualizing charts, bathymetry, subsea perception & more... pushing the boundaries of what you can do with vector tiles
If this seems cool, we're hiring! (below)
New feature: we’re working on deriving buoy pairs, route centerlines, and other semantics, to help deliver navigation recommendations!
Pictured: buoy pairs being used to construct “hoops” in mapbox
Coming soon: We're building a style editor into the Vector Charts dashboard, allowing our users to deeply customize the chart styling for their application!
We had a busy 2025 releasing the Vector Charts API, helping leading USV & AUV companies integrate our product, and hanging out on boats.
What's next? More data, better chart-informed path planning, and integration into @zydromarine's larger ecosystem for C2 & autonomy.
New chart data available in Vector Charts: We've just added support for major US inland waterways, with charts provided by the US Army Corps of Engineers.
Along with this new data, we're rolling out improved inland symbology.
(Below: The lower Mississippi near New Orleans)
We're showing off Vector Charts at Workboat - Stop by Booth 3773 to chat maritime data & see our point-to-point routing APIs, map rendering, and more!
Who builds Vector Charts? @zydromarine!
Zydro builds foundational building blocks for trusted autonomy at sea, from maritime geospatial data to autonomy & mission planning.
More news coming soon from Zydro...
We just dropped a new API for our business customers: the Shoreline API provides a dead-simple method for obtaining a land/water shoreline mask based on ENC data.
Read more at https://t.co/DFNuQDr5we
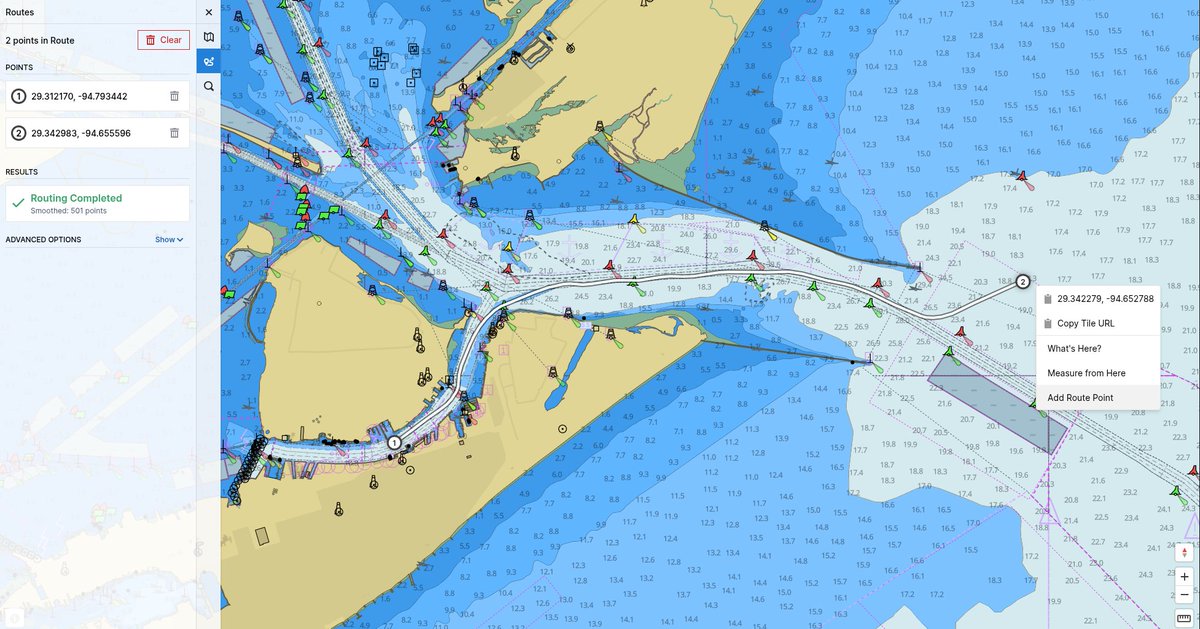
Our Point-to-Point Routing API can be used to build powerful user experiences for route planning.
In this example, our demo app shows multiple route alternatives - One for "Shortest distance" and one with wider safety margins - and allows the user to swap between them.
We're rolling out our Point-to-Point Routing API in select to our pilot customers.
Watch how the algorithm routes to avoid shallows & follows fairways.
We're constantly improving our system and checking it against the domain knowledge of expert boaters.
Vector Charts isn’t just for integration into new products. You can also drop it directly into tools you already use!
For example, here’s how you can add our charts as a background layer in #QGroundControl, for use mission planning with #ardupilot USVs:
https://t.co/1VEd3mXUqZ
Next on our list of compatible libraries: MapLibre GL JS. Born as a fork of Mapbox, MapLibre has the same capability to render Vector Tiles with WebGL!
https://t.co/fnGHZPvbA6
This week, we’re diving into how you can use our API with some common mapping libraries, GIS tools, and drone command & control software.
Follow us to learn how you can add nautical charts to Mapbox GL JS, OpenLayers, QGroundControl, QGIS and more!