Há 1 ano a cidade de Bolonha (Itália) implementou política de 30 km/h como limite de velocidade na cidade toda. Resultados até agora:
33% menos mortes
38% menos sinistros graves
12% mais ciclistas
3% menos congestionamento
23% menos poluição
11% mais passageiros nos ônibus
Com as imagens de satélite dos dias 06/05 e 14/05, é possível ver a grande diferença que o sistema de diques, bombas e comportas faz quando está funcionando.
fonte: IPH-UFRGS
COLETIVA: Criamos um ambiente em nosso site com os dados referentes às cheias na Capital. Lá é possível acompanhar áeras afetadas e medições de água já acumuladas nos últimos dias.
👇👇👇
https://t.co/GvJLemguKe
Por mais que o Guaíba baixe, as Casas de Bombas precisam estar em funcionamento para que a água escoe. O diretor do Dmae, Maurício Loss, afirma que é preciso um trabalho de engenharia que demanda certo tempo por conta da alta complexidade.
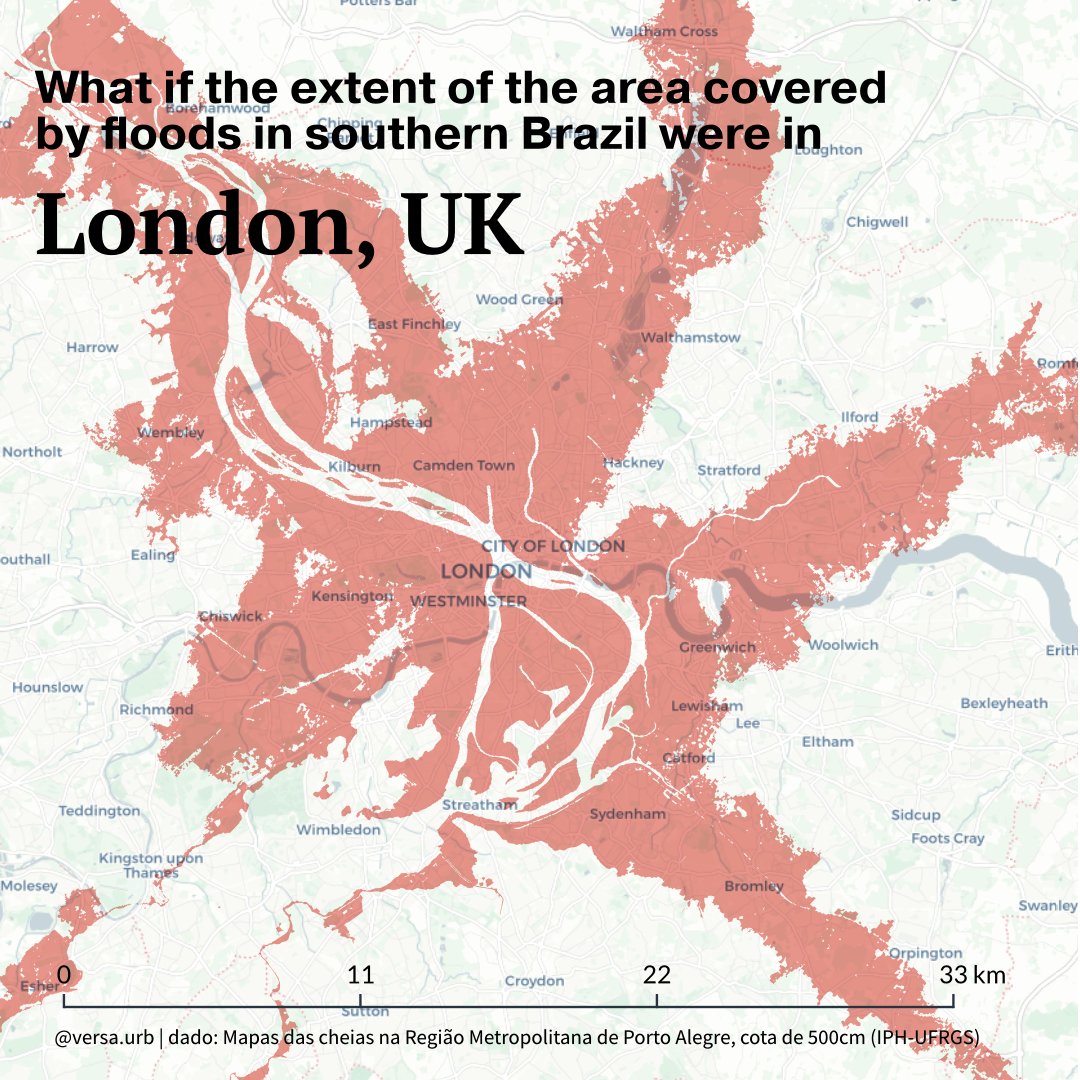
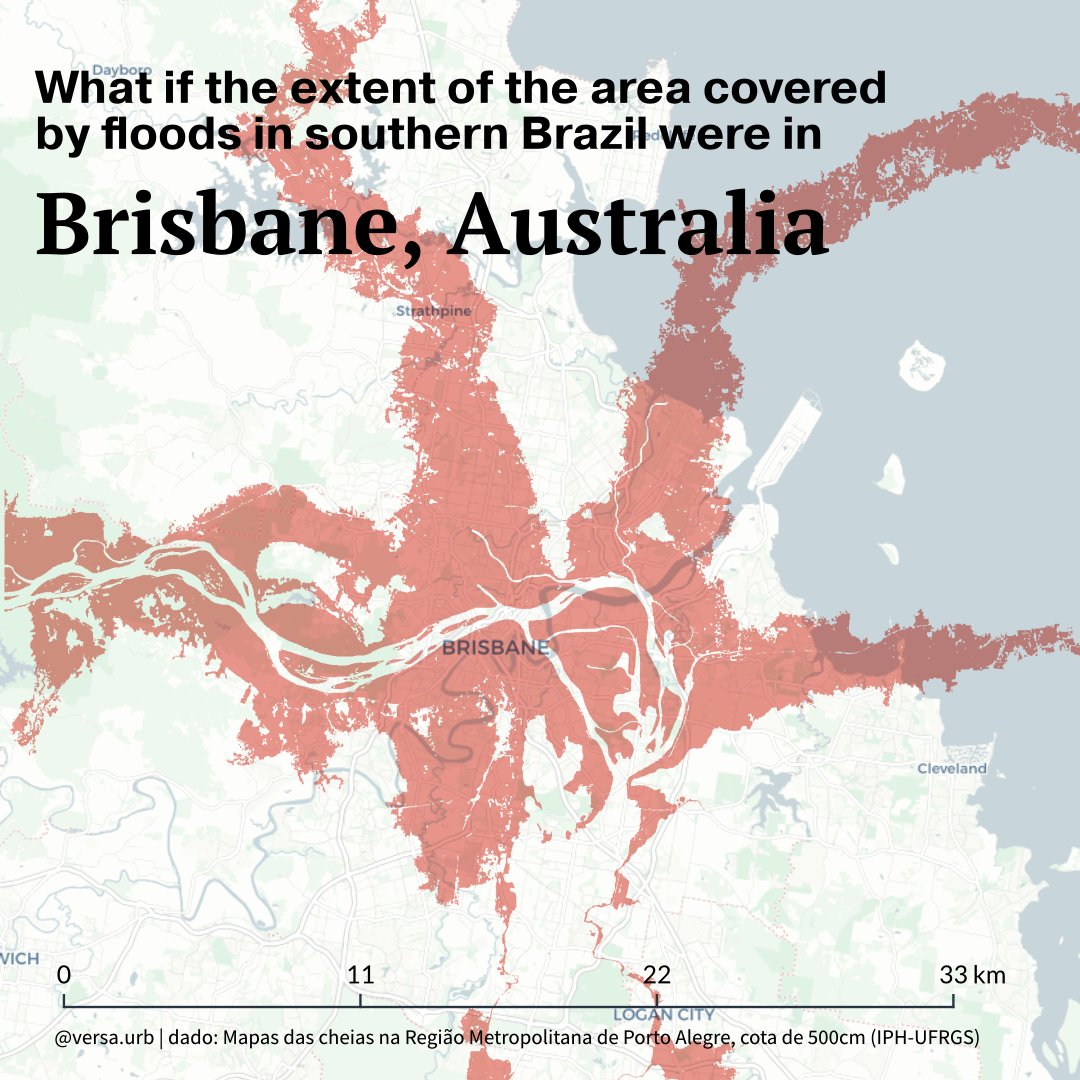
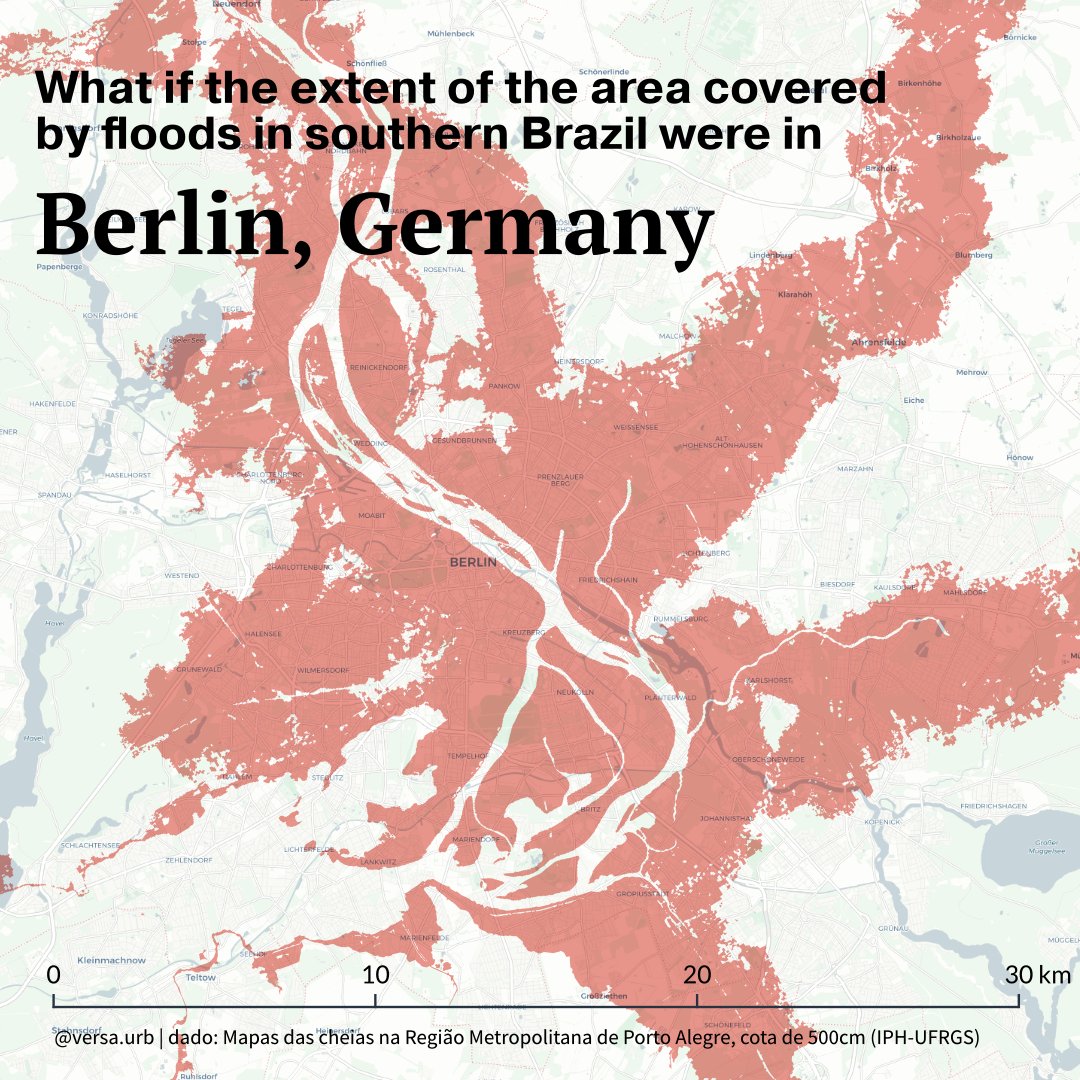
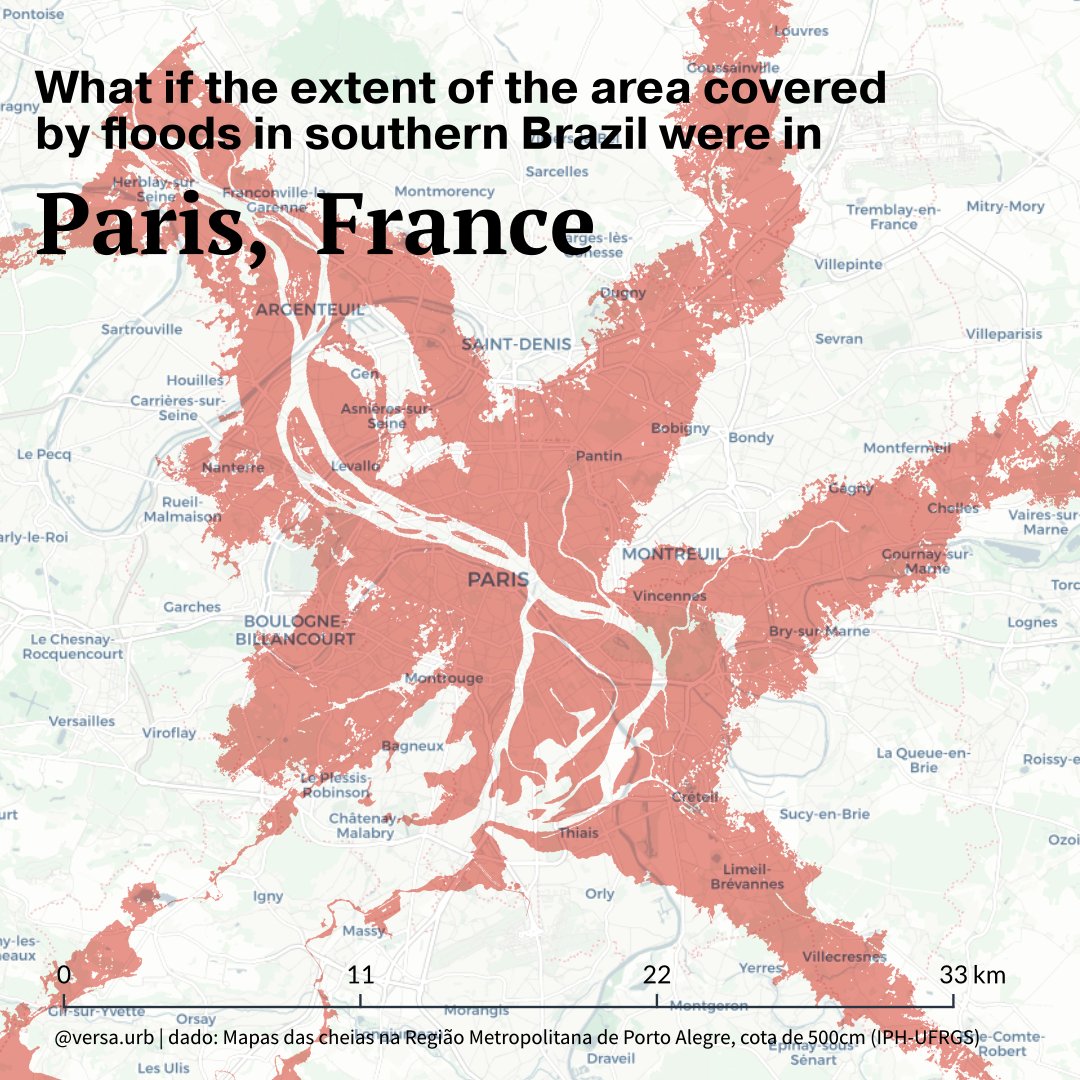
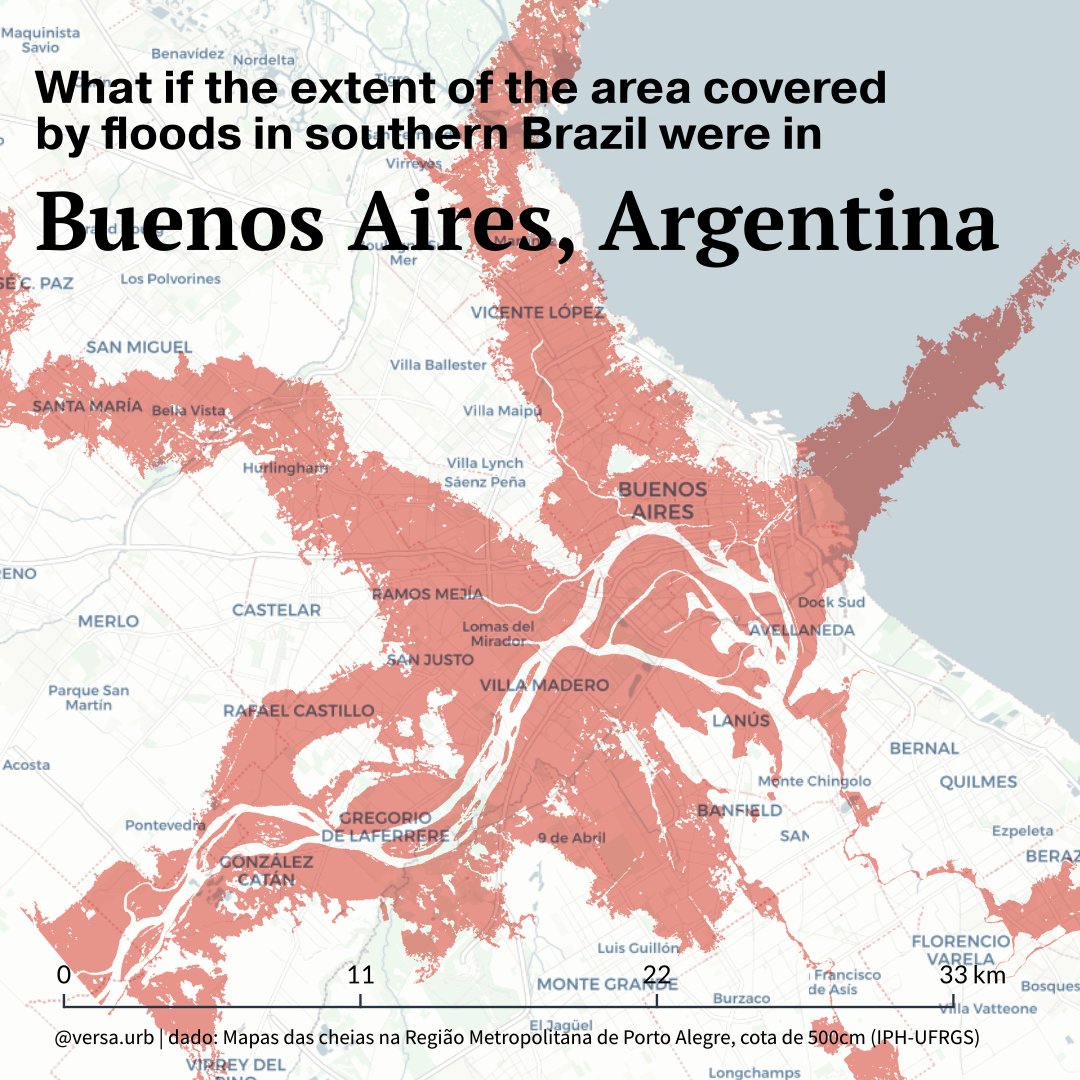
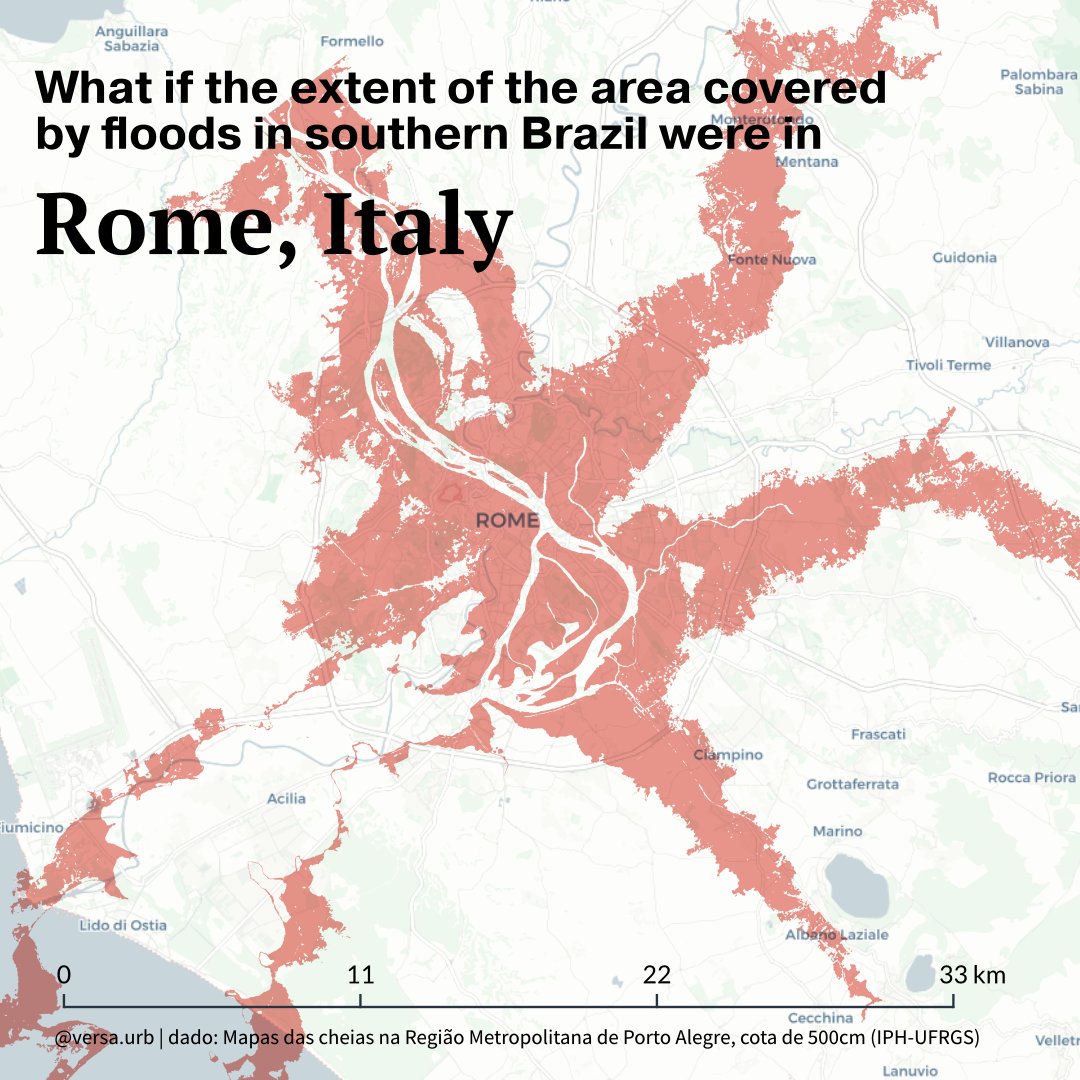
To illustrate the scale of the area affected by the floods (only within the Region of Porto Alegre, not including the entire Vale do Taquari and northern part of the state), we overlaid the flood footprint onto maps of other cities around the world. Check it out 👇🏽
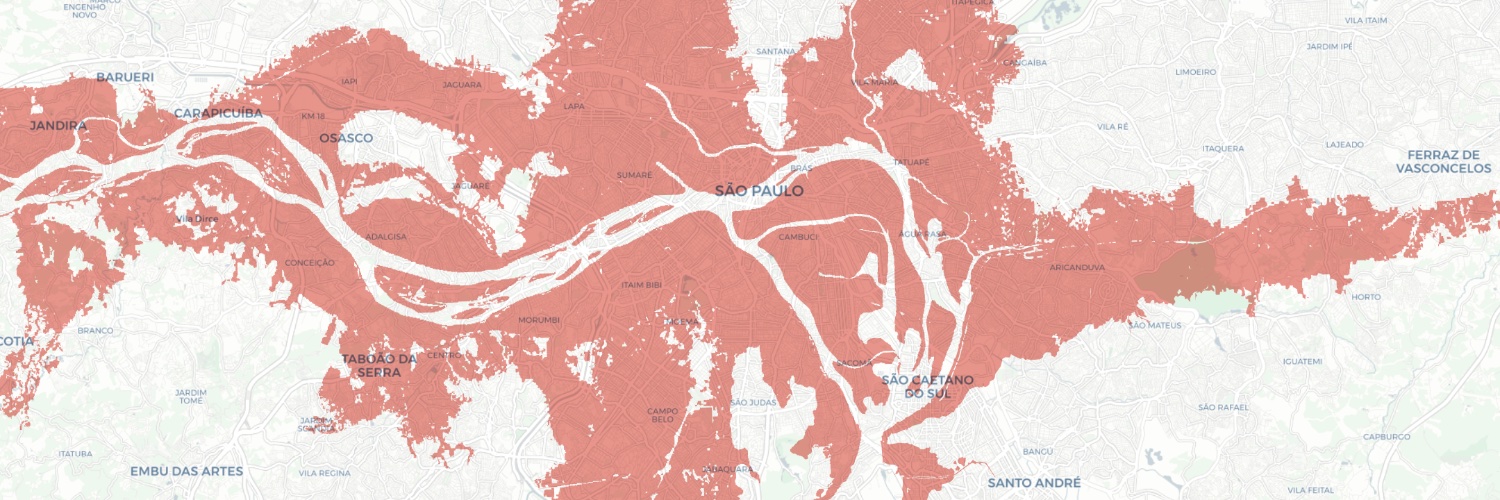
Para dar uma dimensão da área afetada pelas enchentes (apenas na Região Metropolitana de Porto Alegre, sem considerar todo Vale do Taquari e norte do estado), sobrepusemos a mancha de inundação sobre o mapa das capitais do Brasil. Vem ver 👇🏽
To illustrate the scale of the area affected by the floods (only within the Region of Porto Alegre, not including the entire Vale do Taquari and northern part of the state), we overlaid the flood footprint onto maps of other cities around the world. Check it out 👇🏽
To illustrate the scale of the area affected by the floods (only within the Region of Porto Alegre, not including the entire Vale do Taquari and northern part of the state), we overlaid the flood footprint onto maps of other cities around the world. Check it out 👇🏽