⚠️ MAKE A WISH 🤞🏻
One day, today will be a memory..
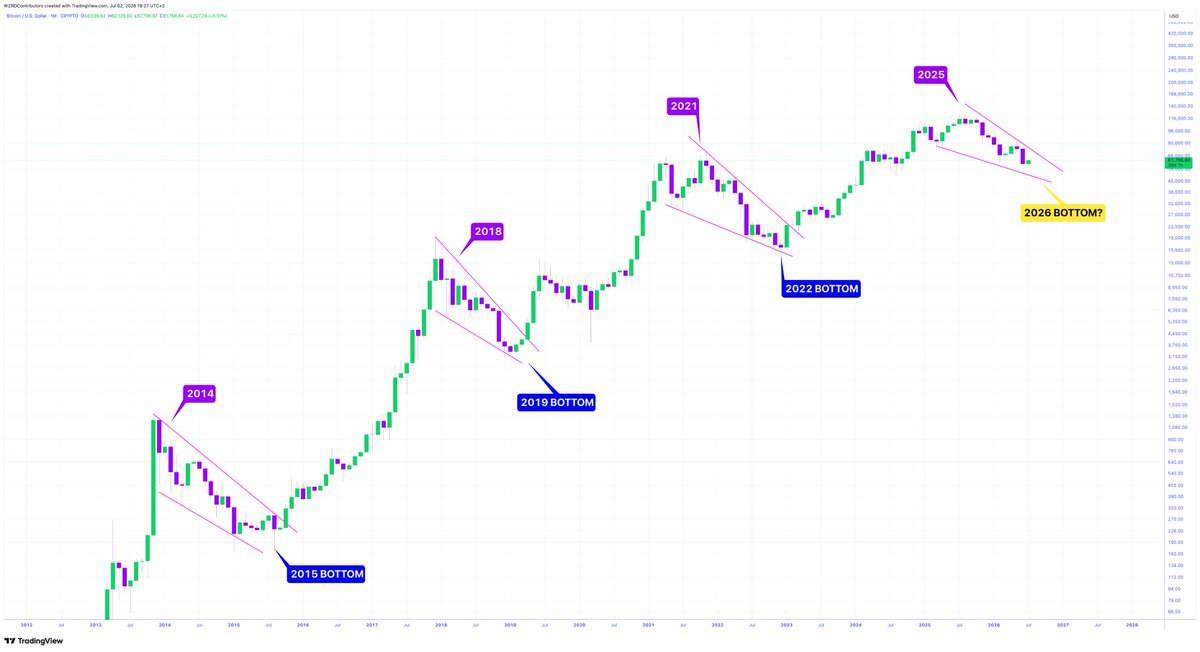
🚨 In 2017 those who bought $BTC wished they did in 2015, likewise 2021 and 2018, 2025 and 2022.. notice the pattern? 👀
People who enter in 2029 will wish they did now 💭
⚠️ GREEN JULY? 👀
July tends to be bullish..
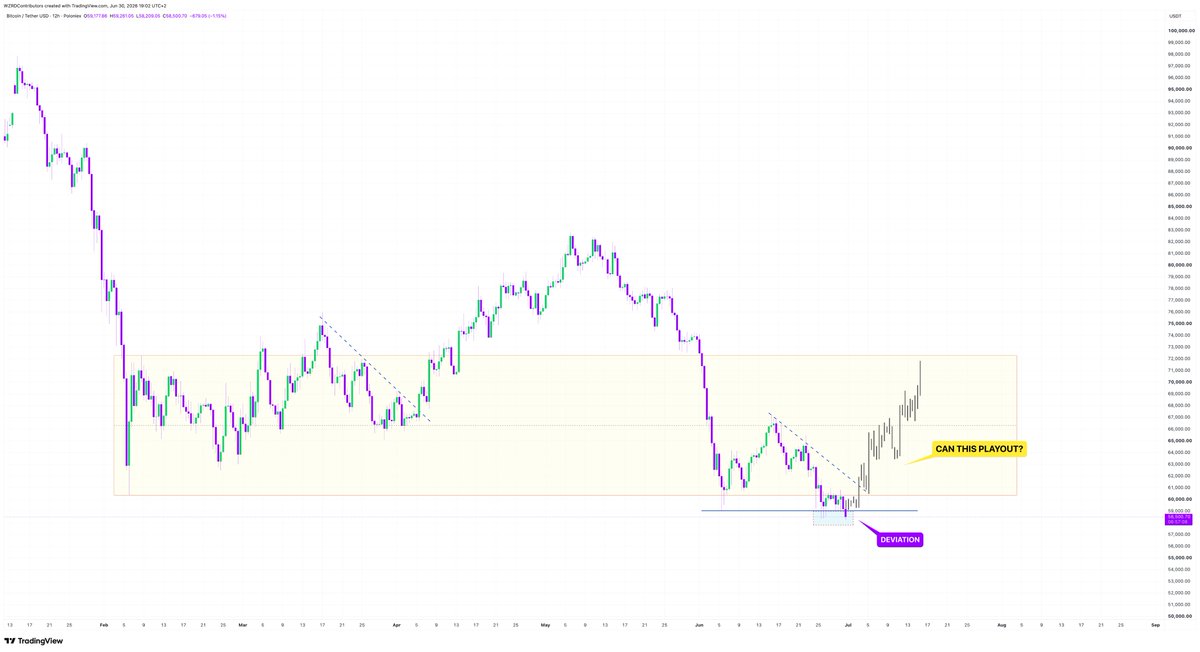
🚨 A reclaim of the multi-month range will trigger a relief rally targeting the mid-range & range highs 🚀
Can bulls spark a reversal?
🚨 NEXT 6 MONTHS 🔑
Different details, same rhythm..
⭐️ After the 2017 and 2021 tops $BTC saw 2 6 month Bearish Candles and then a Bullish Engulfing from the bottom 🤔
If Bitcoin repeats that pattern the next 6M candle should be green 💭
🔮 PUSH HIGHER? ⏳
One hell of a ride if it repeats..
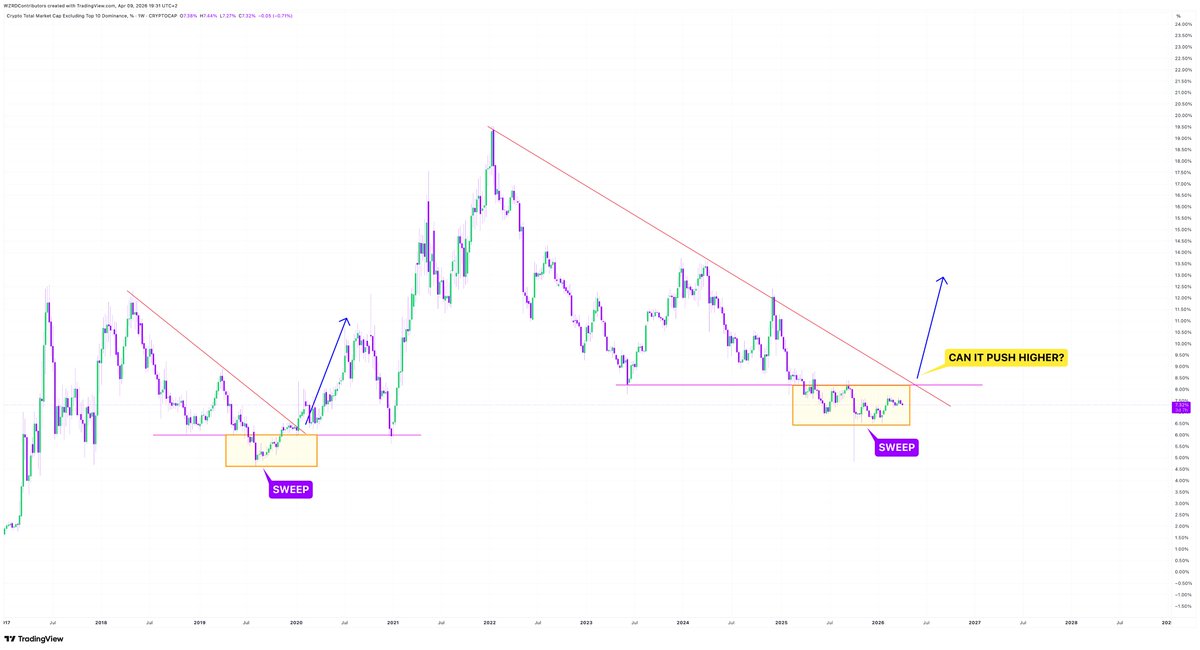
⚠️ $OTHERS.D is mirroring its 2019 setup, it’s currently sweeping the lows, can it break the downtrend and explode higher? 🤞🏻
Patience Pays!
⚠️ NO SWEEP 🧹
Is this a sign of strength?
🔮 The majority of assets and $BTC swept their April 2025 crash lows, yet $ETH didn’t… if it reverses without doing so this could be a pretty bullish sign 🤔
Patience Pays 💪🏻
⚠️ BETTING AGAINST 😳
Not sure it’s wise to bet against this..
🚨 $BTC has been trading in an Ascending Channel for 8 years, it’s nearing the Higher Low area.. if you think it’s going lower than that you’ll need a crazy Black Swan event 🤯
Hang on in there!
🚨 STILL RANGING 😳
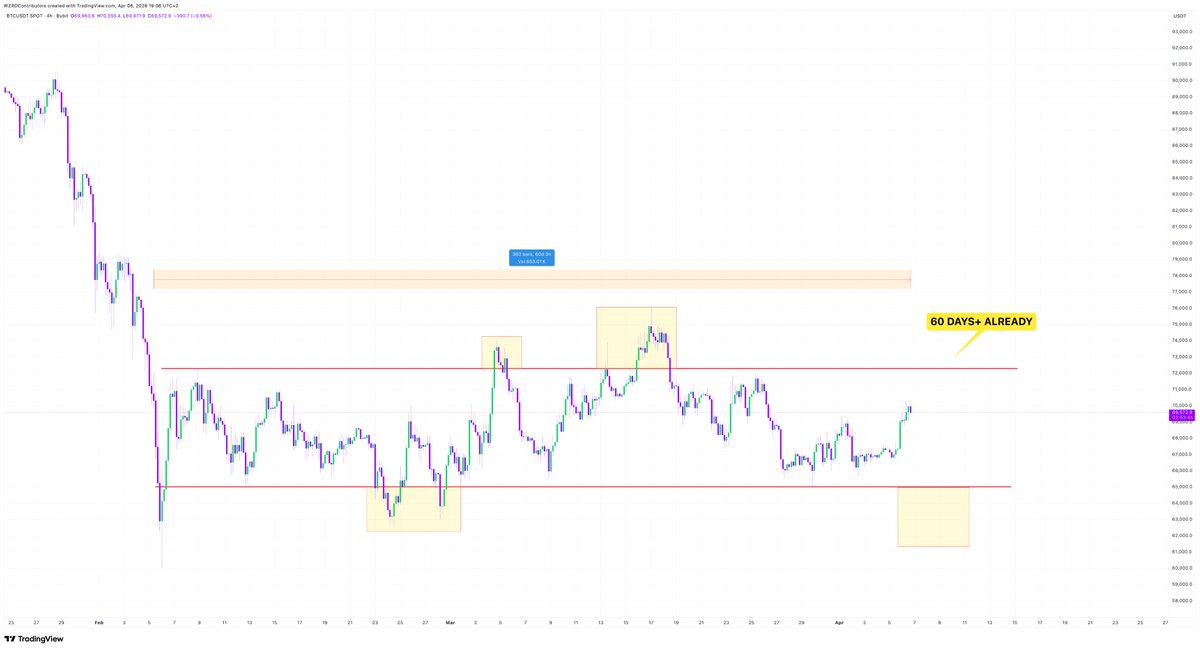
60 days have passed..
✨ After having a number of deviations $BTC remains entirely range bound, it is very possible we see another deviation 🍿
Which way will it go?
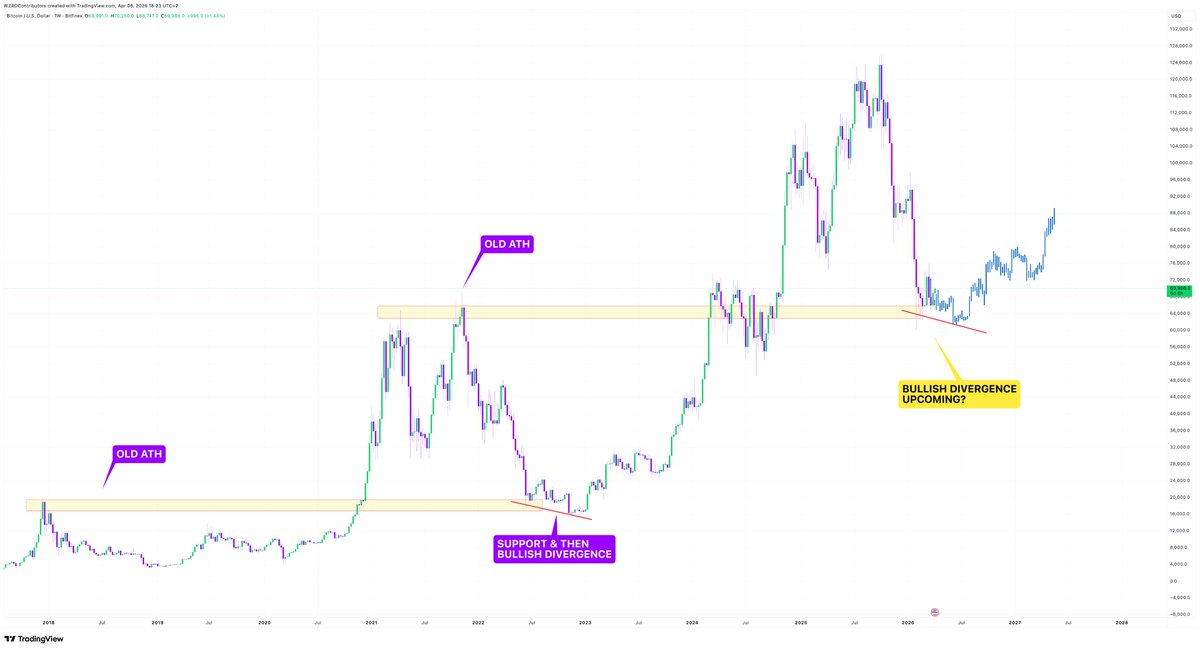
⚠️ DIVERGENCE BOTTOM 🤔
This is how the bottom could form..
🚨 If $BTC is set to bottom from this zone it may decline further to form a Bullish Divergence first 👀
Patience Pays!
⚠️ DIFFERENT THIS TIME? 👀
Hard to ignore…
🔮 Each prior $BTC bear market has bottomed after a 30% decline below the 200W EMA 📝
Will this time be different? 💭
⚠️ CAN IT RALLY? 👀
Isn’t it identical..
🔮 $ETH against $BTC seems to be mirroring 2017, the parabolic arc broke.. now the Falling Wedge is gearing up for a breakout 🚀
Patience Pays
⚠️ CAN IT REVERSE? 👀
I wonder… is this a PO3?
🚨 $ETH against $BTC has broken out of its sideways range, if it can continue to push higher that entire downside move would be a deviation 🤔
First the breakout needs to survive FOMC
⚠️ TIME CAPITULATION 👀
Weekly, RSI just broke below 30.
🔮 On the last 3 occasions we saw sideways chop for 150-250 days, even though $BTC can decline more after hitting 30 RSI this seems to happen near the bottom🧘🏻
When the window closes, it won’t revisit these prices 😅
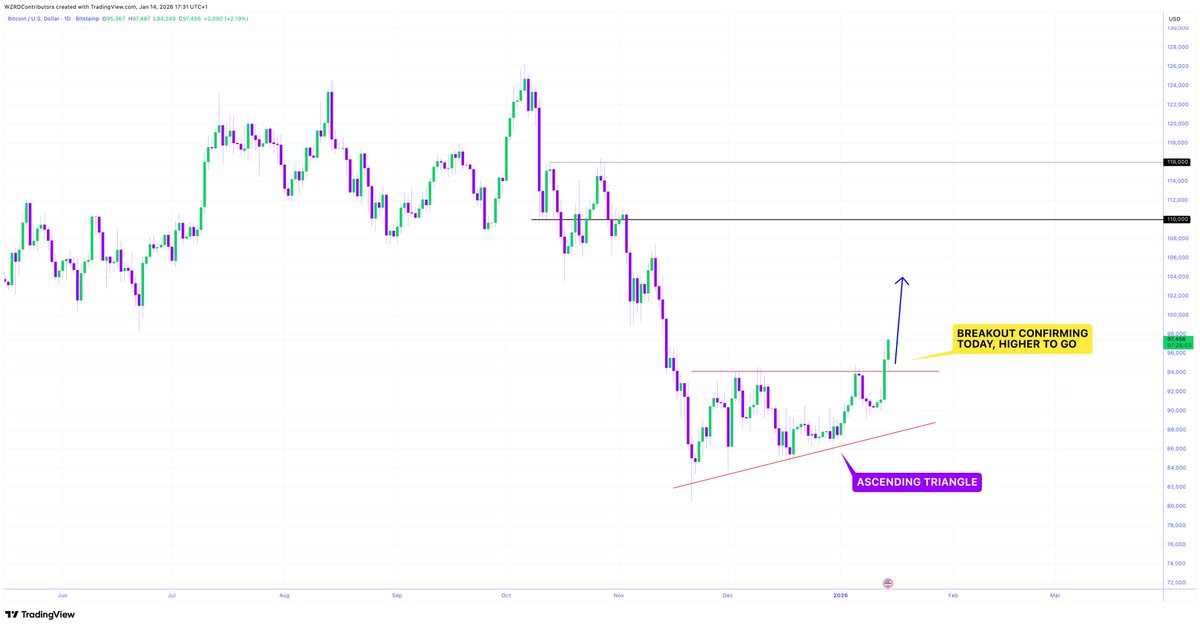
🚨 LET IT ASCEND 😇
Now that’s what you call a sweet breakout! 👀
⚠️ $BTC has exploded out of the Ascending Triangle, bar any fundamental.. the next stop is $100k 🚀
Don’t rule out a retest!
⚠️ ACCUMULATION? 🤔
Years of accumulation has always been followed by an explosive rally 👀
🚨 $OTHERS is following the same playbook, only this time the accumulation is much longer.. can it repeat? 🚀
Patience Pays!
🚨 SANTA VOLATILITY? 🧑🏻🎄
The last two years saw a volatile Christmas…
⚠️ In both 2023 & 2024, $BTC pumped on Christmas Day, but dumped much harder on Boxing Day 🤔
If we see a similar move, treat it as a reason to be cautious!
⚠️ BULLISH SWEEP 🧹
The weekly structure is still intact..
🔮 $BTC is trading sideways in a Higher Low Region, each previous time saw a final sweep that formed a spring 🤔
A potential sweep of the low is a must-buy ahead of the bounce.
⚠️ CAN IT REPEAT? 🍿
Take a closer look, what do you see?
🔮 I see years of a downtrend coming to an end. Now $ETH against $BTC is on the verge of reclaiming its 50W EMA, the last time this happened it exploded 😳
Patience Pays 👀
🚨 ONE MORE SHOULDER? 👀
When Russell 2000 rallies it signals risk is on!
⚠️ Pairing $ETH against $RUT it seems an Inverse H&S may be forming, if successful ETH will take back strength from Trad risk assets 😳
One to watch..