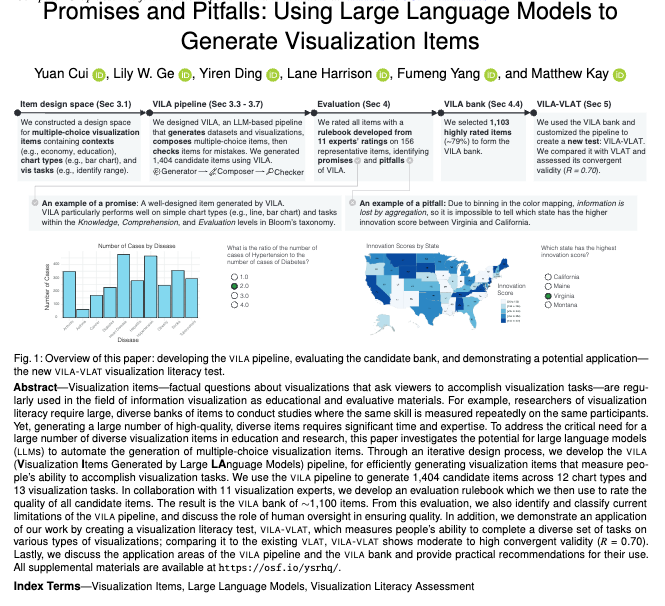
❓A limitless source of #dataviz questions?
📜 Yuan Cui, Lily Ge, @dyr429@fumeng_yang@mjskay@laneharrison evaluate the use of LLMs for generating visualization questions, e.g. for literacy assessments.
📍Catch our talk on Fri, Oct. 18 at 0900a
#IEEEVIS
https://t.co/2lzrAGTrnX
#IEEEVIS is around the corner and we are looking forward to a very productive virtual conference.
🧵Capturing our lab's contributions at #ieeevis 2024 in this updating thread👇🏼
@munaalebri@curiouslemur@laneharrison ↔️كيف يتم تصميم الرسوم البيانية في النصوص التي تكتب و تقرأ من اليمين إلى اليسار مثل اللغة العربية؟
📜قمنا بتحليل تصميم رسوم بيانية منشورة في الصحف العربية لنبرز الأنماط المتبعة فيما يتعلق بالاتجاهات و عكس الرسوم البيانية و أكثر
📍تابعوا عرضنا في ال١٧من أكتوبر ١٠:١٥
#ieeevis
A huge round of applause to our incredible #IEEEVIS student volunteers! 🎉 This event wouldn't be possible without your dedication and hard work. Your smiles in this group photo say it all. Here's to you, the backbone of our conference! 🙌
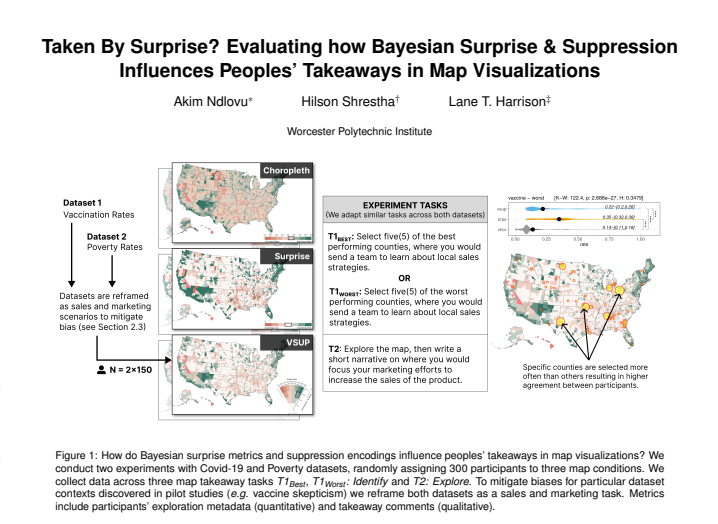
@proakim007 et al. tested two recent techniques, Surprise maps & VSUPs, in a crowdsourced setting. The results generally indicated that Surprise maps and VSUPs can indeed offset some of the issues of traditional #Choropleth maps.
More on this project at https://t.co/AAcRTKeZ7h
Curious about a visual saliency technique that can counteract misleading signals in #choropleth#maps?
Listen to @proakim007 today 10:45 R104 @ieeevis
📜Taken By Surprise? Evaluating how #BayesianSurprise & Suppression Influence Takeaways in #Maps
https://t.co/dhjpQKt9Xz
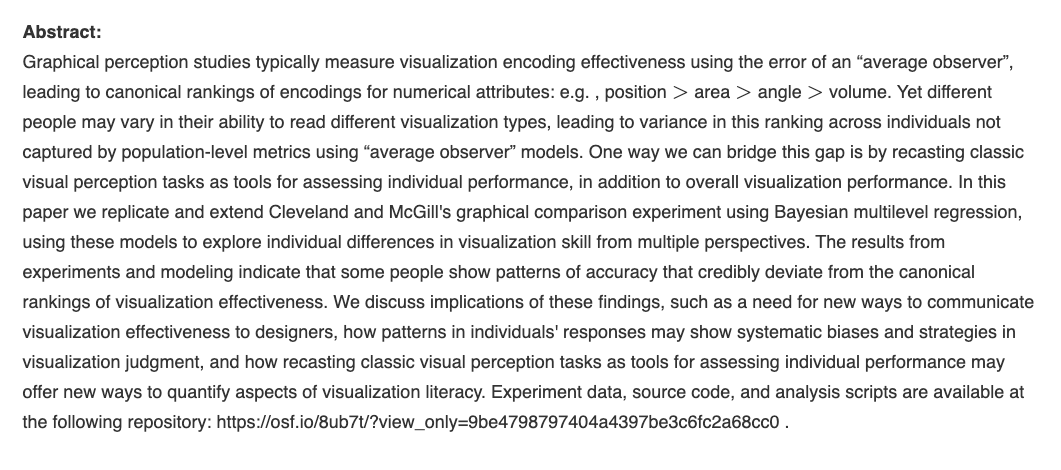
Davis et al. modeled variance and correlation in individuals’ performance on classical #graphicalperception tasks.
They suggest the field should move beyond the use of rankings and build a more complete picture of the spectrum of human performance on #datavis tasks
#IEEEVIS2023
"Performance ranking of charts applies universally"🤔 or not...
Curious?
Come discuss the topic with us in Room 105 2pm today
@ieeevis
📜The risks of ranking: Revisiting graphical perception to model individual differences in visualization performance
https://t.co/jemoqtTwee
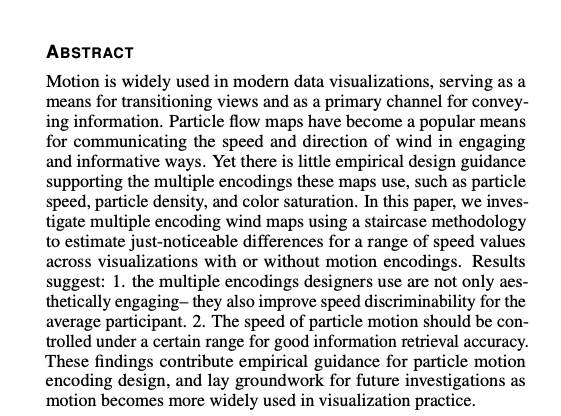
How do people retrieve information from particle #windmaps with data values encoded mainly in #motion channel?
@dyr429 tells us in
🏆Data in the Wind: Evaluating Multiple-Encoding Design for Particle Motion Visualizations
Today 10:45am-Room 104
#ieeevis
https://t.co/J0T1lvnKNS
Authors report tht
1️⃣judgments of particle motion encoding follows #systematic linear pattern across speed values
2️⃣encoding speed through factors like color saturation, density, & particle length enables the average participant to distinguish btwn encoded values more clearly
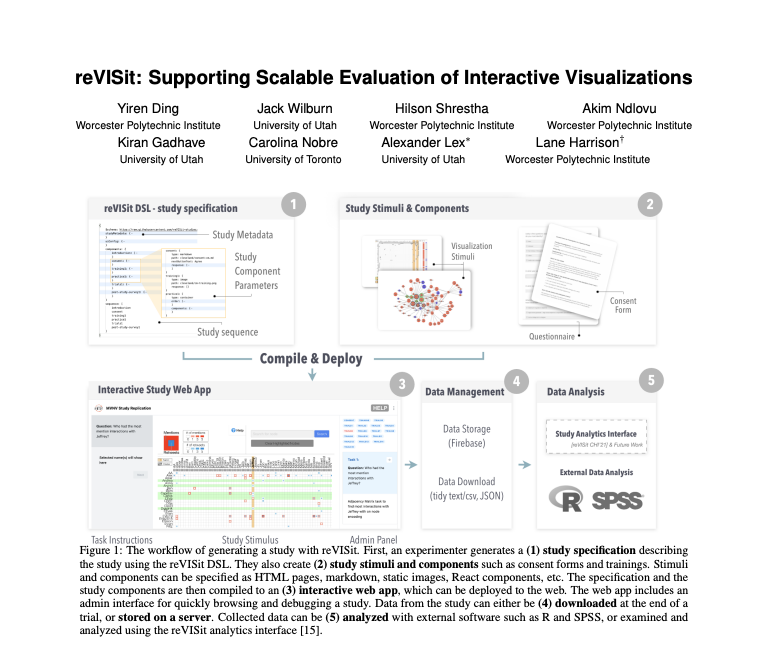
Looking for a toolbox to help you building #empirical#datavisualization studies? Join Yiren Ding's talk @ieeevis on
⚙️reVISit: Supporting Scalable Evaluation of Interactive Visualizations
📍on Wed. Oct 25, 09:00 am AEDT - Room 104
#ieeevis#empirical
🔗 https://t.co/wwsaR0SElP
reVISit is an #opensource framework for creating, deploying, & monitoring #datavis studies. It uses a domain-specific language for study set-up, and a series of software components, such as #UI elements, behavior #provenance, and an #experiment management interface. #ieeevis
Do you think it's possible/necessary to do #datavisualization#research in languages other than #English?
Check out our talk: "Beyond English: Centering Multilingualism in Data Visualization" by @curiouslemur et al. on
📍Oct 23, 09:35 am at the #vis4good workshop
@ieeevis
Our lab has several papers at @ieeevis 2023
🧵Here's an overview of our schedule and where you can find us at the conference.
@lane will be in #Melbourne, you can also connect w @HilsonShrestha@curiouslemur@proakim007@dyr429 who will be following remotely. (⏰in EADT UTC+11)
🗓️ Thu. Oct 26, 10:45 am
📍Room 104 Short Papers: Applications / Design
📜Data in the Wind: Evaluating Multiple-Encoding #Design for Particle #Motion Visualizations
By: Yiren Ding, @laneharrison
🔗https://t.co/J0T1lvnKNS