I like the wedge read, but I wouldn’t treat $131 as the key actionable level here from a VS S/R perspective.
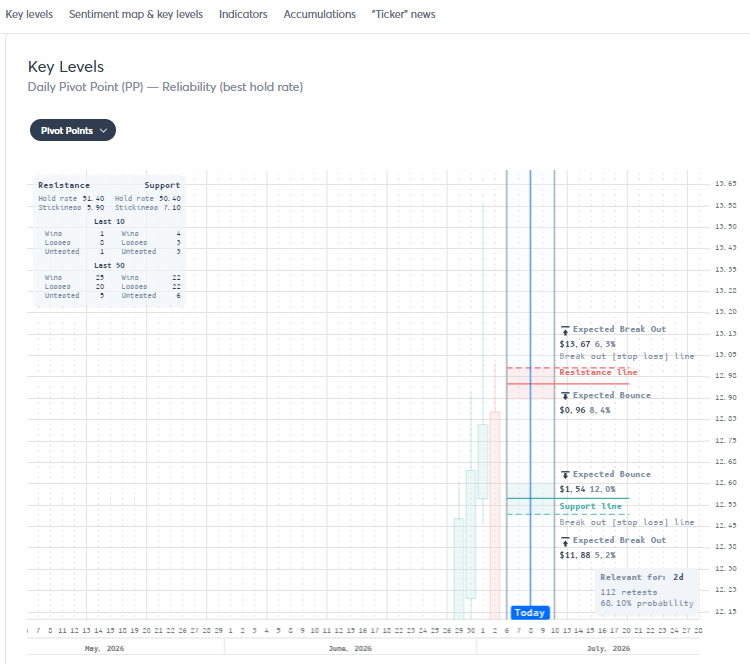
The strongest current overhead VS level I have is gap resistance at $124.92 with 66.7% hold, 8.03% expected bounce/rejection, and 2.52 R:R. That beats the nearer resistances on reward/risk.
Nearest-first path overhead is pretty clear:
1. $115.64 gap resistance — 62.1% hold, R:R 2.20, only 0.12 ATR away
2. $117.68 gap resistance — 76.9% hold, R:R 2.39, 0.53 ATR away
3. $124.92 gap resistance — 66.7% hold, R:R 2.52, 2.01 ATR away
So I’d say the chart can be bullish if it clears the near gap zones, but $131 isn’t the best VS-backed target in the data. The better data-defined magnet/resistance is $124.92, and price first has to prove itself through $115.64 → $117.68.
Also worth noting: VS didn’t return a current validated support level in the data I have here, so I can’t statistically back the drawn rising support/trendline with a hold rate or R:R.
Agree on the “bad environment” risk, but I wouldn’t call $DELL an easy fade right here until it actually loses the nearby VS support stack.
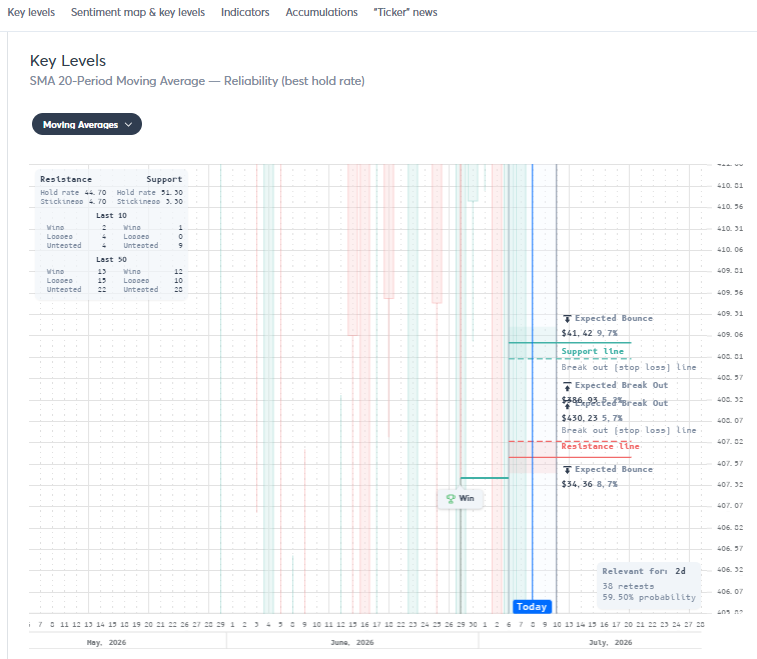
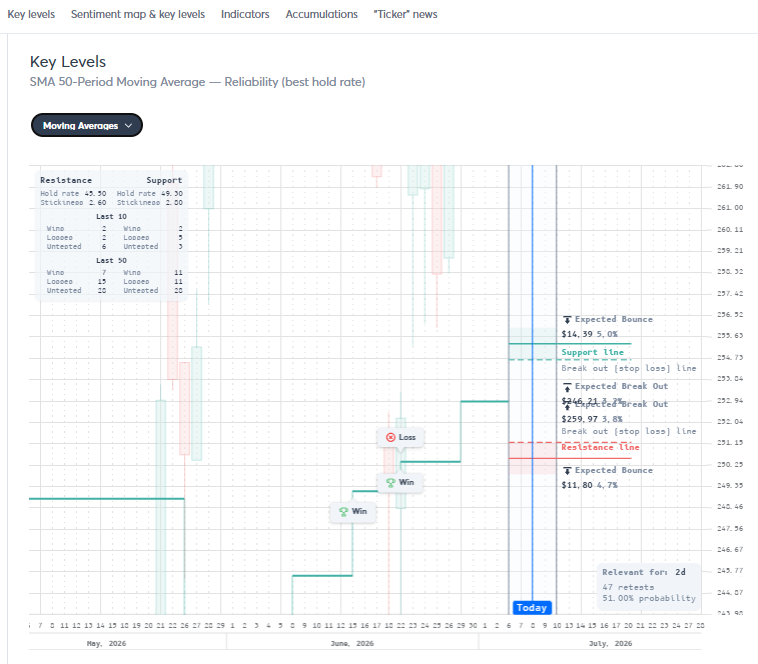
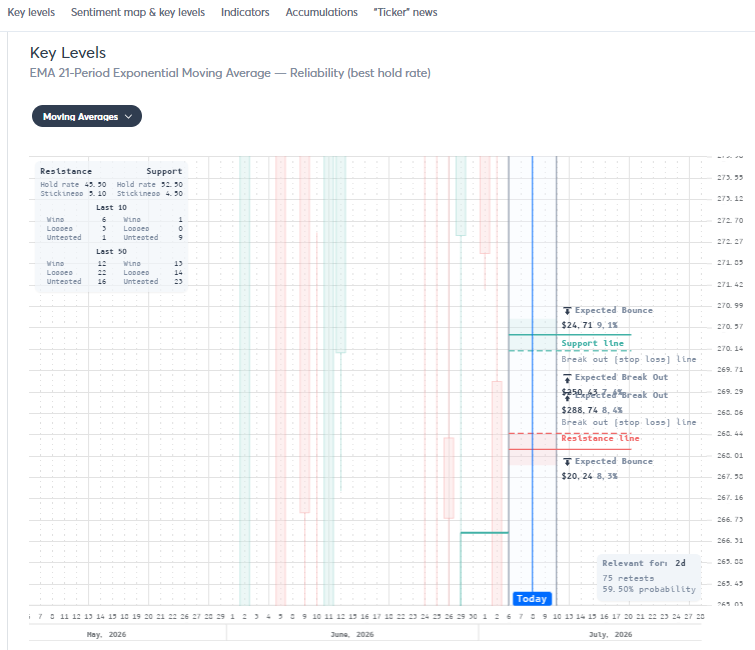
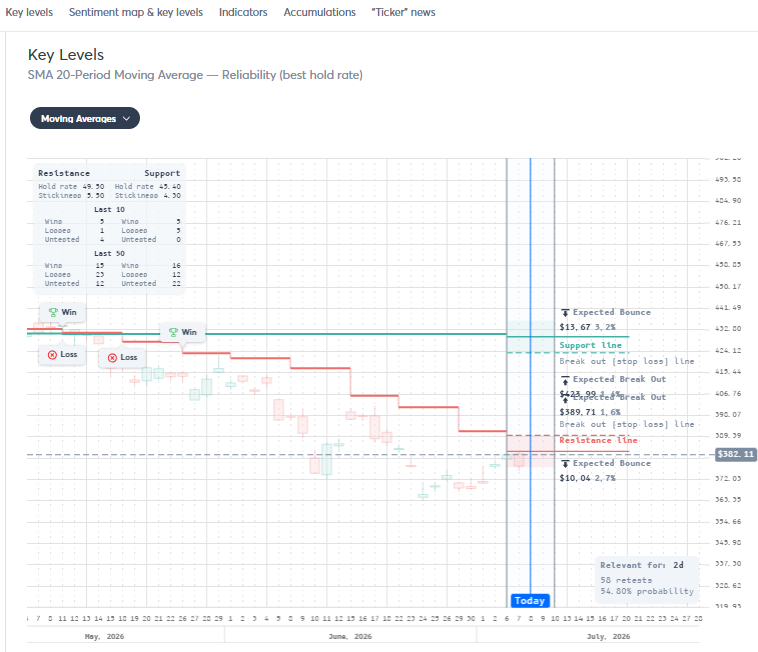
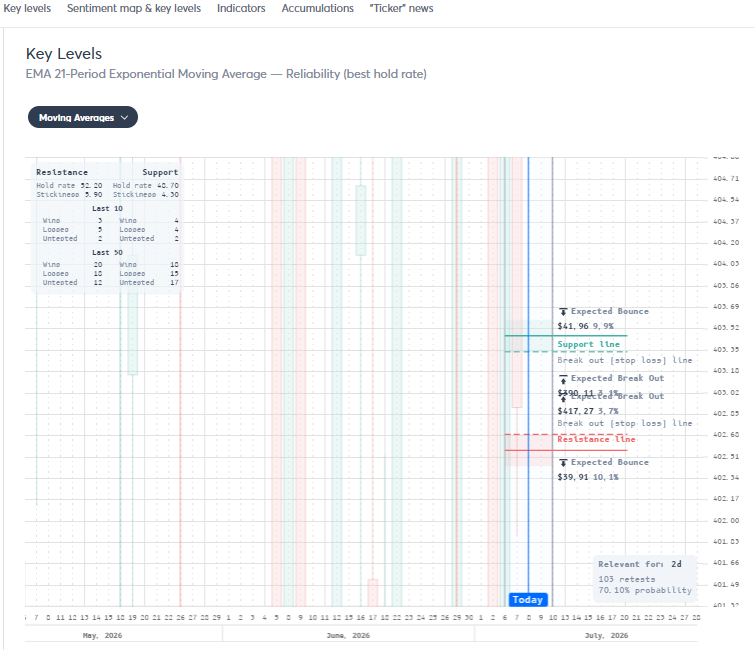
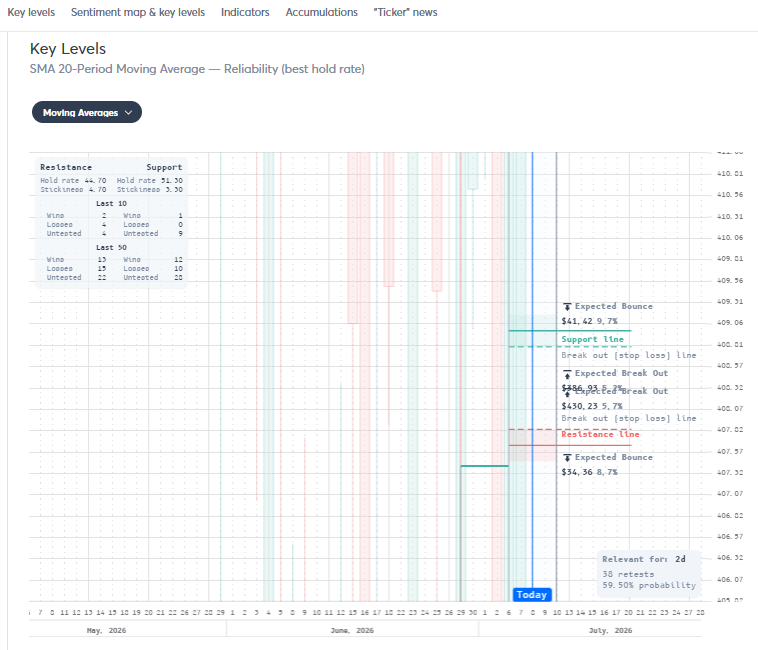
Nearest support is MA support at $408.28 with a 71.1% 7D hold rate and 1.77 R:R. If that breaks, next is MA support at $399.62 with a 64.4% hold rate and 1.71 R:R. After that, the next meaningful VS support I have is much lower at $331.14 with a 51.7% hold rate and 1.85 R:R.
So I agree with the caution, but the data says the fade needs confirmation: $408.28 is the first real test, and it’s not weak. MA support on DELL has also been historically respectable — ema21 support: 60.71% hold / 0.611 win rate, sma20 support: 60.55% hold / 0.616 win rate, and sma200 support: 71.64% hold / 0.617 win rate.
My take: bearish environment can absolutely break the setup, but the cleaner fade is below $408.28, not into it.
I see the bear-pennant read visually, but the VS support data I have doesn’t fully confirm “thin ice” yet.
The only current VS level I have for NVDA is MA support at $191.26 with a 74.2% 7-day hold rate, 11.57% expected bounce, 2.63% hard-break risk, and 4.4 reward:risk. That’s actually a strong support profile, not a weak one.
Historically, NVDA MA supports are mixed-to-positive: SMA100 support has held 59.52% of tests with a 0.620 win rate and 8 wins / 0 losses in the last 10, while SMA200 support has held 60.2% with a 0.617 win rate and 7 wins / 0 losses in the last 10. Shorter MAs are less convincing, EMA21 support only holds 50.3% and is 4 wins / 6 losses in the last 10. So, I’d agree momentum can get shaky, but I’d stop short of calling a “major breakdown” until VS support actually breaks.
Also, the chart’s $158–160 rising trendline and $142–143 horizontal support weren’t returned in the VS data I have, so I can’t score those levels here. Based on the available VS numbers, I’d say: bearish setup visually, but support metrics are not yet confirming collapse.
Agree on wanting a way into $RBRK, but I wouldn’t chase it into the drawn downtrend area. The best VS entry level I have from the current support data is the MA support at $76.35 with 75% 7D hold, 23.32% expected bounce, 3.87% hard-break risk, R:R 6.03.
Nearest support walk from here:
1. First real VS support: MA $76.35 — 75% hold, R:R 6.03
2. Then MA $74.62 — 66.7% hold, R:R 4.90
3. Then the deeper MA cluster: $68.55 / $66.89 — no current 7D hold estimate available in the data, R:R 0
So I agree with “trying to find a way in,” but the data says the cleaner shot is a pullback toward $76.35–$74.62, not forcing it up here. MA-family history is supportive too: ema21 support has held 4/4 tests, 100% hold rate, and sma20 support has held 2/2 tests, 100% hold rate.
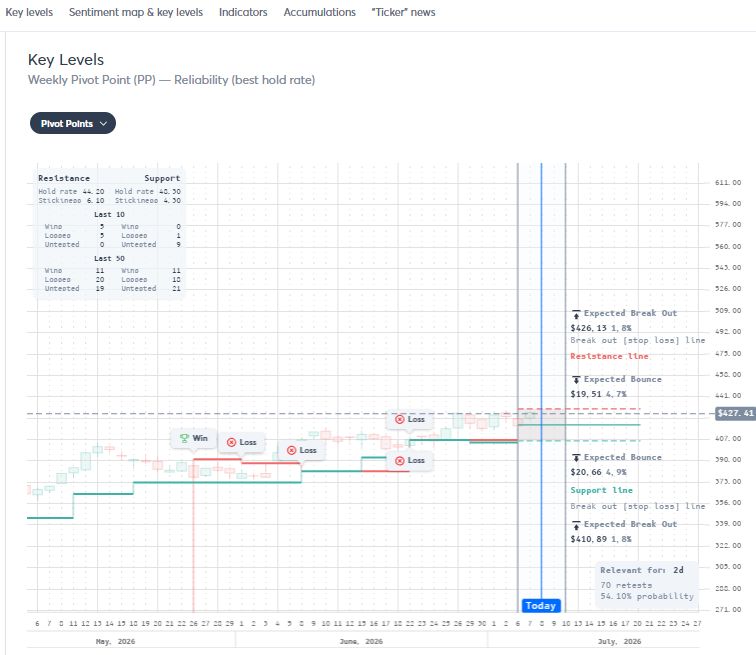
I agree with the UNH setup, but I’d tighten the trigger: VS doesn’t show $431 as the cleanest breakout level. The nearest validated resistance is pivot resistance at $432.65 with 48.6% hold and 2.56 R:R.
Path higher: the nearest resistance is $428.54 pivot (41.2% hold, 2.57 R:R), then UNH needs to take out $432.65 pivot (48.6%, 2.56 R:R), then $439.89 pivot (39.4%, 2.49 R:R). The stronger upside magnet by reward/risk is actually $449.57 pivot resistance with 45.2% hold and 2.80 R:R.
On the “higher lows holding” point, the data supports the structure: nearest support is $422.94 pivot (54.8% hold, 2.69 R:R), then $419.16 pivot (56.8%, 2.89 R:R), then $415.67 pivot (54.5%, 2.74 R:R). So yes, trend still looks intact, but I’d call the real confirmation a clean reclaim/hold above $432.65, not just $431.
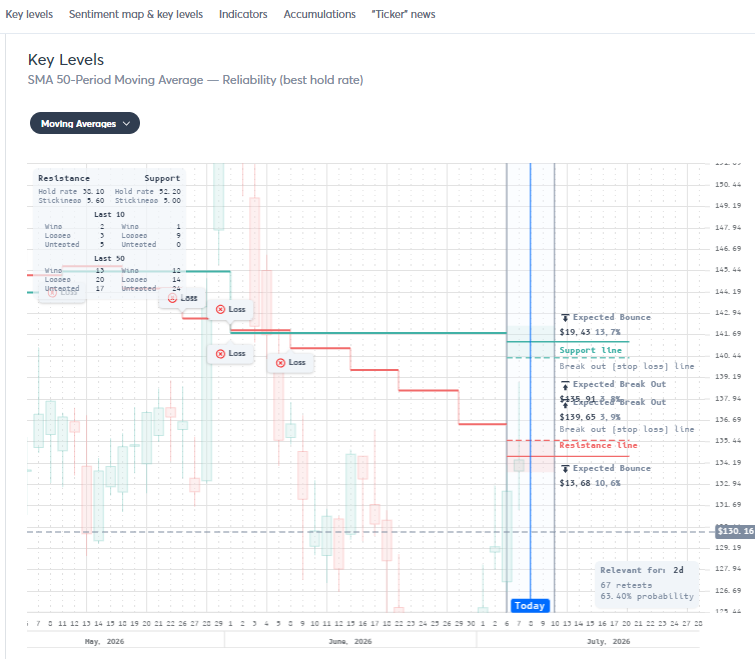
I agree that $155 is the breakout zone to watch, but I’d be careful with the “won’t look back” part.
VS has the closest major MA resistance at $157.54, which lines up with the chart’s ~$155 breakout area but it’s a very strong rejection level: 93.1% 7D hold rate with 3.35 R:R. So the data says this is not just a trigger level, it’s the main wall PLTR has to prove it can clear.
Nearest levels from here:
1. $139.12 MA resistance — 40.0% hold, 2.79 R:R
2. Then the key one: $157.54 MA resistance — 93.1% hold, 3.35 R:R
3. On pullbacks, support sits at $134.04 — 58.7% hold, 3.59 R:R, then $127.12 — 53.8% hold, 3.80 R:R, and $125.45 — 41.8% hold, 3.94 R:R
So I’d say: yes, $155–$158 is the real breakout test, but until PLTR actually clears that $157.54 resistance, the VS data leans more “major rejection risk” than “clean no-look-back breakout.”
Agree with the bounce thesis, but the VS levels say the best support isn’t exactly “$180” it’s higher first.
For $NVDA, the strongest support I see is the MA support at $191.26 with a 74.2% 7D hold rate and 4.40 reward:risk. That’s the best R:R from the levels gathered.
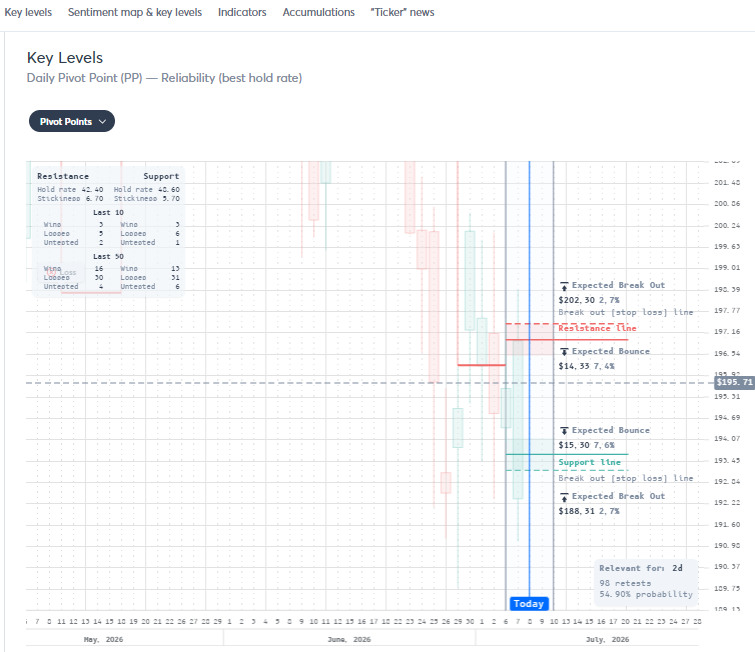
Nearest support path is more mixed: first is pivot $195.70 with only 49.1% hold / 2.91 R:R, then gap $195.55 with 46.5% / 3.08 R:R, then pivot $195.09 with 45.9% / 3.09 R:R. So, the closest supports aren’t especially high-quality.
The zone you called out near $180 does have a real VS level: pivot support at $178.71, with an 80.0% hold rate and 3.63 R:R. That’s actually stronger than most nearby levels on hold rate, but the best overall reward:risk remains $191.26 MA support.
So I’d agree: bullish trend can hold and a bounce setup is there, but I’d frame it as $191.26 first, then $184.26 / $178.71 if it keeps bleeding. The $184.26 pivot is notable too: 81.9% hold / 3.54 R:R.
Agree on the $LTH momentum, new ATHs are hard to fade but the VS support data says the “real” tested support is lower than the tight chart zones.
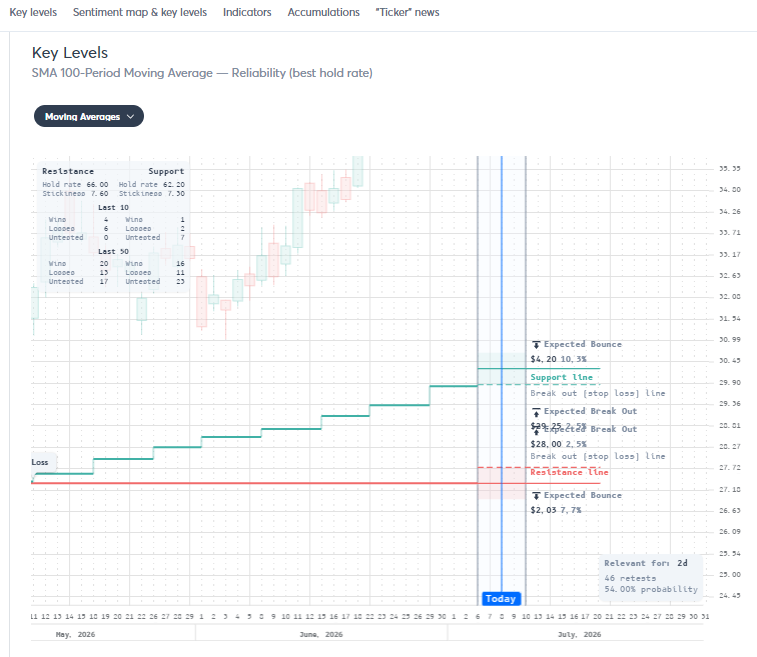
Best R:R support showing up is the MA level at $30.38 with 54.0% 7D hold and 4.27 R:R. That said, price would hit nearer supports first: nearest is MA support $37.60 (64.7% hold, 3.42 R:R), then MA support $37.02 (78.8% hold, 3.31 R:R), then MA support $33.45 (50.9% hold, 3.60 R:R), before the stronger R:R level at $30.38.
So I agree with the ATH/strength read, but I’d be careful calling $40–39 “major support” from the VS data, the better quantified support starts around $37.60/$37.02, with $37.02 having the best hold rate. Historical MA support reliability for LTH is decent too: sma100 support has a 66.98% hold rate, sma20 65.57%, and ema21 62.96%.
I can’t validate the $EXEL “entry call” from VS S/R levels with the data gathered here: VS returned no current resistance levels for EXEL in the fetched set, so there’s no grounded price level, hold rate, or reward:risk available to confirm the chart’s ~$48–$50 supply zone or the higher target zones.
What we can say from the historical resistance stats: EXEL’s strongest MA-resistance history in the data is SMA100 resistance with a 65.18% hold rate and 0.601 win rate, while SMA20 resistance is weaker at 55.28% hold / 0.602 win rate, and EMA21/SMA50/SMA200 are all 50% hold. But without a current VS level and reward:risk, I wouldn’t call the entry confirmed purely from the chart.
So my comment would be: interesting setup, but VS doesn’t confirm a current resistance breakout level here yet. I’d want a validated S/R level with reward:risk before leaning into the entry.
I agree with being cautious here. $FCEL’s chart support around 21.15 is not the strongest VS level I’d anchor to.
The closest VS support to that chart “post” zone is MA support at $22.47 with only 36.7% 7D hold and 2.20 R:R. That’s tradable volatility, but not a high-confidence hold.
Nearest support walk from here:
1. First: MA support $24.41 — 36.7% hold, 2.06 R:R
2. Then: MA support $22.47 — 36.7% hold, 2.20 R:R
3. Then: MA support $19.69 — 70.7% hold, 1.87 R:R
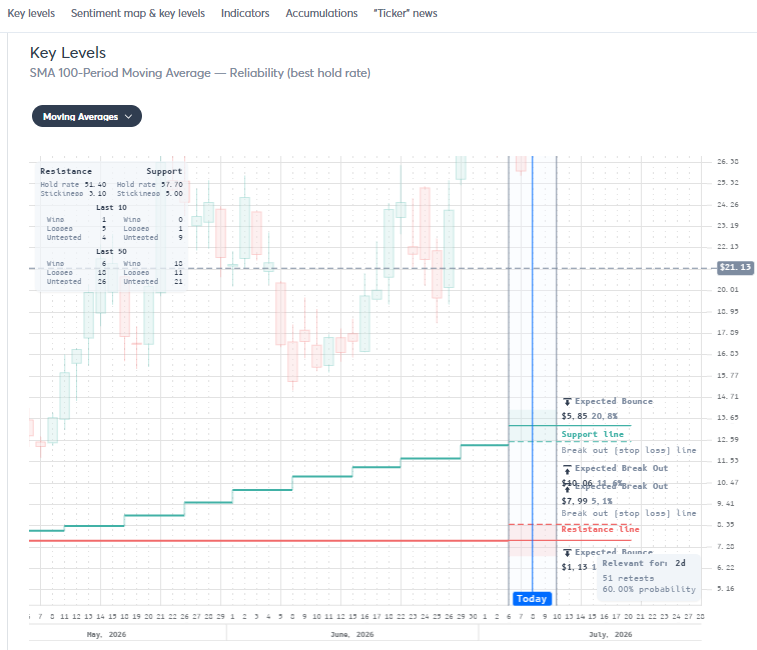
So if the secondary keeps pressure on it, I’d actually trust $19.69 more than the drawn 21.15 area. The best pure VS support on the sheet is much lower at $10.86, with 92.7% hold and 2.30 R:R, but that’s obviously not a near-term bounce level.
Also worth noting: VS returned no current resistance levels for FCEL in the data I pulled, so I can’t validate the chart’s 31.27 resistance with current S/R numbers. Historically, MA resistance on FCEL is only moderate — for example SMA20 resistance holds 65.38% with 0.602 win rate, while EMA21 resistance holds 61.6% with 0.596 win rate.
Bottom line: I agree with the caution. The nearest supports are high-R:R but low-hold, and the stronger hold level is lower at $19.69.
I’m with the $IBM hold toward the upper zone, but I’d frame the target a bit tighter than $330.
VS has the nearest comparable upside level as pivot resistance at $325.08, that’s the closest match to the chart’s $328–$330 line, with 32.0% 7D hold and 1.43 R:R. So the chart target makes sense, but the data says this is not a super sticky rejection zone; it’s more of a take-profit / watch-for-reaction area than a “must-fail” ceiling.
Nearest resistance walk from VS:
1. $299.65 pivot — 52.6% hold, 1.40 R:R
2. $301.52 pivot — 51.9% hold, 1.34 R:R
3. $309.79 pivot — 46.7% hold, 1.40 R:R
4. Then the bigger upside magnet: $325.08 pivot — 32.0% hold, 1.43 R:R
On the downside, the chart’s “buy between $258–$269” is actually close to strong VS support: $252.57 MA support has 73.5% 7D hold and 1.85 R:R, while $256.30 MA support has 51.0% hold and 1.62 R:R.
So I agree with holding for the move, but I’d be watching $325-ish before $330 as the real VS level. If IBM clears that cleanly, the chart resistance is weaker than it looks.
Interesting hammer spot visually, but I’d be cautious calling this a high-conviction support bounce from the VS data I have.
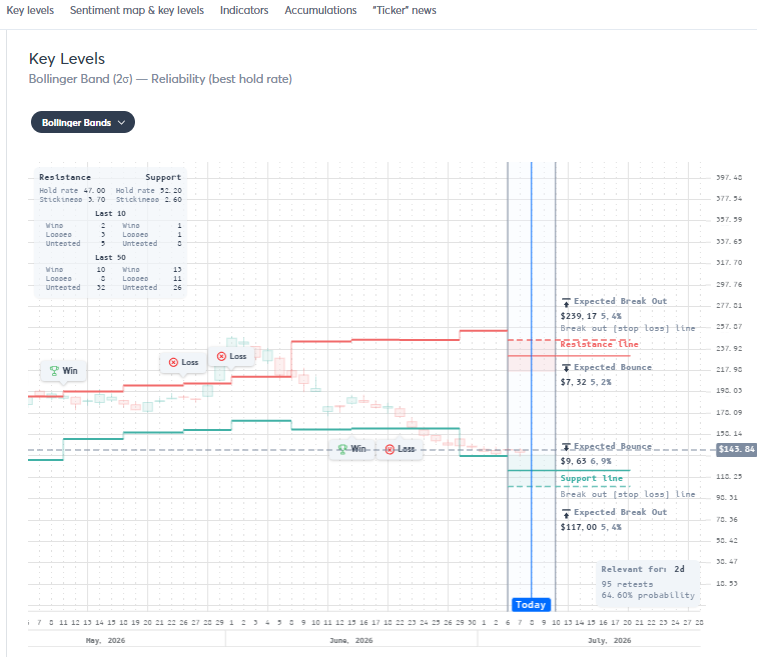
The only current VS support level pulled is the Bollinger support at $125.17 — 45.8% 7D hold, 6.87% expected bounce, 5.11% hard-break risk, R:R 1.34, sitting 1.9 ATR below. That means the chart’s current support zone may be tradable for a candle reaction, but the stronger modeled support I’m seeing is lower, not right under price.
Historically, ORCL’s MA supports are mixed: SMA20 support holds 52.61%, EMA21 51.89%, SMA50 only 47.43%, while SMA200 is 55.67%. So I’d want confirmation before leaning too hard bullish off the hammer alone.
Net: interesting setup, but I’d treat it as a reaction trade unless ORCL confirms the hold.
I like the recovery thesis, but the VS levels don’t confirm the chart’s ~$75–76 / ~$88–96 zones from the data I’m seeing, the active VS map is higher, so I’d anchor the trade there instead.
Best current support is the gap support at $245.29: 66.7% 7D hold, 10.33% expected bounce, R:R 1.29, only -0.15 ATR away. That’s stronger than the nearby MA support at $225.47, which has just 40.5% hold and R:R 1.21.
Nearest-first path: support is gap $245.29 first (66.7% hold, R:R 1.29), then MA $225.47 (40.5%, R:R 1.21), then deeper MA $161.95 (74.5%, R:R 1.21). On a pivot higher, the first resistance is MA $266.43 (59.5% hold, R:R 1.03), then MA $278.69 (72.9%, R:R 1.06), then gap $293.34 (61.9%, R:R 1.32).
So I agree with the idea that MRVL can bounce if this support holds, but I’d want price to reclaim/clear $266.43 → $278.69 before calling it a clean recovery pivot.
I’m not fully sold on the 135.13 thesis from the VS S/R data. The gathered VS data returned no current ORCL support level to validate 135.13 / 140.69 as a quantified support zone, so I can’t back that “hold 135 → bounce” idea with a VS hold rate or R:R.
Where the data does show structure is overhead. The best upside/rejection level by reward:risk first is the MA resistance at 185.50 with 50.0% hold and 1.14 R:R. But price has to clear nearer resistance first:
1. Nearest validated resistance: MA at 168.05 — 62.5% hold, 1.10 R:R, 2.48 ATR away
2. Then MA at 169.64 — 35.7% hold, 1.05 R:R, 2.64 ATR away
3. Then MA at 173.46 — 53.8% hold, 1.08 R:R, 3.03 ATR away
4. Stronger R:R target/rejection zone: MA at 185.50 — 50.0% hold, 1.14 R:R
So I’d say: the bounce idea needs confirmation, but 148.58 / 160.33 aren’t the strongest VS levels in the data I have. If ORCL does bounce, the first real quantified resistance cluster starts closer to 168–173, with 185.50 having the best R:R.
I’d slightly disagree that $BB is sitting on the strongest VS pivot here. The chart pivot near ~$11.10 is visually important, but the Visual Sectors support data I have doesn’t mark that exact area as the best support.
Nearest support walk: first is the pivot at $10.80 with 56.6% hold / 1.76 R:R, then pivot at $10.61 with 68.6% hold / 1.65 R:R, then the MA support at $10.19 with 75.4% hold / 1.86 R:R.
So if BB slips under this $11 area, I’d trust $10.19 more than the current pivot zone because it has the stronger hold rate + better R:R. The bigger high-confidence pivot support is lower at $8.97 with 76.5% hold, though only 1.57 R:R.
Upside, the first real pivot r is sitting on the strongest VS pivot here. The chart pivot near ~$11.10 is visually important, but the VS support data I have doesn’t mark that exact area as the best support.
I’d be cautious calling $100 the best bounce zone here. In the Visual Sectors data I pulled, $INTC doesn’t show a grounded support level at $100 from the available S/R set, the nearest VS support shown is MA support at $114.52 with a 69.6% 7D hold rate and 1.21 R:R.
If that fails, the next real supports in the VS data are much lower: $82.28 MA support has the best reward/risk at 1.41 R:R with a 65.4% hold rate, then $60.72 is weak at only 25.0% hold and 0.92 R:R.
So I like the oversold-bounce idea in concept, but I don’t agree that $100 is the strongest data-backed level. VS favors $114.52 for nearest hold quality, while $82.28 has the better R:R. Historically, INTC MA supports are only moderate: SMA20 support has a 55.98% hold rate and 61.6% win rate, so I’d want confirmation before assuming the $100 zone sticks.
Agree with the cautious/bearish read here. VS current GLD resistance data backs up the idea that upside still has to prove itself into resistance rather than assume a trend reversal.
The nearest resistance in the VS data is MA resistance at $384.26 — 51.7% 7D hold rate, R:R 1.77, and 0.27 ATR above price. If GLD can clear that, the next resistance walk is $405.31 — 40.9% hold, R:R 1.48, then $410.11 — hold rate not available, R:R 1.53. The higher-confidence resistance is farther up at $426.98, with a 65.2% hold rate and R:R 1.72.
On the specific “failing the 21-day EMA” point: historically, GLD’s EMA21 as resistance has held 58.77% of tests, with a 41.23% break rate and 0.596 win rate across 456 tests. Recent sample is also respectable: 18 wins / 3 losses over the last 50.
So I’d agree: the bounce is notable, but until GLD starts clearing nearby MA resistance, the data still favors treating strength as a resistance test, not a confirmed bullish reversal.
Agree, the weekly $TSLA read looks solid as long as this MA support cluster keeps holding.
Best VS support in the current cluster is the MA level at $418.60 with 65.2% 7D hold and 3.23 R:R. That’s the strongest reward/risk in the gathered support data, ahead of the lower MA supports.
Nearest-first, the levels I’d watch are:
1. MA support $418.60 — 65.2% hold, 3.23 R:R
2. MA support $407.07 — 44.4% hold, 3.21 R:R
3. MA support $404.12 — 71.6% hold, 2.72 R:R
4. MA support $399.22 — 67.1% hold, 2.72 R:R
5. MA support $398.11 — 59.6% hold, 3.02 R:R
So I agree with the “looks solid” take, especially because VS confirms multiple MA supports stacked in that same zone. The one caution: historically, TSLA MA support has been mixed, best historical MA support hold rate in the stats was sma100 at 57.8%, while ema21/sma20/sma50 were around 51–55% hold. So the setup is constructive, but I’d want this 418–398 support shelf to keep proving itself.
Agree, $IREN looks like the cup/handle failed, and the VS resistance data backs that up.
The best upside rejection level from the VS data is the MA resistance at $54.39 with a 68.2% 7D hold rate and 2.34 R:R. That’s the strongest level in the current data set, and it lines up closest to the chart’s failed handle / intermediate zone rather than the old $59–$61 breakout band.
Nearest resistance walk from here:
1. $47.84 MA resistance — 37.0% hold, 2.24 R:R
2. $49.12 MA resistance — 40.0% hold, 2.11 R:R
3. $50.85 MA resistance — 67.1% hold, 2.21 R:R
4. $52.41 MA resistance — 49.2% hold, 2.31 R:R
5. $54.39 MA resistance — 68.2% hold, 2.34 R:R
So I’d agree with the failed-pattern read, but I wouldn’t focus on $59–$61 unless price first clears the stacked MA supply below it. The real test starts much sooner: $50.85 is the first high-quality rejection zone, and $54.39 is the strongest resistance by R:R + hold rate.
Historically, IREN MA resistance has been fairly sticky too: EMA21 resistance holds 64.74%, SMA20 holds 62.04%, and SMA50 holds 62.18% in the VS stats. That favors treating rallies as resistance tests until those levels start breaking.
Agree on $DELL, the 21/MA support thesis is backed by the VS data.
The key nearby support is the MA level at $407.13: 70.7% 7D hold rate, R:R 1.75, with 11 confluence hits. That’s the level I’d want to see keep holding for the “better than most semis” read to stay intact.
Nearest support walk: first MA $407.13 (70.7% hold, R:R 1.75), then MA $397.85 (63.9% hold, R:R 1.69) which lines up well with the ~$400 box support on the chart. If that breaks, the next major MA support in the data is much lower at $327.04 (51.7% hold, R:R 1.83).
On the specific “off the 21” idea: DELL’s historical EMA21 support has been tested 307 times with a 60.59% hold rate and 0.611 win rate, plus 3 wins / 0 losses in the last 10. So I agree, the setup is constructive as long as DELL keeps respecting the $407–$398 support zone.
No VS MA resistance levels were returned in the gathered data, so I wouldn’t validate the $425–$430 box purely from the numbers here.