Here is a full breakdown of my EOD swing trading system that:
- Gave me 100%+ years since 2020
- Averages +50% CAGR since 1995 (based on 13k signal database)
- Entering breakouts EOD (2-min before the close),
- and trade 20min/day, with no discretion, and no stress
I will use an example of a trade I closed yesterday in $BMY, following the 5 steps in the pic attached.
---
Step 1:
The first thing to trade momentum breakouts is to find stocks that made a new, fresh leg higher and established a new trend.
I use the 50 EMA cloud (with 0.5 ATR 5 period above and below) as a base, when the market prints a strong first leg coming from this area, it means that it's the FIRST fresh new leg of an intermediate-term trend, and the price/time relationship in the higher time frames has been corrected, and we are EARLY.
It's very important that it's the first leg and fresh; stocks that already had consolidations and are trading in their 3rd and 4th legs of the intermediate trend have a lower chance of having a successful, multi-day breakout.
I've tested this big time, and first consolidations after first legs have a much higher success rate % over later stage consolidations:
-> The later into the trend, the more extended it is, the biggest risk of a stop-out.
---
Step 2:
Then the stock will get in what I call the "perfect uptrend state", which signals when:
• The 8, 20, and 50 EMAs are stacked up and trending, and
• my CML indicator is GREEN (signals a perfect blend of momentum + linearity in a stock, looking at candle overlap for linear moves)
At this point, the stock will be hitting my breadth scans, as we have those stocks in an ABSOLUTE state of momentum, and that's when they give the highest quality consolidations against the 8/20 EMAs to look for a breakout.
---
Step 3:
--> Look for the first valid volatility contraction pattern, riding the 8/20 EMAs layer.
This is the step before the breakout, and you want to see the volatility contract, with the top and bottom trendlines converging together.
This shows that in the case below, sellers are being absorbed, and buyers are about to break through the least amount of resistance, taking prices to major levels quickly.
That's the foundational principle of the volatility contraction/expansion cycle, and we want to find these stocks about to make the expansion leg in the direction of the established momentum (or uptrend).
What to look for in a high-quality consolidation here:
> at least 7 candles of consolidation before a breakout
> no close below the 20 EMA
> see VCP characteristics (mainly a higher low for longs)
> swing points should be defined to draw trendlines OR a horizontal line to trade from ( triangles and ascending triangle shapes only)
---
Step 4:
Now look for the breakout candle, breaking through resistance, and having a nice close.
Some things I want to see here are:
- strong body candle signaling buying into the close
- body of the candle should be bigger than yesterday's candle
- should be closing in upper range of the candle (marked by the 0.786% level most of the times)
- for longs, stop loss size should be <= 2.5x ADR or ATR% for the last 20 days (to keep risk-reward in check)
- Stop goes @ LOD, entering just before the close at 3:58pm EST
---
Step 5:
--> After the breakout, I ride the swing for 5 days, regardless of what happens.
I've tested exits for my momentum breakouts from consolidations with over 13k signals as a database (including my live trades since 2020), and nothing beats a 5-day hold.
I might have different trade management according to my timing model, which is not the scope of this post, but I can have for longs:
- FULL LONGS ( 🟢 light) = exit at the 5th day full position
- LONGS + PARTIALS (🟡 light) = take 40% partial at 1:1 RR, ride the rest until the close of the 5th day.
My timing model is based on lots of breadth-risk parameters, will get into that later on.
---
That's all I do, and I've been doing it for years now. You can check my track record since 2020, and I also manually gathered 10k+ signals in my Strategy Hub App (inside the community), which shows how my strategy performs since 1995.
I trade with hard rules, no discretion, and follow my daily process to scan -> identify -> enter trades in the last 20 min of the trading day.
You do NOT need to be hours in front of the charts, looking for trades, or making emotional, reactive decisions.
You need:
- a strategy
- a daily process
- base it EOD to be done in 20min/day
You can have a life outside trading while still compounding at 50%+ CAGR with low drawdown, which is the whole point of this.
If anything resonates with you, check out my pinned post in my profile with a 4hr+ masterclass on my setup, expanding everything I shared here.
Go and do the work.
You only have to do it once 📈
This is a very helpful tip for determining your daily bias when day trading 📝
Watch the PDH / PDL zones closely 👀
1️⃣ Break & retest PDH = Bullish ⬆️
2️⃣ Reject at the PDH = Bearish ⬇️
3️⃣ Bounce at the PDL = Bullish ⬆️
4️⃣ Break & retest PDL = Bearish ⬇️
You’ll start to notice the best move of the day doesn’t happen until you see 1 of these 4 scenarios trigger ✅
$SPY $QQQ $IWM 👇
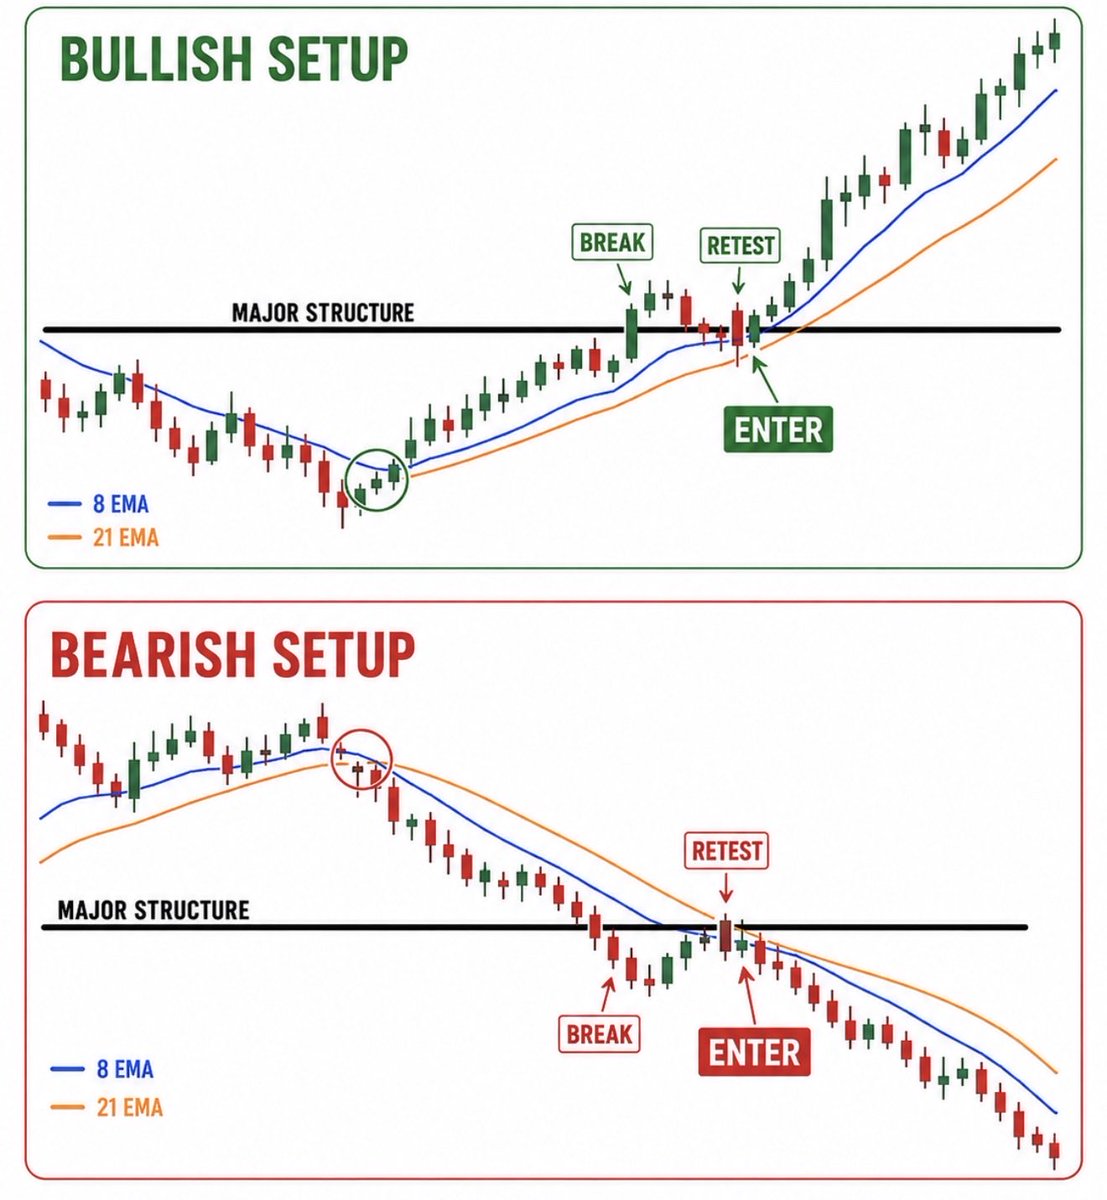
THE SETUP BEHIND MY $100K MONTHS
SAVE THIS.
This is one of the BEST setups I trade over and over:
8 EMA = first sign of a strong trend
21 EMA = trend defense
Then:
8/21 cross
→ push into major structure
→ break
→ first retest
→ ENTER
Aggressive entry = first clean 8/21 retest before structure breaks.
Safer entry = wait for structure to break, then take the retest.
Works bullish or bearish.
Works on the 5 minute for day trades
Daily for swings.
Same setup. Both directions.
If you’ve traded for years but still lack consistency, start here:
1. From Chaotic to Consistent: My 5-Step Framework
🔗 https://t.co/274Y5e1mWF
2. How to Become an Independent Trader: My Full Process
🔗 https://t.co/kqn27f7Qwz
3. How I Keep My Drawdowns Small (And Why Most Traders Fail Here)
🔗 https://t.co/O19YZjipcI
4. Why Losing Small Is My Edge in Trading | The Real Secret of Risk Management
🔗 https://t.co/a66jG6O4oR
5. The Perfect Trading Process: Step-by-Step Guide to Become More Effective
🔗 https://t.co/nSpwdO9rkX
You probably don’t need more trading knowledge.
You already understand setups, charts, and risk management. The real challenge is turning that knowledge into systematic decisions—and following your rules when real money and emotions are involved.
You don’t need another stock tip.
You need a process you can repeat, trust, and execute with discipline.
Bookmark this list and repost it for an experienced trader who knows the theory but still struggles with execution.
There's a pattern to every explosive move. Every 50%, 100%, 200% runner shows the same signs before it takes off.
The setup is always there. You just need to know what actually matters.
Here's what they all have in common:
1. They're almost always young trends
The biggest money is made at the beginning of a trend, not the end. You want to catch them fresh off a major base, when the move is just starting to breathe. By the time everyone notices it, you're already in.
2. They respect the moving averages
Watch how price treats the 10 and 20 EMA - it's everything. The real runners bounce off these levels like they're made of steel. When a stock holds its MAs session after session without violation, that's your tell that big money won't let it break.
3. Volume confirms everything
The tape tells you who's in control before price does. Massive green bars on the push, then volume dries up completely on any pullback. That’s how you know the big money is interested in the stock.
4. First or second consolidation after the base
This is where fortunes are made. The initial structure right after a big base breakout is your high probability setup zone. You're early, you're positioned, and if the position works in your favor, the risk reward equation becomes absurdly skewed.
5. Strong follow-through days
One big green bar means nothing - it could be a trap. But when you see three, four, five days of relentless buying with tight closes near the highs, that's a conviction you can trust. That's when you know it’s actually big money. Don’t ignore such signs.
#Trading
The 9/21/50 EMAs identify short, medium, and long-term trends, while RSI measures momentum. Together, they help traders assess trend direction, momentum strength, potential entries, exits, and overbought or oversold conditions.
Right now its more important than ever to know the price action cycles...
As stocks bottom their characters change
This is called the cycle of price action
I originally learned this concept from @OliverKell_ and it has helped me tremendously coming out of a market correction...
Instead of focusing on dead money off the lows you wait for new emerging names to start showing momentum
The cycle is quite clear and has 4 stages:
1. Overextension reversal
Think about this as the capitulation and or bottom
The stock gets:
-Overextended from the moving averages
-Sellers start chasing
-Buyers can no longer take the pain
Leading to a strong reversal
2. Wedge pop
This is when a stock start going from dead money to tradeable and momentum is likely going to return
The stock:
-Reclaims the 50 EMA for the first time since the overextension reversal
This is the first point of interest in the stock and can help us establish relative strength
3. EMA cross back
This to me is the money maker... the stock has already reclaimed all the moving averages and now it pulls in to form a tight pattern off the EMA's
Many times this gives you incredibly tight risk with great reward as the stock is in a new established trend
The stock:
-Pulls into the key moving averages
-Forms a tight pattern
-Breaks out into new highs
4. Base and break
The stock sets up its first big base after the initial trend off the lows
This sets up for a big strong move higher later in the trend
Study this so you are prepared to take advantage of the next emerging stocks
🟩Simple and repeatable.
💥I focus on the rising 10 and 21 day moving averages for early momentum.
📌High tight flag breaks:
✅Big moves up.
✅Pullback to rising moving averages,
✅Series of higher lows,
✅Potential undercuts and reclaims,
✅Tight ranges,
✅Breakout.
A friend of mine asked me recently... "do you prefer buying pullbacks or breakouts?”
I used to think I needed a concrete answer to questions like this. But the deeper I get, the more I've realized that such thinking is way too rigid for my personality.
My actual answer is: whichever one the market is paying me for right now.
And there's a lot more nuance behind that than it sounds.
Through time, I've learned that the same setup can behave completely differently depending on where we are in the market cycle. In a choppy environment, I can find the best looking breakout imaginable, buy through the pivot, and watch it travel 2% before reversing directly back into the base. Do that enough times, and you slowly bleed yourself out through a 1,000 paper cuts.
So when breakouts aren't following through, I naturally gravitate toward pullbacks in the strongest names. I'm looking for stocks that have "already" proven themselves with a Stage 1 → Stage 2 breakout and are now giving me their first orderly pullback into something like the rising 9/21EMA.
But there's an important distinction here... I don't buy the pullback simply because price touched the 9EMA.
That would be way too easy lol.
I want the stock to pull back constructively: ideally lighter volume, relative strength versus the market + its group, tight price action, sellers unable to make much progress, and then I wait for buyers to prove themselves on the right side.
That's where my lower TFs come into play.
A stock could be pulling back on the daily chart while simultaneously breaking out on the 15/30 minute chart.
I might see a leader flush into the daily 9EMA, but instead of trying to catch the exact bottom, I'll wait for a 15/30 minute pivot to develop. Once buyers start taking back control and that intraday pivot high gets reclaimed, that's where I want to enter, usually risking against LOD or the technical pivot.
So technically I'm buying a daily pullback and an intraday breakout at the exact same time.
Price is FRACTAL.
That's how I perceive “buying weakness” on leadership. My system specifically calls for buying pullbacks only once the stock turns back upward--not while it's still falling.
Now flip the environment.
When the market is trending, breadth is expanding, my scans are filling up with RS names, breakouts are sticking, and (most importantly) my own trades are immediately giving me cushion, I'm much more willing to simply buy the breakout.
BUT WHY?
Because the best stocks can be incredibly rude.
They don't care that you wanted the perfect 9EMA retest.
Sometimes a stock spends 8 weeks compressing, volume dries up, it finally clears a major weekly pivot on volume...
…and never looks back.
I'll gladly pay up for that confirmation rather than watch a true leader leave without me. My system is built around the idea of compression → expansion, and some of the largest opportunities I'm hunting are Stage 1 bases transitioning into Stage 2 trends.
This is also why I'm constantly talking about tension → release. I'm not obsessed with whether my entry gets classified as a “breakout” or “pullback.”
I'm obsessed with where I am in the cycle of price action.
Give me... RS → strong group → big base → tightness → declining volatility → volume contraction → buyers step in → expansion. Now you've got my attention & focus.
Another concept is that my breakout entry and pullback entry don't exist in isolation from my equity curve. If I've taken 3 trades recently and nothing is following through, I'm not suddenly slamming full size into the fourth breakout because the chart looks pretty.
I'll probe... & if that works, maybe I add. And if another setup works, I'll add more exposure.
If everything starts working simultaneously, I'll press.
That's progressive exposure in simple form.
My own trading system literally ranks my equity curve above the indices when determining aggression. If the market looks incredible but my setups aren't paying me, I become defensive. If the indices still look questionable but my RS names keep working, I listen to my trades.
I've gone from mostly cash to heavily invested within a few days before, not because I woke up and declared myself “bullish,” but because 1 position worked, then another worked, then another worked.
The market earned my exposure.
That's probably the biggest evolution in how I think about this question.
The first few years in my journey, I spent way too much energy trying to perfect the entry. Now I'm trying to perfect the decision surrounding the entry.
So yes, I love breakouts. Some of my biggest winners have come from simply buying a great stock as it leaves a great base and then getting the hell out of its way. But if I miss that move?
I'm not chasing it 10% above the breakout because my ego tells me I need to own it. I'll simply wait.
If it's truly a leader, there's a good chance I'll eventually get another opportunity...maybe a pullback into the 9/21EMA, an inside day, a tight flag, an EMA crossback, another multi-day base, or some other area where price tightens and I can define my risk again. In fact, once a stock has transitioned into Stage 2, I'm actively interested in the constructive flags that develop along the way.
That's why my answer isn't really breakouts vs. pullbacks anymore. It's where is the market offering me asymmetry RIGHT NOW? Strong trending market? I'll happily pay up for momentum. Choppy market? Give me the RS leader pulling into rising moving averages.
And regardless of which entry I take, I want the exact same thing. Tight risk if I'm wrong + enough potential expansion to make being right matter.
Everything else is just an entry tactic.
My 2 cents.
Here are 10 great technical trading rules that will help you build a systematic approach to trading:
1. Start with the weekly price chart to establish the long-term trend, then work down through the daily and hourly charts to trade in that trend's direction. The odds are better if you are trading in the direction of the long-term trend.
2. In Bull Markets, the best strategy is to buy the dips. In Bear Markets, the best strategy is to sell short into each rally. Always go with the path of least resistance.
3. Support and resistance levels can hold for long periods; the first few breakout attempts usually fail.
4. The more times a support or resistance level is tested, the greater the odds that it will be broken. Old resistance can become new support, and old support can become new resistance.
5. Trend lines are the easiest way to measure trends by connecting higher highs or lower lows, and they must always go from left to right.
6. Chart patterns are visible representations of the price ranges that buyers and sellers are creating. Chart Patterns are connected trend lines that signal a possible breakout buy point if one of the lines is broken.
7. Moving averages quantify trends and generate signals for entry, exit, and trailing stop orders.
8. Moving averages are great tools for traders, but they are best used alongside an overbought/oversold oscillator like the RSI. This maximizes exit profitability on extensions from a moving average.
9. 52-week highs are bullish, and 52-week lows are bearish. All-time highs are more bullish, and all-time lows are more bearish. Bull Markets have no long-term resistance, and Bear Markets have no long-term support.
10. Above the 200-day is where bulls create uptrends. Bad things happen below the 200-day: downtrends, distribution, bear markets, crashes, and bankruptcies.
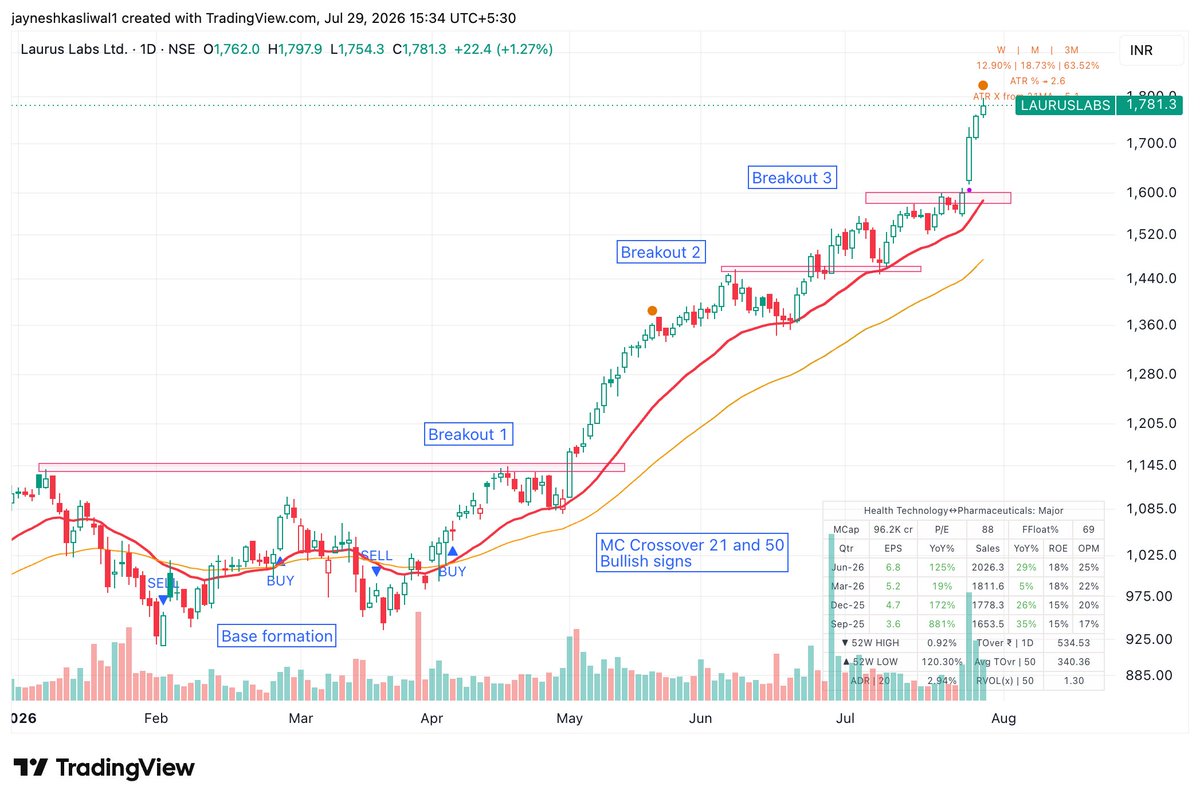
Swing Trading Strategy in 10 Mins
Rules-
💠Look for Stocks that have made a moving average crossover after the stock has corrected significantly
💠After the crossover has happened , you need to wait for the stock to move 8-10% up , don’t enter on MA crossover Blindly
💠The stock should have made a base and then wait for base breakout on higher volumes
Stoploss should be below the breakout level
Example - #LaurasLabs
Stock made Crossover near April and resistance was at 1145rs , single candle broke the resistance that was entry 1
Do not enter in middle of the trend , always wait for base formation , that is breakout 2
Stock should trend above 21 ema , with structure of HH-HL not breaking previous swings
Example - #Divis Labs
Ma Crossover near 6250 but there was no base on the breakout
Base became visible after many months
Breakout was near 6700
2nd Breakout near 7400
Stoploss max 8% or Below Base whichever is lower
ADVANCED BULLISH CHOCH 📈
✅ Wait for multiple Breaks of Structure (BOS).
✅ Confirm a Change of Character (CHOCH).
✅ Enter on the retest of the demand zone.
✅ Place your Stop Loss below the swing low.
✅ Target the next Higher High (HH) or liquidity.
🎯 BOS + CHOCH + Demand Zone Retest = High-Probability Buy Setup.
THE TRADERS CATCHING THE BIGGEST MOVES AREN'T GUESSING.
THEY'RE READING ONE SPECIFIC TYPE OF BUYING THAT SHOWS UP BEFORE EVERY MAJOR RUN.
IT HAS 6 CHARACTERISTICS. MISS ONE AND YOU'RE PROBABLY LOOKING AT THE WRONG STOCK.
HERE IS WHAT REAL INSTITUTIONAL BUYING LOOKS LIKE:
Before a stock goes on a massive run, it leaves six clues in plain sight.
They all show up during the boring pause everyone ignores.
Most traders wait for the breakout candle. By then the clues are old news.
Here's what the chart was telling you weeks earlier:
Money is killing 90% of traders.
Do yourself a favor:
- 0% focus on money
- 100% focus on risk and execution
You trade 10x better when you stop focusing on money.
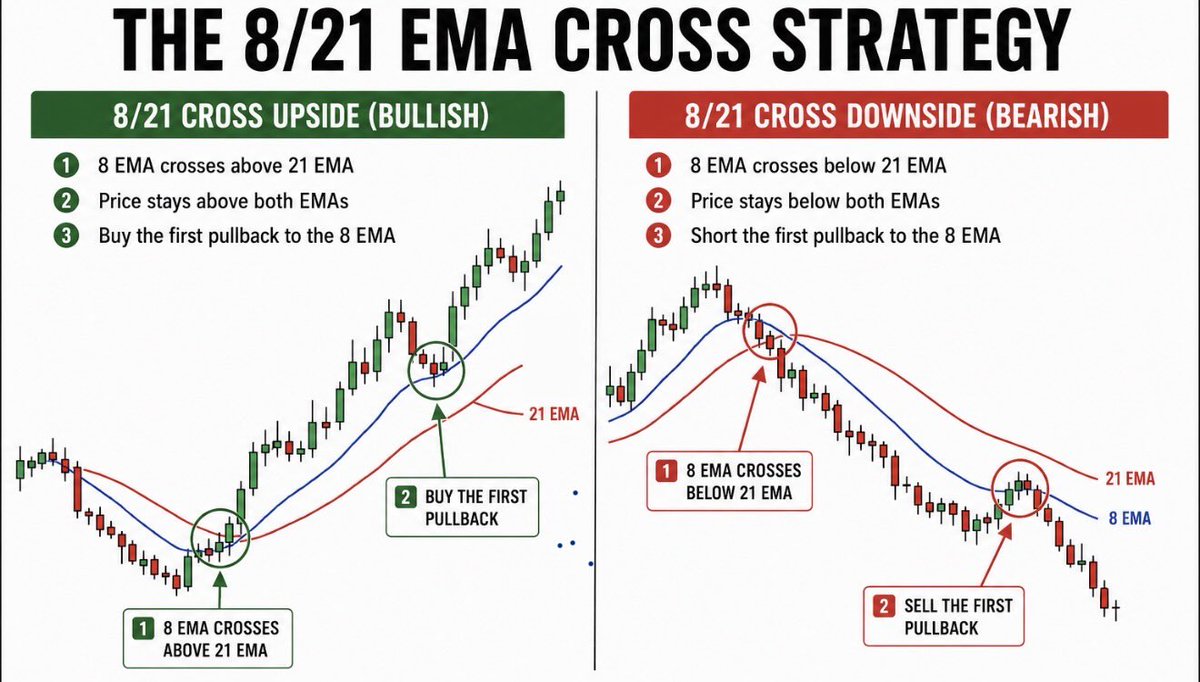
THE 8/21 STRATEGY IS WHAT WILL HELP YOU RETIRE
Save this before you trade Next
Bullish:
• 8 EMA crosses above 21 EMA
• Buy the first pullback
Bearish:
• 8 EMA crosses below 21 EMA
• Sell the first pullback
Timeframes
• Daily & Weekly = Swing
• 5 & 10 Minute = Day Trades
📌Simple but really effective👇
1. Strong first-leg move
2. Pullback to rising 10/20EMA
3. 2-5 day tight price range
4. Buy the breakout
Rinse and repeat.