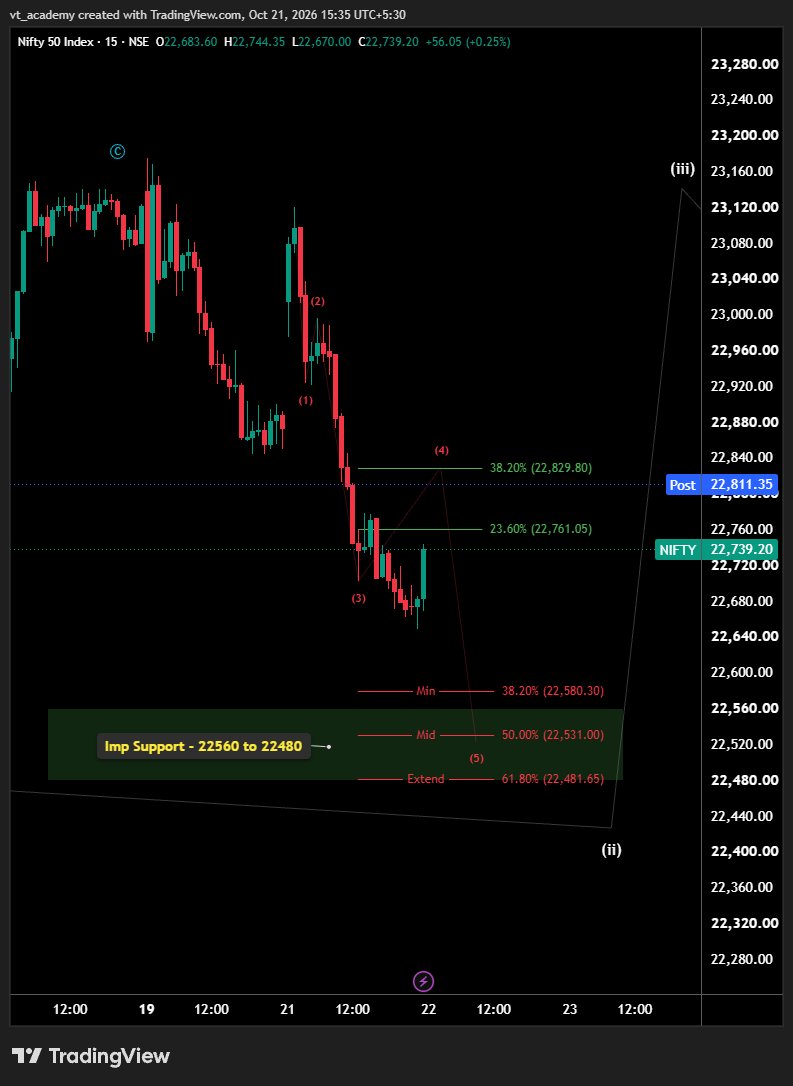
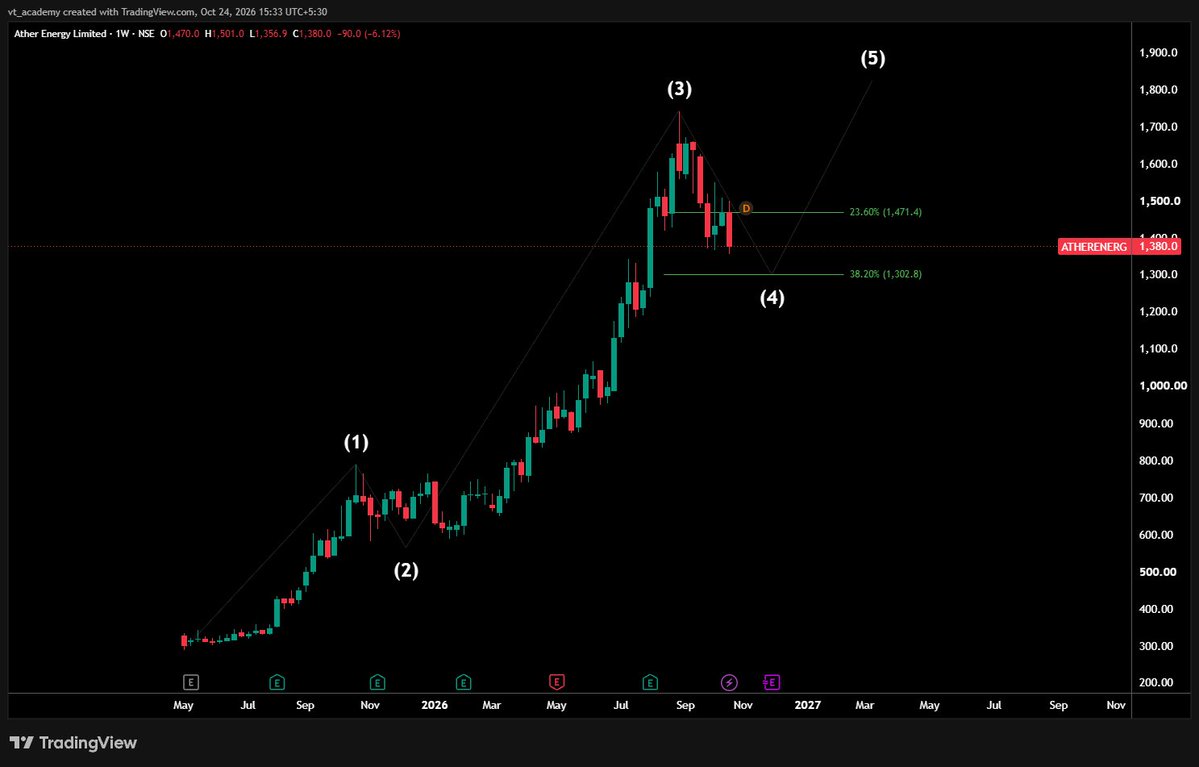
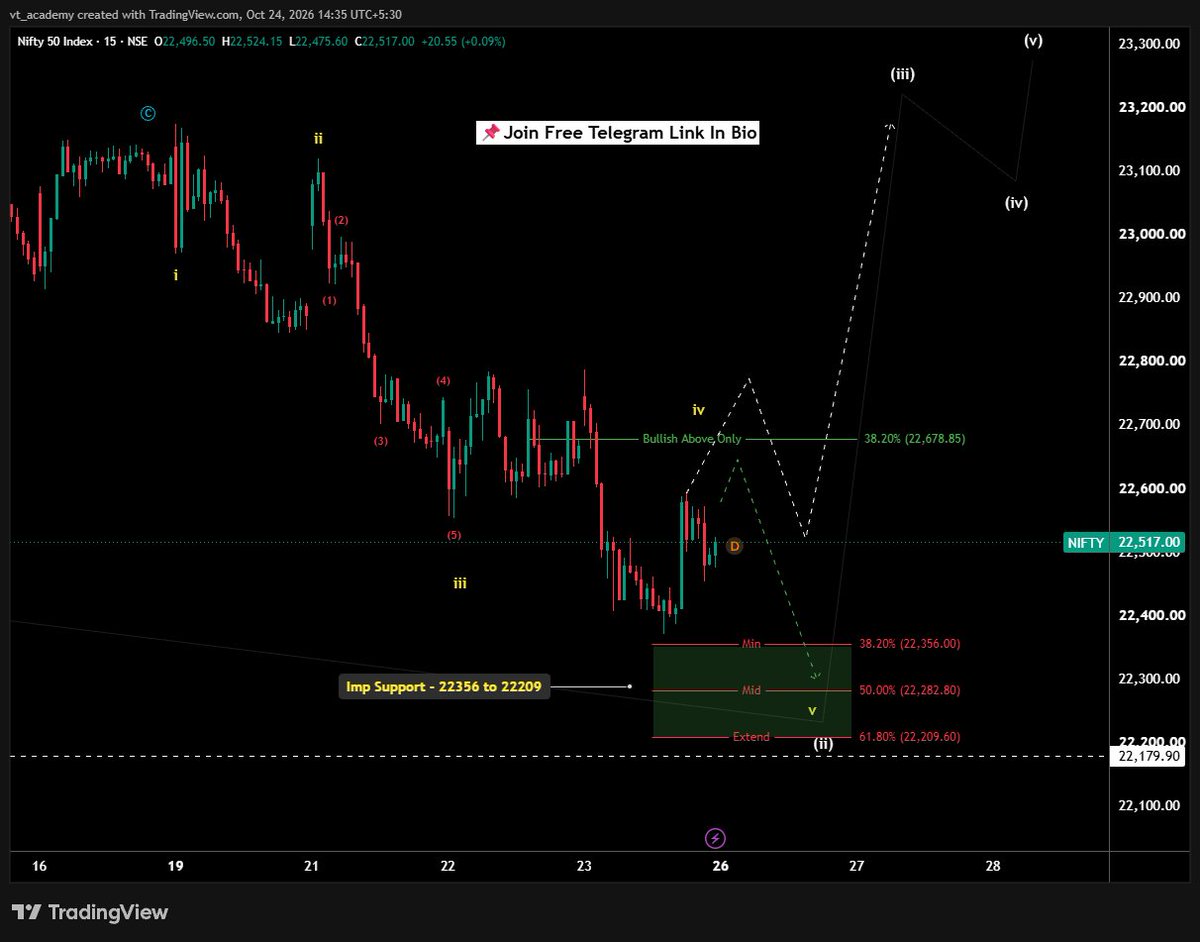
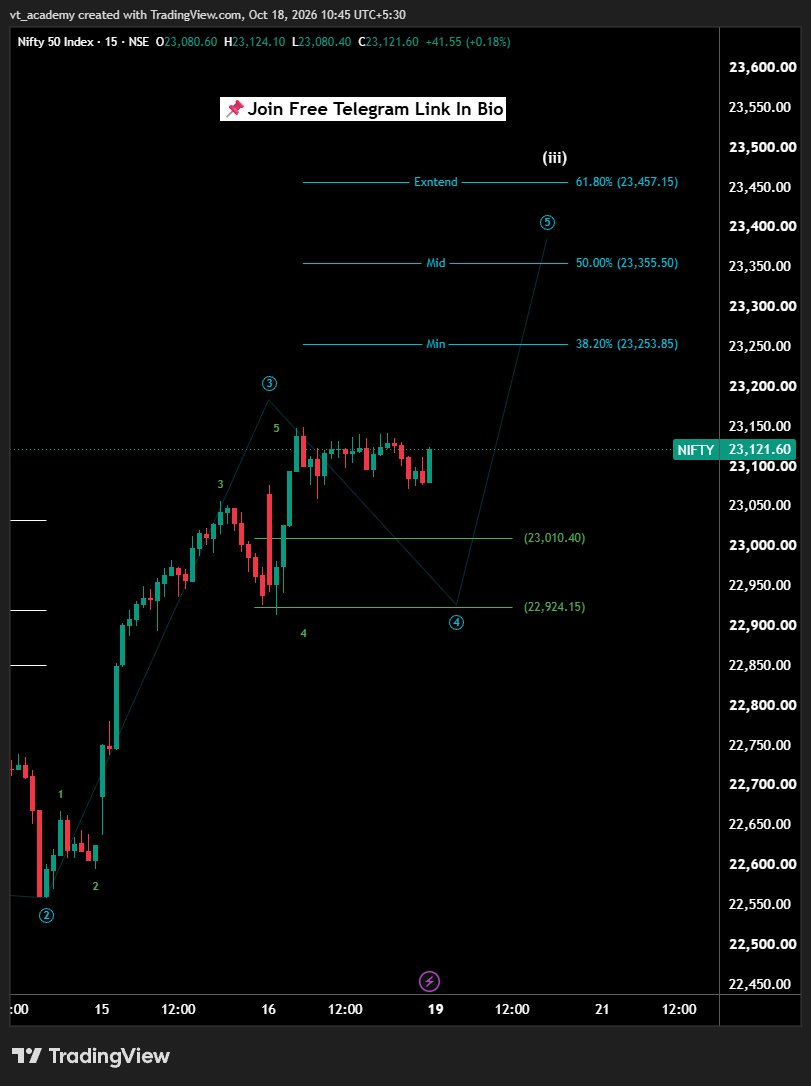
Nifty 50 15 min chart (19 to 23 OCT 2026) 📈
Chart shows Elliott Wave uptrend.
Wave 5th Upward Pending ✅
Key levels:
#Buy_On_Dips
Support - 23010 to 22924
Wave 5th Levels = 23,253 to 23,457
Current: 23,121.60. Watch these Fib & marked zones for moves.
#Nifty50#ElliottWave
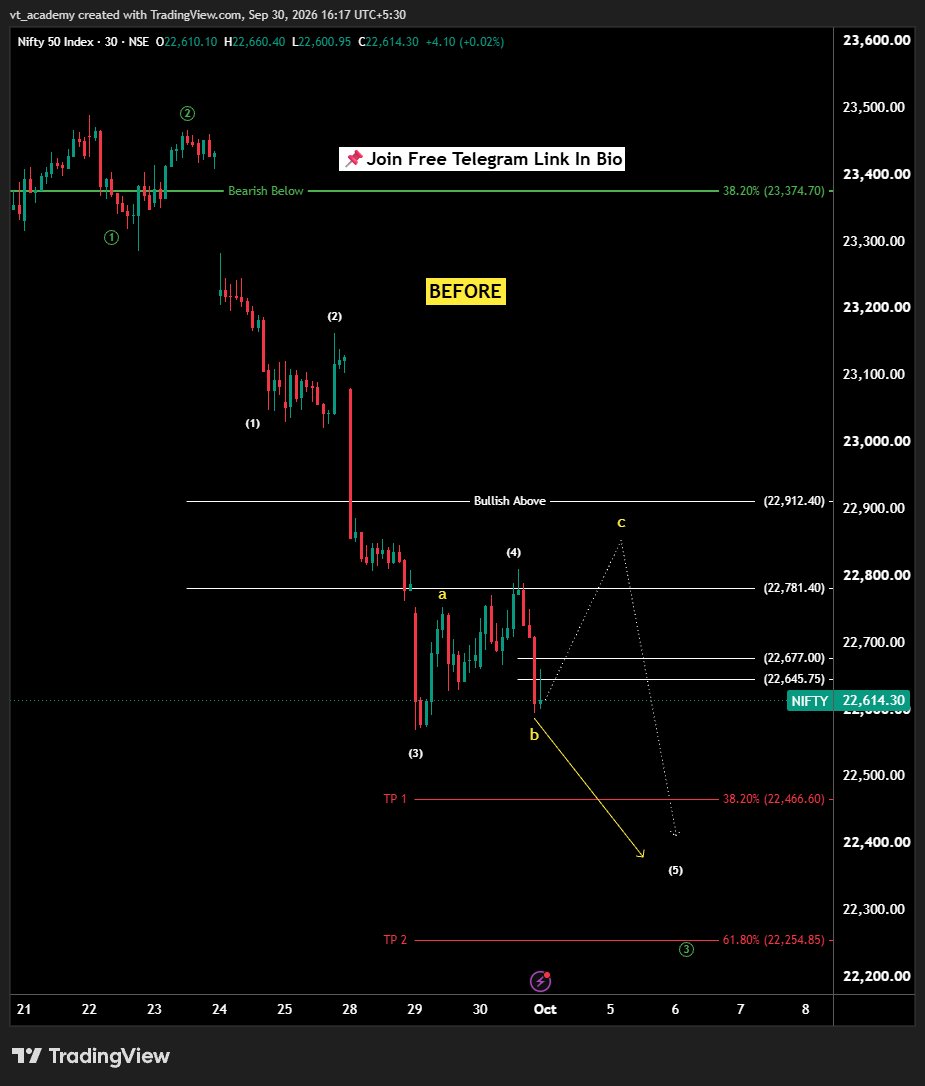
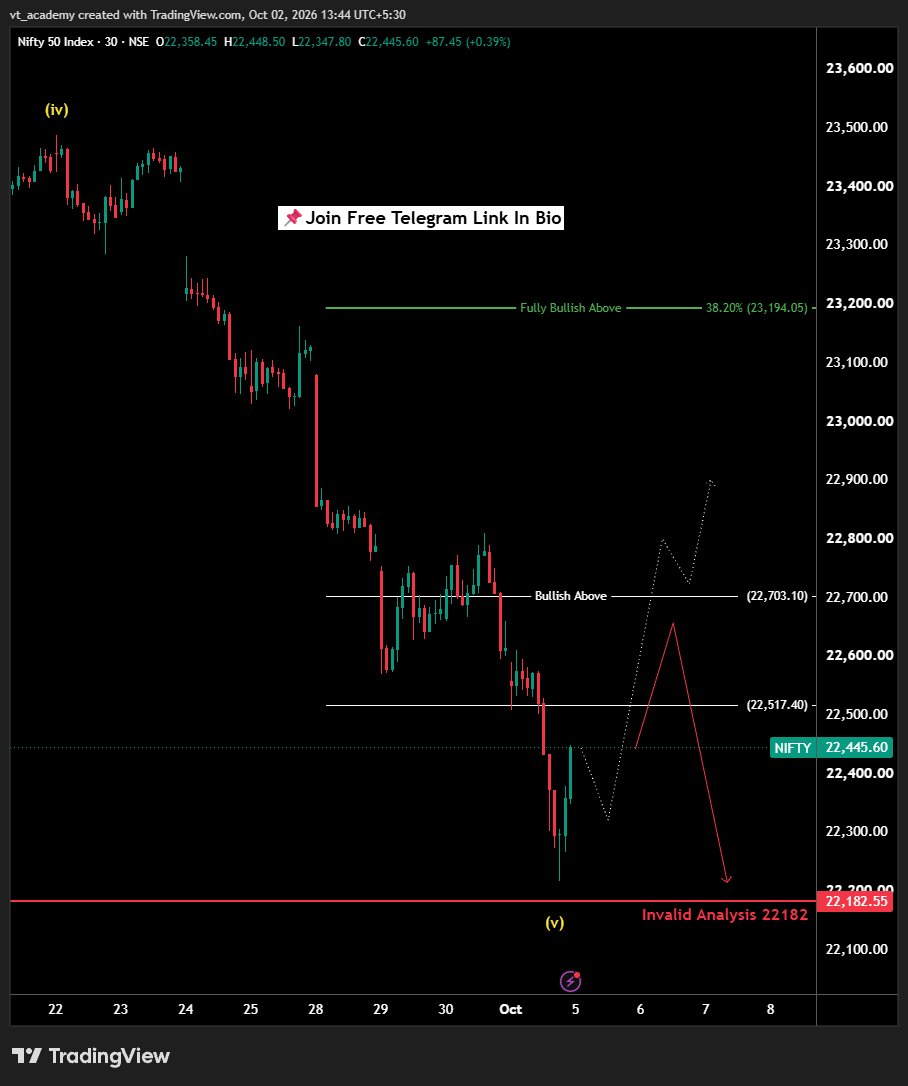
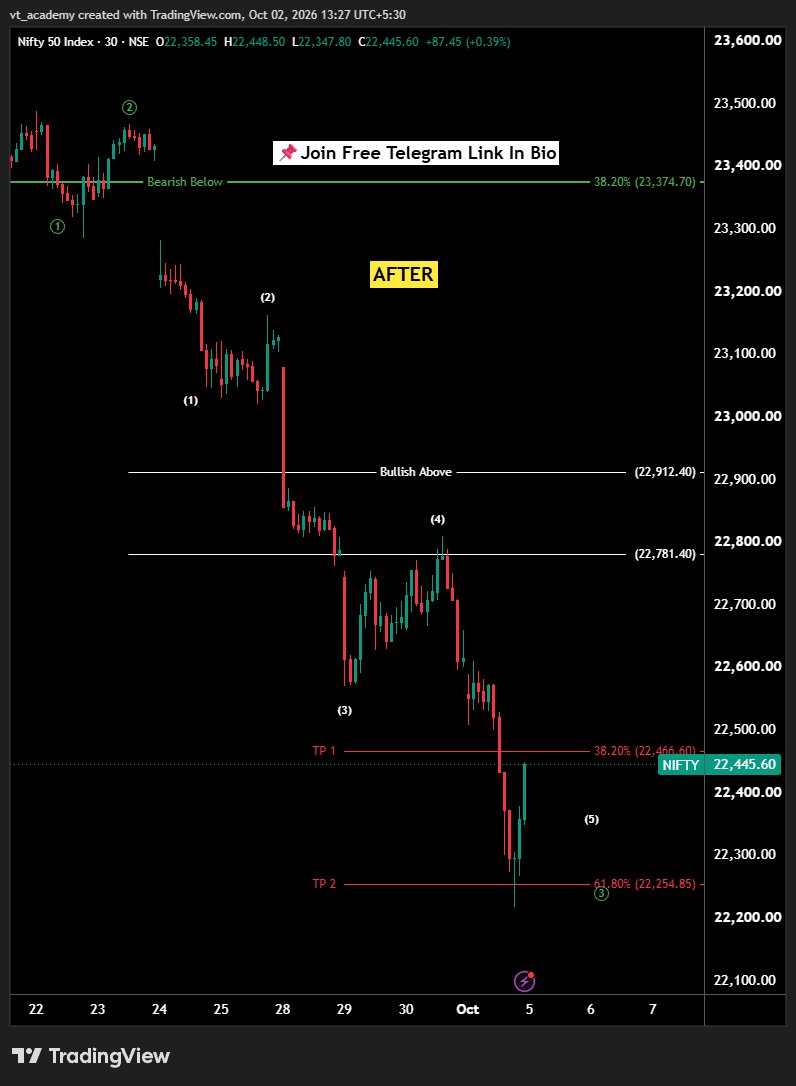
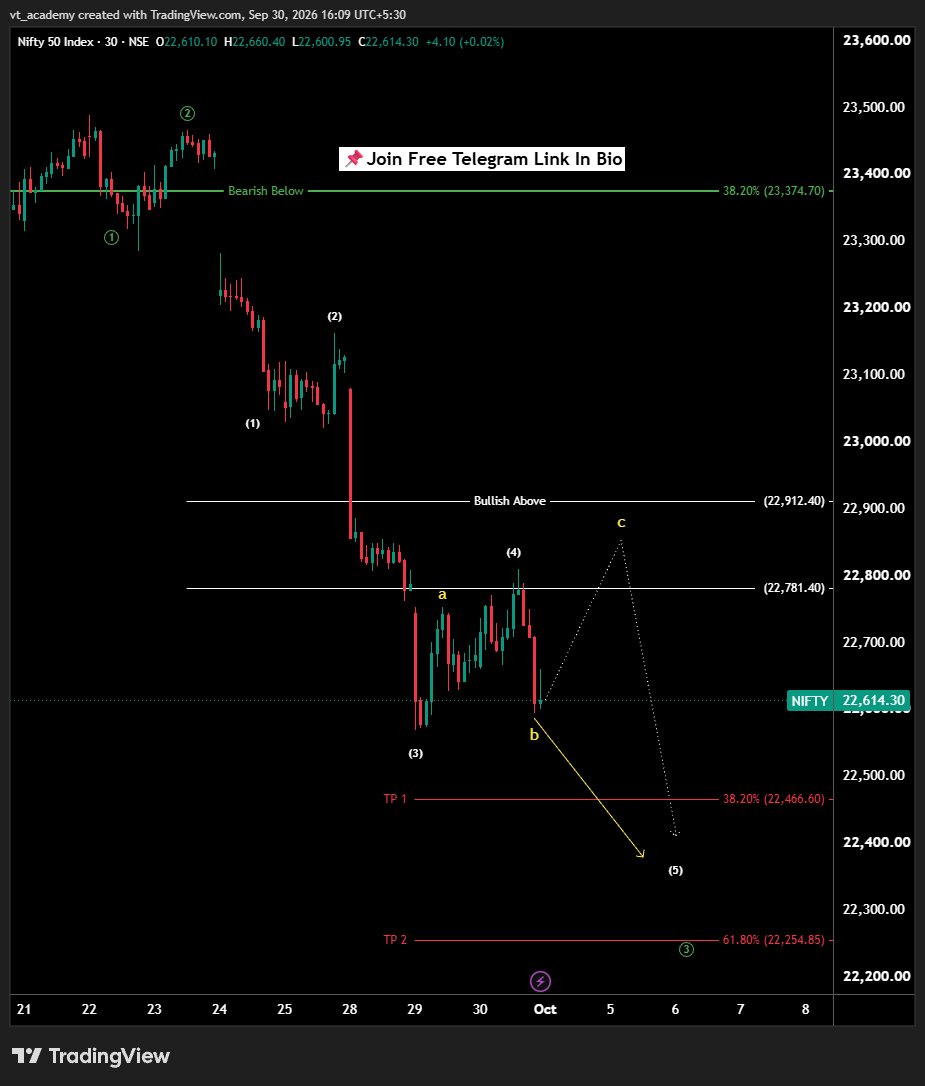
Nifty 50 30 min chart (01 OCT 2026) 📈
Chart shows Elliott Wave downtrend.
Wave 5th decline Pending ✅
Key levels:
Bullish Above 22,913
Support 22,466 to 22254
If break above 22677 then Yellow abc formed.
Sharp bounce possible in next two days 📷
#Nifty50#ElliottWave
Nifty 50 15-min chart (29 Sep 2026) 📈
Wave 5th decline complete ✅
Key levels:
• Bullish Above 23,031
• Support 22,721 to 22700
Sharp bounce possible in next two days 🚀
#Nifty50#ElliottWave#NiftyAnalysis#OptionTrading