bitcoin-cash:native Is Up 93% From Our Entry Zone | My $2,000 Target Still Stands 🚀
In my previous analysis, I said #BCH could drop into the $200-$170 accumulation zone.
It perfectly followed the setup and dumped to around $181, right inside our support zone.
Now BCH/USDT has hit $354, delivering ~93% upside from our entry zone.
Hope you’re enjoying the move! ❤️
And yes, my BIG $2,000-$3,000 targets are still the same for the upcoming BIG Altseason & Bull Market.
The setup is playing out. 🚀
If You’re Happy With The Profits So Far, Consider Booking Partial Profits And Enjoying The Gains.
NFA & DYOR
@BitcoinCashOG
Bitcoin Whale Wallet Moves After 14 Years!
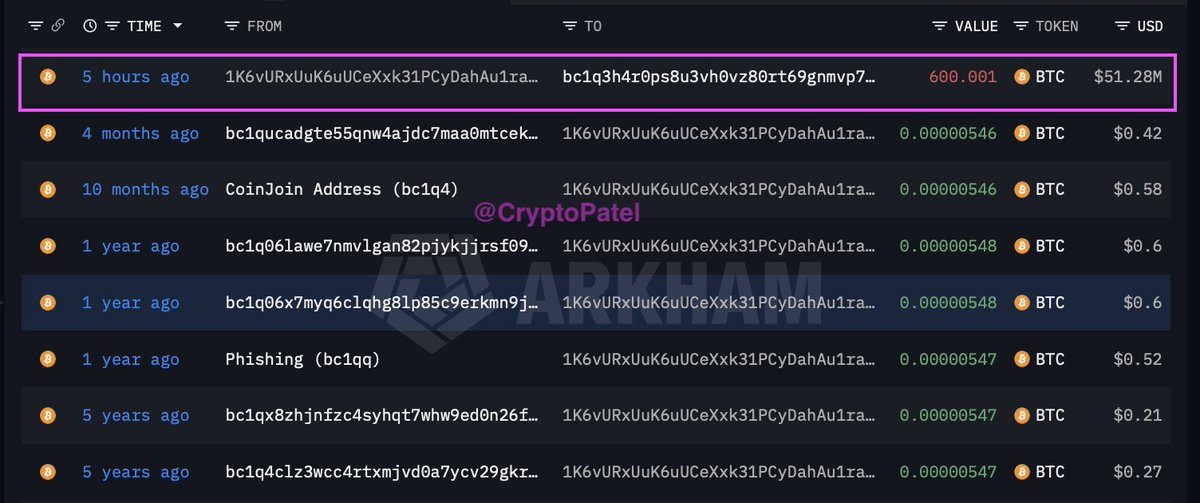
A dormant Bitcoin wallet has suddenly moved all 600 $BTC, currently worth around $51.28 million.
The wallet received these 600 BTC about 14 years ago when Bitcoin was trading near $8, making the holdings worth only about $4,800 at the time.
Today, the same Bitcoin is worth over $51 million, representing an incredible 10,683× increase.
Binance Invests $100M In Circle.
The Deal Includes A New 5-Year Partnership To Expand $USDC Access, Adoption, And Infrastructure Across Emerging Markets.
A Major Move For Stablecoins, Digital Dollars, And Global Crypto Payments.
$1.06B In Crypto Liquidations In Just 24 Hours With 1.37M+ Traders Wiped Out.
Shorts Accounted For $845.76M, While The Largest Single Liquidation Hit $20.86M On BTC-USD.
Shorts: $846 million
Longs: $213 million
Leverage Is Ruthless.
ETHEREUM: THE 8-MONTH BEARISH STRUCTURE HAS FINALLY BROKEN
$ETH Has Now Fully Shifted Its HTF Market Structure After Breaking The Critical $2,464 CHoCH Level.
The Bearish Structure Was Invalidated Once ETH Secured A HTF Close Above $2,464, And Price Subsequently Expanded Toward $2,806, A Level Not Seen Since January 30, 2026.
After Falling From ~$4,960 To ~$1,500, ETH Spent Nearly 8 Months Inside A Bearish LL → LH Structure.
That Structure Is Now Invalidated.
#ETH HTF SMC + ICT MARKET MAP:
🔹 $2,464: Critical CHoCH / HTF Structure Broken
🔹 $2,806: Current Expansion High
🔹 $2,900–$3,055: Major Bearish OB + Liquidity
🔹 $3,400: Major HTF Liquidity Zone
🔹 $2,100–$1,900: Potential HL / Bullish FVG + OB
🔹 $1,900–$1,800: Deeper Retracement Zone, Only If $2,357 Breaks With HTF Close
ETH Is Now Around 87% Above The Recent ~$1,500 Bottom.
The Market Structure Has Shifted From: LL → LH To: HH → HL → HH → HL
I’m Not Buying ETH At The Current Level.
I Would Rather Wait For A Proper Higher-Low Formation And Look For The Next Long Opportunity On A Retracement Instead Of Chasing The Current Expansion.
MAJOR LIQUIDITY ABOVE:
Keep A Close Eye On The $2,900–$3,055 Bearish Order Block And The $3,400 Liquidity Zone.
If ETH Sweeps These Areas, I Would Expect A Meaningful Downside Retracement Before The Next Expansion Leg.
I’m Not Trying To Predict The Exact HH.
The Important Part Is Waiting For The HL.
If ETH Retraces Into The $2,100–$1,900 Region, This Becomes A Very Important Area To Watch For A Long Setup Because The Zone Contains Both A Bullish FVG And Bullish Order Block.
A Deeper Retracement Toward $1,900–$1,800 Would Require ETH To First Break $2,357 With A Confirmed Daily Candle Close Below It.
If The Bullish Structure Remains Intact, This Could Eventually Develop Into A Larger Expansion Toward A New ATH And Potentially The $10K Macro Target.
Structure First.
Liquidity Second.
Entry On The HL.
NFA | Always DYOR
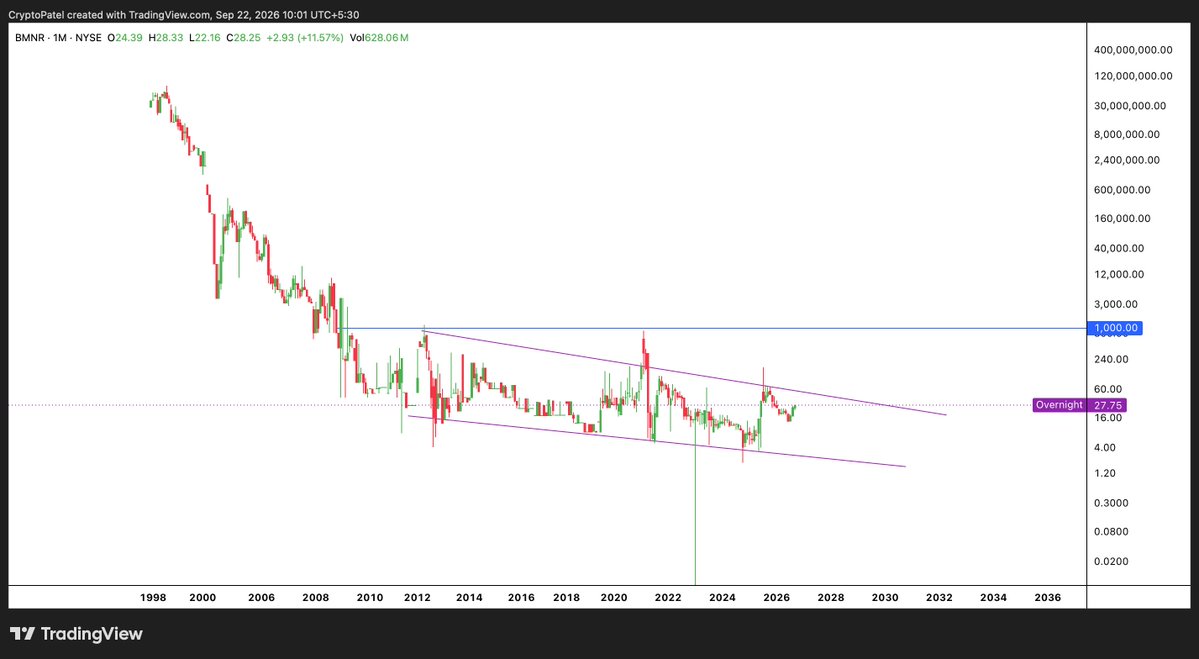
$BMNR Looks Crazy On The Long-Term Chart 😂 TradingView Shows A Split-Adjusted 1998 ATH Of ~$77.5M, While The Stock Trades Around ~$28 Today.
But The Bigger Story Is Ethereum: BitMine Now Holds 5,983,940 $ETH (~4.9% Of Total ETH Supply), With 5,067,309 ETH Already Staked.
Can $BMNR eventually reclaim $1,000?
$AMD: FROM $1.61 TO $616 | IS THE MACRO RETRACEMENT STILL COMING?
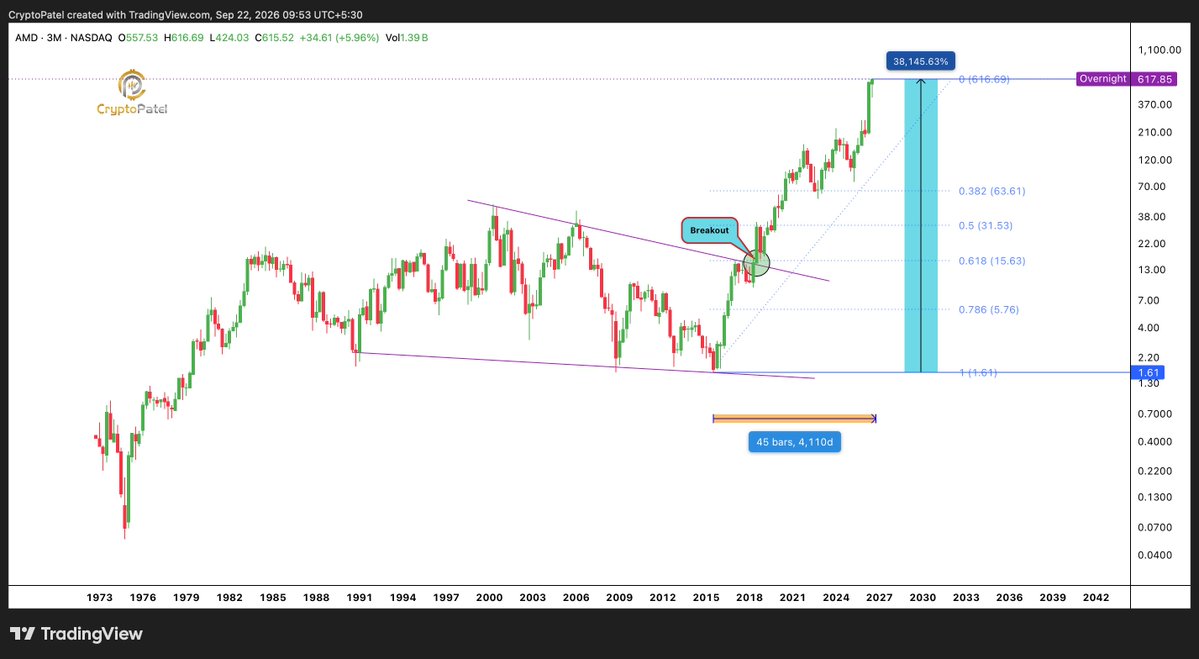
#AMD Stock has delivered an insane 38,200%+ move since July 2015.
Back then: $1.61 | Today: ~$616.69
That Means:
▶️ $1,000 invested in AMD → ~$382,000 today
▶️ That's roughly 382X your original investment.
But here’s what catches my attention 👇
On the Macro 3-Month chart, AMD has been in an extremely strong long-term uptrend after breaking above its multi-year descending trendline.
The interesting part?
Since the 2015 bottom, we haven't seen a major macro retracement toward the 0.382 or 0.5 Fibonacci levels.
And this is where I become cautious.
I’m NOT calling the TOP.
I’m NOT saying AMD will crash tomorrow.
But in a long-term chart, deep retracements are part of market cycles.
If a major macro correction eventually arrives, the $60–$30 zone could become an area to watch over a much longer timeframe.
That doesn't mean 1 year.
It could take 5–7+ years to play out.
For me, the strategy is simple:
I won't try to predict the exact ATH.
I’ll wait for the macro structure to tell me.
@AMD can continue higher but the bigger the parabolic move becomes, the more important the eventual macro retracement becomes.
NFA. Always DYOR.
BITCOIN DERIVATIVES ARE CHANGING FAST
Options Now Make Up Nearly 50% Of Bitcoin’s Crypto-Native Derivatives Market, Up From ~25%, As Dated Futures Fade And Perpetuals Take Over Leverage.