$TSLA - TESLA RECALLS NEARLY 3 MILLION VEHICLES IN CHINA
Tesla is recalling up to 2.98 million vehicles in China, its largest-ever recall in the market.
The company will fix emergency door-release safety issues through warning labels and a software update that lowers windows after severe crashes.
Separately, 2.74 million Model 3 and Model Y vehicles will receive an over-the-air update to improve driver-attention monitoring and reduce collision risks when driver-assistance features are active.
Here are the steps how I build a high-conviction weekly watchlist.
1. Establish the Top-Down Market Context
Before looking at individual tickers, evaluate the health of the broader market. Check major indexes (S&P 500, Nasdaq) relative to key moving averages to identify the current market regime. Rule of thumb: Only look for aggressive long setups when the broader market trend is supportive; if indices are breaking down or highly choppy, tighten criteria or sit on your hands.
2. Run Objective Scans for Relative Strength
Filter the universe of stocks for institutional accumulation using specific technical criteria:
Relative Strength (RS): Look for stocks outperforming the general market (making new highs or holding up resiliently while the market pulls back).
Volume Signatures: Screen for volume anomalies, HV1 or HVE (highest volume in one year or ever), or sudden liquidity surges indicating institutional sponsorship.
Trend Alignment: Filter for names trading cleanly above key intermediate trend filters (such as the 21-day EMA or 8-week line).
3. Sort and Categorize Your Setup PoolOrganize your filtered candidates into structured watchlists based on chart structure rather than chasing random movement:
Breakout / Continuation Watchlist: Stocks consolidating tightly near recent highs (forming flat bases, flags, or cup & handle bases) ready to clear overhead resistance.
Pullback Watchlist: Leading stocks pulling back methodically on lighter volume toward the 21 EMA or 8-week moving average to test support.
Earnings Catalyst Watchlist: Companies that recently posted strong "beat and raise" quarters with explosive reactions, building initial multi-week bases for a secondary continuation move.
4.Define Your Action Plan (The "Right/Wrong" Thesis)For every single stock that makes the final cut onto your weekly watchlist, write down your execution parameters ahead of time:
The Trigger: Exactly what price action or breakout level signals entry?
The Risk Control: Where does the thesis fail? Define your strict stop-loss level.
The Target: Map out initial reward zones to ensure a favorable risk-to-reward ratio (e.g., 1:3 or better).
5. Set Price Alerts and Execute with Discipline.
Input your key level alerts directly into your charting platform so you don't have to stare at the screen all day. Treat your watchlist like a sniper's target list: wait patiently for the market to bring the setup to you, execute precisely when your criteria are met, and discard anything that fails to trigger.
Professional momentum traders use the Relative Strength (RS) blue dot 🔵 indicator which flags when a stock's RS line prints a new 52-week or all-time high as a primary weapon for early institutional detection and risk-defined positioning.
Here is how pros leverage it to gain an edge:
1. Spotting Accumulation Before the Price Breaks Out
The Concept: True institutional sponsorship shows up in the volume and relative strength long before the headline price chart makes a splash.
The Pro Play: When a blue dot appears while a stock is still consolidating tightly inside the right side of a base or flagging underneath a structural pivot, it signals that heavy institutional accumulation is underway. Pros use this as an early warning siren: “Big money is quietly absorbing supply here while the broader market sleeps.”
2. Filtering for Elite Leadership
The Concept: Not all breakouts are created equal. Buying a stock that breaks out on lagging relative strength is a recipe for a failed move.
The Pro Play: Pros demand that any long setup on their watchlist carries elite relative strength. Seeing multiple blue dots clustered during a base-building phase tells the trader that this specific name is outperforming its sector peers and the major market indexes (like the S&P 500 or Nasdaq), making it a prime candidate for explosive trend continuation once the general market catches a bid.
3. Building High-Conviction Sizing
The Concept: Position sizing should scale proportionally with conviction and structural support.
The Pro Play: When a textbook setup (like an S/R flip or a tight post-earnings flag) aligns with a fresh blue dot RS milestone, pros treat it as an A-grade confluence. This confirmation gives them the confidence to allocate full risk budget to the trade, knowing the underlying price behavior is being heavily backed by relative outperformance.
4. Pre-empting the Pivot
The Concept: Waiting until a stock is halfway through a breakout can destroy your risk-to-reward ratio.
The Pro Play: Because the blue dot catches the RS breakout before or right at the structural price pivot, savvy traders use the contraction phase right after the dot appears to pre-position with tight stop-losses (such as right beneath an inside day or moving average support). When the price finally clears the absolute pivot, they are already comfortably positioned for the markup phase.
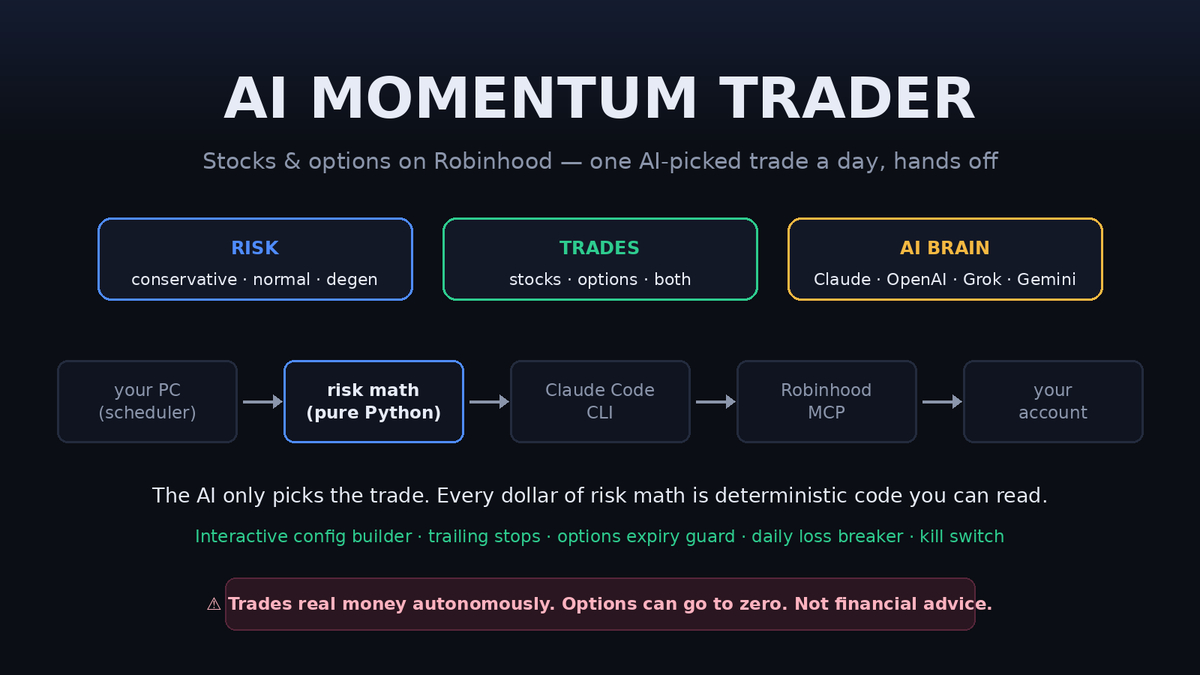
I open-sourced my AI trading agent. 🤖
Options, Stocks, momentum, beta movements does it all!
One AI-picked momentum trade a day on Robinhood stocks OR options riding a ratcheting trailing stop. Fully autonomous. Runs on your own computer.
Full repo + foolproof setup guide, free:
https://t.co/qMy25RyfQa
If you wanna throw me a bone for setting this, please check last tweet in the thread
Or just post you donating something to your local kids charity :)
🧵 how it works 👇