The clearest framing of AI's limits we've heard:
It can do the math.
It can spot the patterns.
It can't actually think.
Kyle Fleming and Dan DeGrave at Ascend with Waterloo Capital
Waterloo Capital has acquired an equity stake in Allied Portfolio Management — expanding our institutional-grade wealth management and family office services into Tucson and Scottsdale. 🌵
And we're hiring advisors in Arizona.
https://t.co/XOz6ORGQ7B
#WealthManagement#Arizona
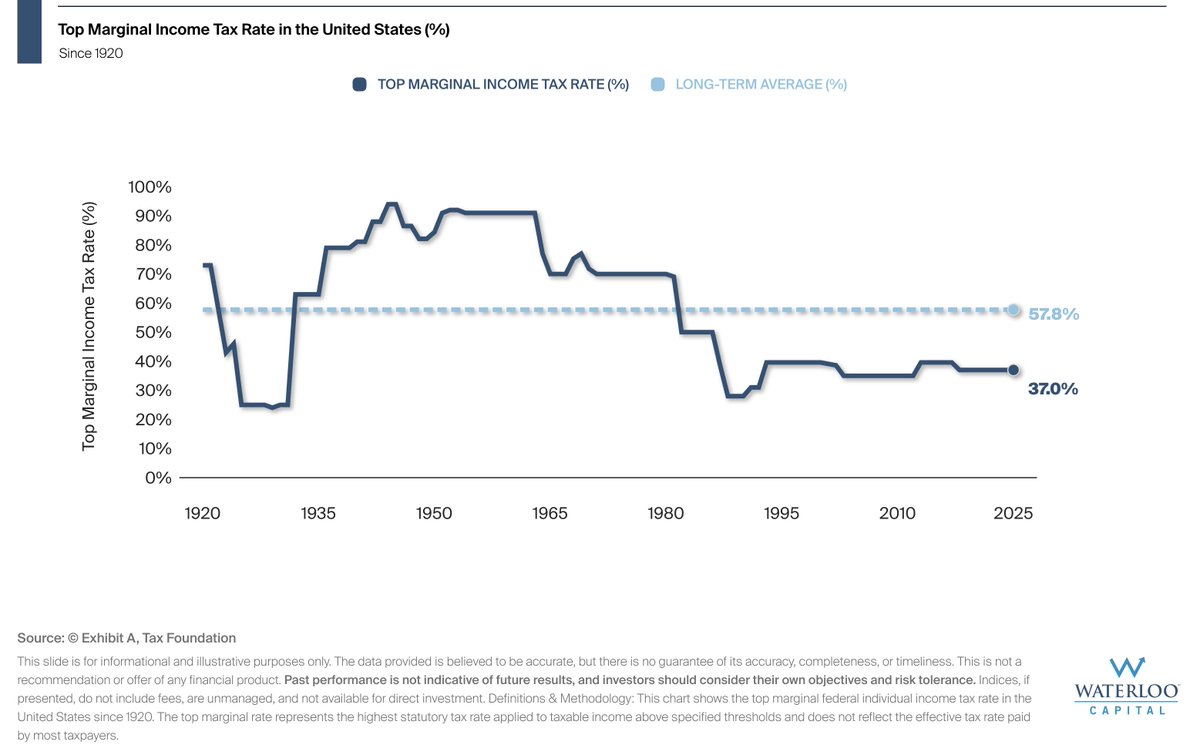
This chart shows the top marginal federal income tax rate in the United States since 1920.
Today's top marginal rate of 37.0% is more than 20 percentage points below the long-term average. After peaking above 90% in the 1940s and 1950s, rates have remained lower for decades.
Although taxes may feel high today, the historical data suggests the top marginal rate is well below its long-term average.
Chart Of the Week – Historically, The Best & Worst Days For Oil Cluster
This chart plots the daily price of Brent crude oil since 1990 and highlights the 25 best and 25 worst single day percentage moves. Rather than being spread evenly across time, these extreme days have historically tended to cluster together during periods of heightened uncertainty.
The largest single day moves, both up and down, have historically concentrated around major dislocations like the 2008 financial crisis, the 2014-2016 oil price collapse, and the 2020 pandemic. Many of the best days occurred during or immediately after sharp drawdowns, not during calm markets.
While Brent crude oil has seen some of its largest single day gains during recent periods of volatility, history suggests caution. The best and worst days have historically occurred in close proximity to one another, meaning large up days have often been accompanied by large down days shortly before or after. Past performance is not indicative of future results.
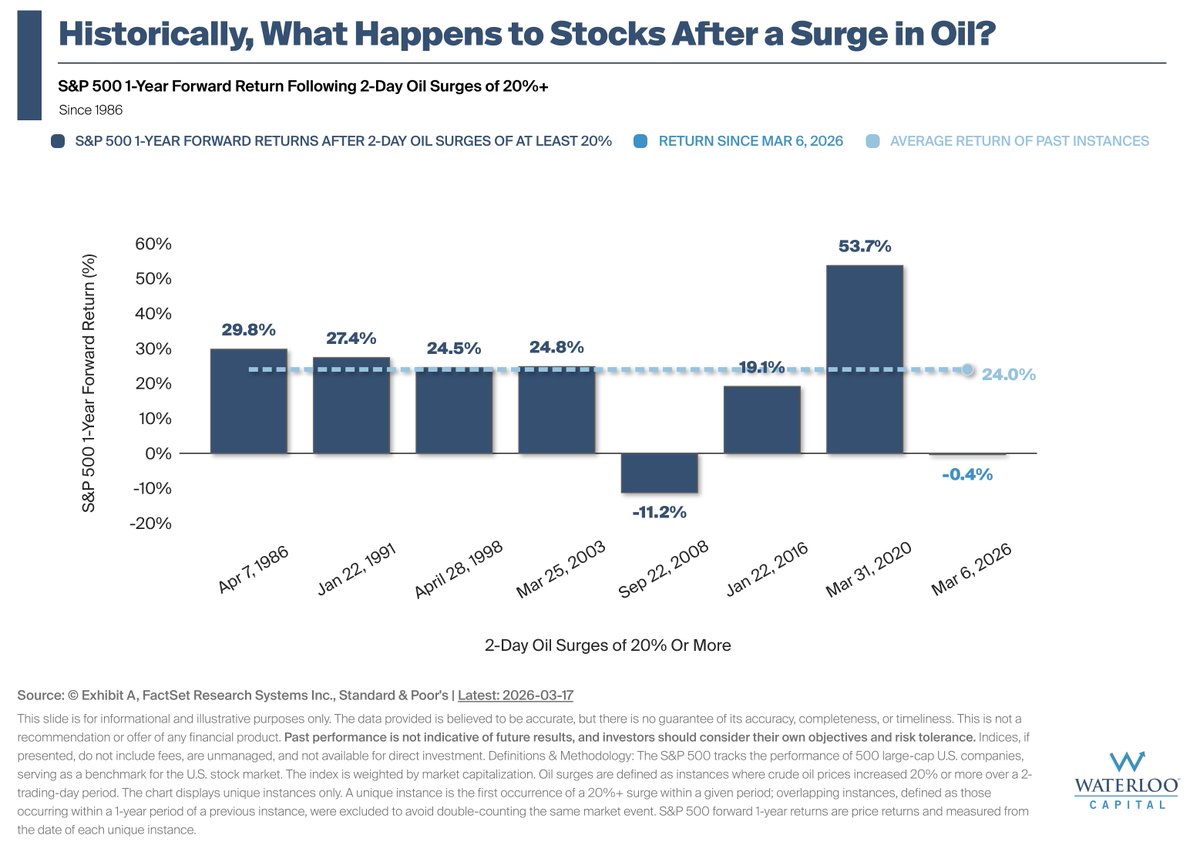
What Happens to Stocks After a Surge in Oil?
The chart illustrates how the S&P 500 has historically performed over the following year after 2-day oil price surges of 20% or more, dating back to 1986.
There have been 8 unique instances of oil surging 20% or more over a 2-day period (since 1986). In 7 of 8 cases, the S&P 500 was higher one year later. The S&P 500 has generated a -1.60% return since the March 6, 2026 instance.
While past performance is not indicative of future results, the chart shows that the S&P 500 has historically tended to show resilience the year following 2-day oil surges over more than 20%.
The chart shows the year-to-date return paths for the S&P 500, the S&P 493, and the Mag7. The S&P 493 represents the S&P 500 excluding Apple, Microsoft, Amazon, Alphabet, Meta Platforms, Tesla, and NVIDIA. The Mag7 refers to those seven companies grouped together.
Year-to-date results highlight how much of the S&P 500's return has come from the Mag7 compared with the other 493 companies.
This view helps illustrate where performance has varied within the index. Diversification can help capture returns from multiple sources but does not ensure a profit or protect against loss.
It’s the classic road trip question, and over the past few years has doubled as the soundtrack of investing. Every bump in the pavement has investors tightening their seatbelts in anticipation of hitting the brakes. We’ve faced blaring recession warnings, predictions that the Magnificent 7 would skid out, concerns that tariffs would stall out the consumer, mounting deficit worries, calls for an imminent AI bubble pop, and speculation that the Fed’s independence was slipping. Through all of it, the same behavioral chorus kept echoing: surely this must be the end of the road.
Yet, time after time, the car kept rolling. Earnings held up, the consumer refused to let off the gas, and the economy proved far more resilient than expected. The view through the windshield looked foggy more often than clear, but every time the mist lifted, the journey was still underway, and somehow ahead of schedule.
Adding to the collective unease, risk assets didn’t just survive this period, they thrived. Equity markets pushed to new highs, credit remained durable, and valuations stretched to levels that made investors refresh the GPS wondering if we’d outrun the road. When prices rise this far and this fast, the instinct to ask “Are we there yet?” becomes almost reflexive - whether “there” means the top of the AI boom, the peak of valuations, the turn in consumer spending, or the moment when fiscal sustainability begins to fracture.
This question is at the heart of the behavioral dynamic we see in markets today: investors aren’t asking “Are we there yet?” regarding a single topic, they’re asking it about everything. Some fear we’ve made it to our destination already. Others insist we’re miles past it and need to reroute. Most simply feel the pressure of a long, though scenic, ride and just want to know when a turn, any turn, is coming.
As we peer into 2026, the better question isn’t whether we’ve arrived, it’s which destinations are coming into view, and which remain further down the road. The trek ahead features shifting landmarks. These forces will shape the next phase of the journey, one where progress continues, but the scenery changes, and thoughtfully navigating the open road matters more than ever.
In our 2026 Market Outlook, we explore which concerns are genuinely approaching “there” status, which are still well down the road, and how investors can steer through a market that keeps moving forward even as the chants of “Are we there yet?” from the backseat grow ever louder. On behalf of Waterloo Capital, thank you for reading.
https://t.co/HxyocfgrGp
It seems you can’t look at the market, skim headlines, or frankly enjoy your holiday dinner without one topic consistently bubbling up. Leaning into that very intentional pun, the question at the center of the conversation is whether we’re living through an AI bubble and, if so, how close it may be to bursting.
Please enjoy the second theme release in our five-part series leading up to the release of Waterloo Capital's 2026 Annual Outlook.
https://t.co/fxIFAn1KZZ
Maybe it’s a word you remember from a college class, a CNBC segment, or from someone detailing why you shouldn’t put everything in one basket. Wherever you heard it, the last few years within equities made diversification feel more like a nice theory than a real-world advantage, mostly because the weather never seemed to change. When one pocket of the market enjoys endless clear skies, the instinct is to stay outside and enjoy the sunshine rather than carry around rain gear.
Please enjoy the first theme release in our six-part series leading up to the release of Waterloo Capital’s 2026 Annual Outlook.
https://t.co/5r82oTBrUM
We are excited to announce that Waterloo Capital Family Office Services and Ironclad Strategies Consulting have integrated their service offerings under a unified platform headquartered in Austin, Texas.
Together, we will deliver a more comprehensive experience for families, entrepreneurs, and business owners seeking a single source for financial oversight, legacy planning, strategic advisory, and investment coordination.
This integration strengthens our ability to support clients with clarity, structure, and long term partnership.
Read the full announcement here: https://t.co/zuuDAp3Glr
Wow, 2025 has flown by! With 2026 around the corner, we’d love to connect with you for an end-of-year review. Let’s make sure your retirement plan is still aligned with your goals and continue building the retirement of your dreams.
Call us today at 512-777-5900.
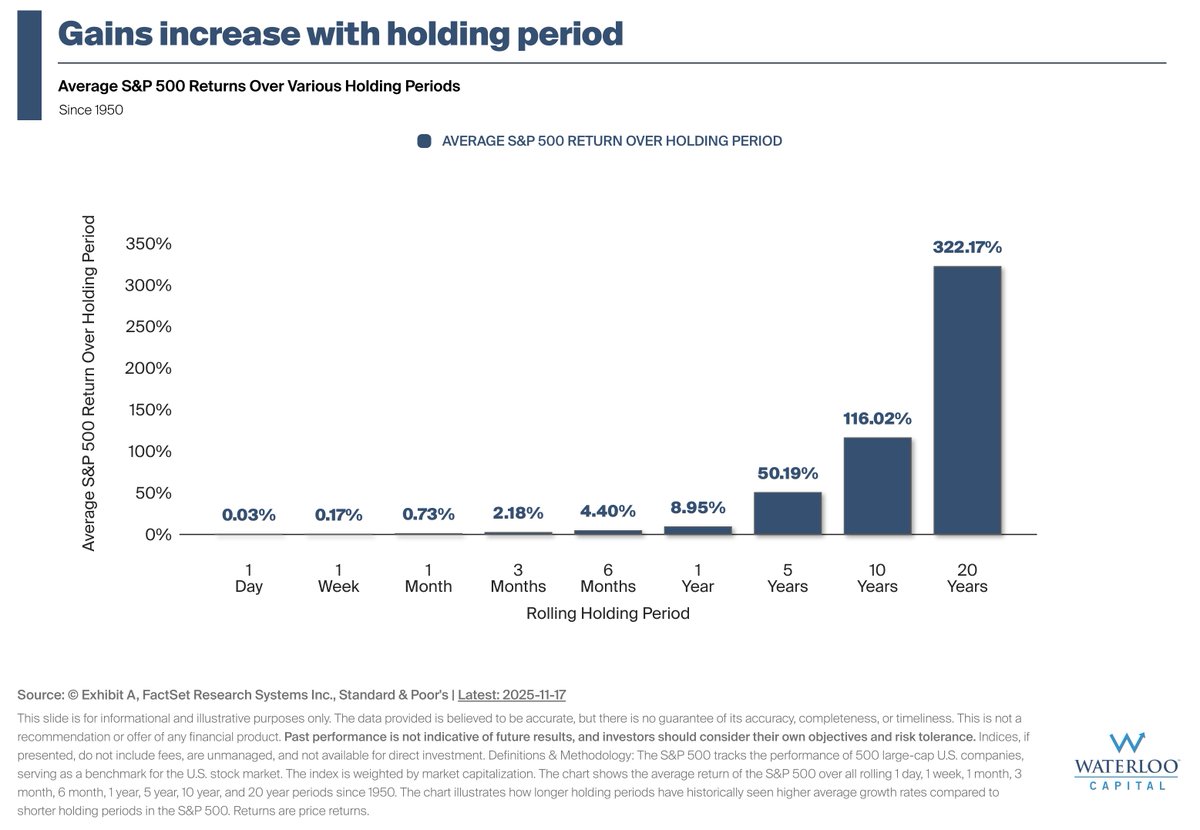
Historical Market Performance Patterns: S&P 500 data since 1950 demonstrates a clear pattern where extended timeframes have been associated with improved performance outcomes.
Strategic Role of Investment Duration: The length of time an investment is held appears to be a critical factor when developing portfolio strategies and setting expectations.
Investment Implications for Portfolio Planning: This data suggests that timeframe consideration should be a fundamental component of investment decision-making and client strategy discussions.
Measuring Market Resilience: The chart compares year-to-date returns across major equity categories for two scenarios: investors who held throughout 2025 versus those who sold during April's market panic.
A Look at the Recent Data: Investors who stayed the course have been rewarded in 2025, with all categories of equities generating strong returns relative to their drawdowns in mid April.
Investment Implications: The data underscores the stark difference in investment outcomes this year for those who sold at the April lows vs those who have stayed invested.