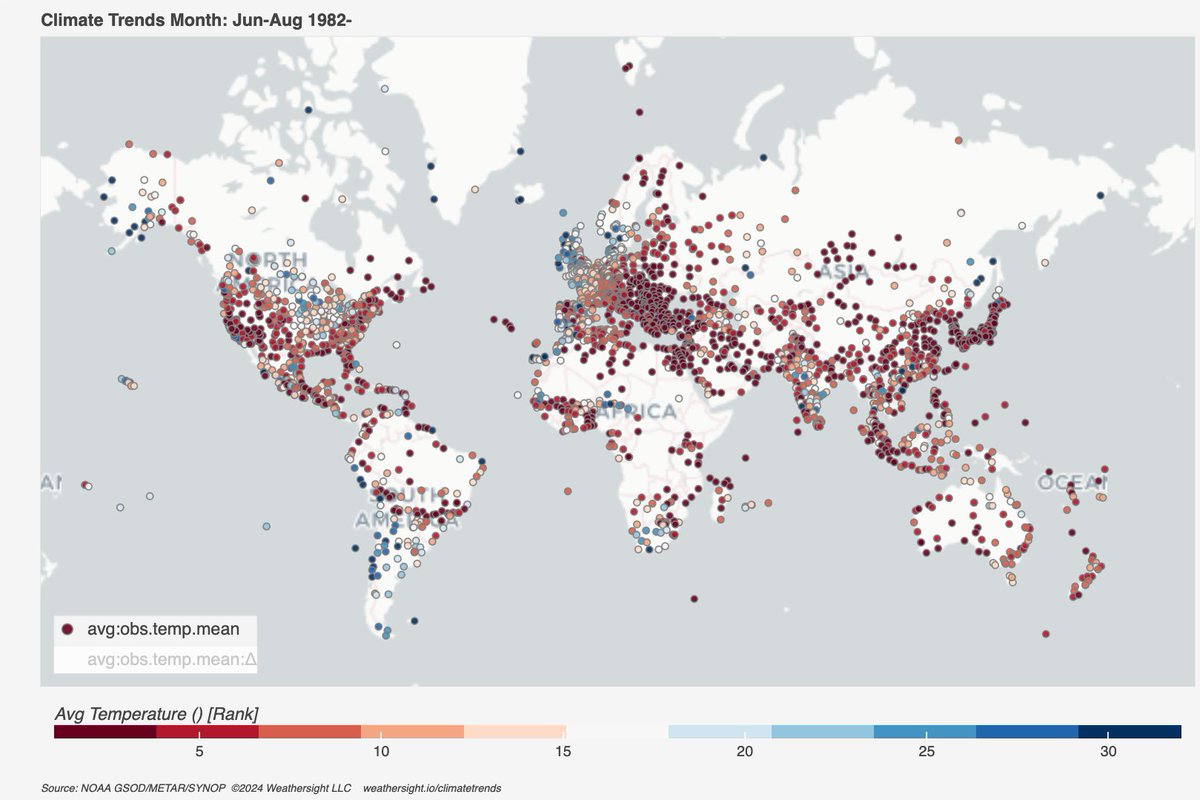
Jun-Aug 2024. Several locations recorded their top 3 hottest summers (or winters) in the past ~40 yrs (left). For many cities beside The Aegean and the Black Sea not only was it their hottest ever (right) , their mean temperature exceeded their previous highest by more than 1.0°C (see comments). 👇 #MediterraneanHeat
Our APIs are broad and are evolving rapidly to serve many niches. Our "bestplace" and "besttime" methods look at forecast and historical distributions of observed data to determine answers that match the criteria provided. #weatherevents#weatherapis
One of our original motivations was simply to make many global observational datasets more accessible and usable. Now, higher order operations on these datasets (e.g. find me heatwaves for X according my criteria) are available directly on Claude. Read about this and more. https://t.co/zWkyFpupyN #claude #mcp
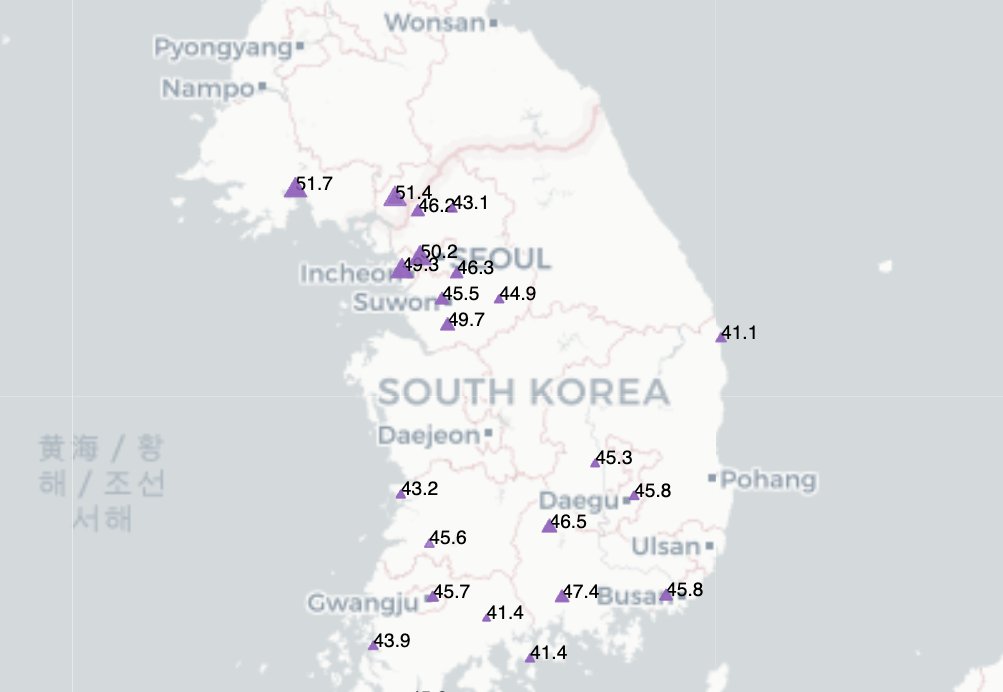
Korea Aug 04 2026. After breaking several heat records in the past few days, it is likely that it also broke several humid-heat records. Gimpo (just west of Seoul) recorded a heat index of 51°C (wet bulb of 31°C) after seeing over 14 days of extremely hot and humid conditions. #humidheat #korea
Lima, Peru. Jun 2026. Temperatures much above the normal everyday (especially Tmin) can only mean one thing - a strong El-Nino. It is clear from the mean temperature spikes that they all point to years of very strong El-Nino conditions for the world (the ensuing NH winter and spring). #lima #elnino
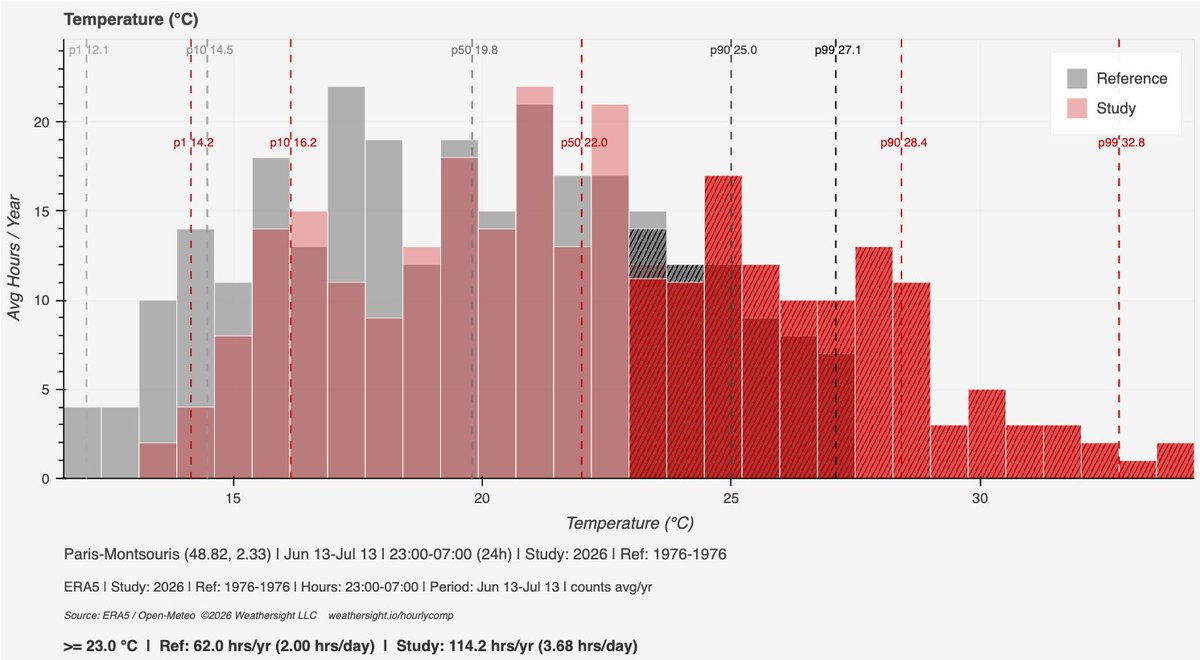
France. Summer 2026. A common observation is that this kind of heatwave has happened before - look at 1976. Analyzing hourly data from ERA5 (e.g. Paris grid) shows a couple of things. a) The 2026 heatwave had ~1.5x more hours >=30C during the day and ~1.8x more hours >= 23C at night (Fig 1 and 2, top row). b) The 2020's have seen ~4x the number of hours above same thresholds when compared to 1991-2020 epoch. #heatwave #paris 🧵
The qualifying criteria: p90 of Tmax , p90 of Tmin 0315-0615, 1981-2010. As usual, it is interactive: so try it for yourself with other baselines and criteria: https://t.co/POWDabMl06
Western India, May 2026. Many locations have endured a long heat-wave. High day temps (Tmax) occur in Mar/Oct as well but are accompanied by cooler nights. Heat in late April/May is unrelenting, hot days followed by muggy nights. Shown: Pune [Fig 1] and Panjim (Goa) [Fig 2] #pune #panjim #heatwave .🧵
If only IMD can make historical data accessible. I unearthed Bangalore's 1901-2000 monthly avgs (I had scraped years ago from IMD). Apr 2026 finished with mean Tmax of 35.2 C - 8th time since 2012! I was surprised to learn that 35C+ avg Apr/May were nearly as common 1906-1919 (8) and 1924-1931 (8). But they differed in a crucial aspect. 🧵 #bangalore #climate
Alaska and much of the US SW 2026. While the cold was quite not record-breaking (and definitely not as widespread) it has been as persistent in Fairbanks (Fig 1) as the record breaking heat, as in Phoenix (Fig 2). One way of understanding the persistence and severity is to plot their daily normalized deviation from mean. #uswx #swheat
The world 1975 onwards. We know the temperature trends vary across regions. But how? Normalized monthly trends (trend/inter annual variability) based on ERA5 dataset near population centers.
Mar 19-21 Sonora, Mexico. This early spring heatwave was not restricted to the US. Hermosillo recorded 43.5°C(~+2°C monthly record) and it's most intense 3-day heat streak in March (also > +2 °C). #springheat#sonora
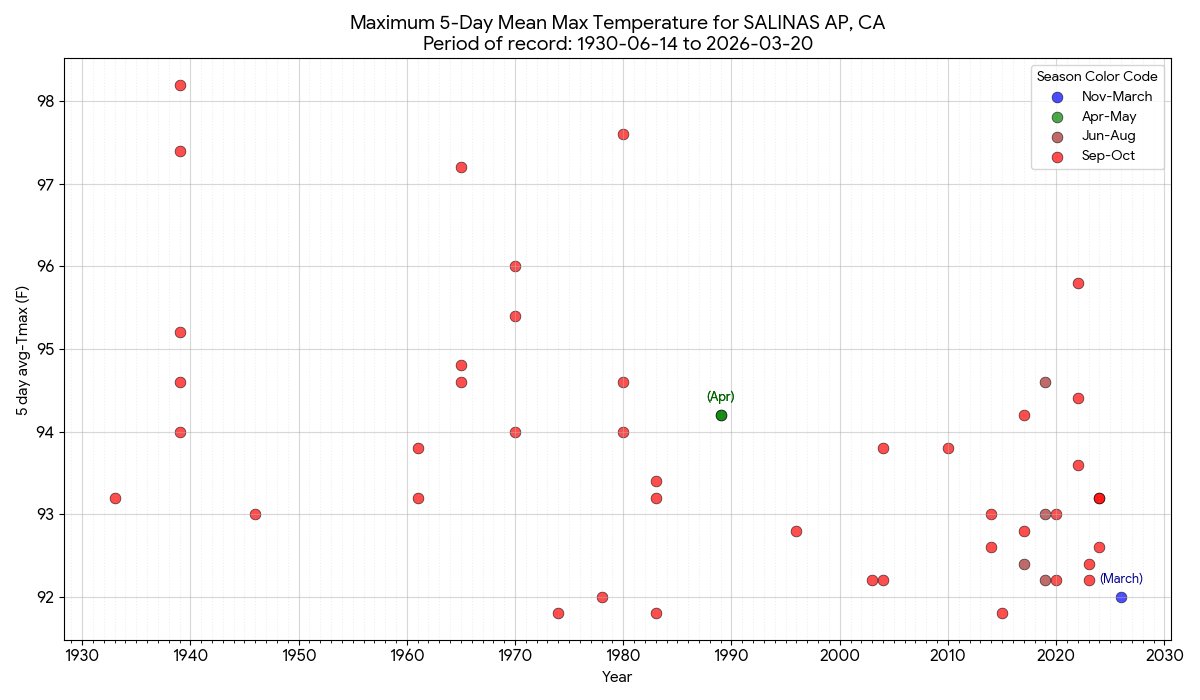
Much of the Bay Area (and most of the West US) endured a 5 day period of extraordinary heat in early spring, not seen since Apr 1989. Salinas, CA typically sees heat-waves in Sep-Oct, but Mar 16-20 2026 was among the top 50 heatwaves in the last 80 yrs - easily its earliest #salinas #springheat
Nuuk, Greenland Jan 2026. It was warmer than the previous warmest [1985] by 2.5°C and the only year where Tavg of Jan was above 0°C [Fig 2]. Many locations on the western coast of Greenland (and Baffin Bay) were > +7C from their '91-'20 normals. #nuuk
Western and Central India, Dec 2025. One of the coldest starts to winter cities like Mumbai and Pune are witnessing cold streaks that rank amongst the longest in December [Fig 1, 2]. But, Nagpur and Indore in the interior might be enduring one of their *longest* and *coldest* [Fig 3, 4] #indianwinter #ColdWave
Montana, Dec 17 2025. Wind gusts in numerous locations exceeded 100km/h (~62 mph). Helena Airport, recorded gusts of 129km/hr (80mph) [Fig 1]. The next two days will see strong gusts sweep across the continent [Fig 2]. How rare are such strong wind events?
In the Helena area, it appears to be a 1-in-30 yr event (Fig 3: to be verified), but our dataset does not have an example in the last 50yrs [Fig 4: https://t.co/o7GPjzCuos]. #wind




![weathersightio's tweet photo. Western India, May 2026. Many locations have endured a long heat-wave. High day temps (Tmax) occur in Mar/Oct as well but are accompanied by cooler nights. Heat in late April/May is unrelenting, hot days followed by muggy nights. Shown: Pune [Fig 1] and Panjim (Goa) [Fig 2] #pune #panjim #heatwave .🧵](https://pbs.twimg.com/media/HIUrCH5acAAhSom.jpg)
![weathersightio's tweet photo. Western India, May 2026. Many locations have endured a long heat-wave. High day temps (Tmax) occur in Mar/Oct as well but are accompanied by cooler nights. Heat in late April/May is unrelenting, hot days followed by muggy nights. Shown: Pune [Fig 1] and Panjim (Goa) [Fig 2] #pune #panjim #heatwave .🧵](https://pbs.twimg.com/media/HIUq9lPaAAAELEc.jpg)
![weathersightio's tweet photo. Western India, May 2026. Many locations have endured a long heat-wave. High day temps (Tmax) occur in Mar/Oct as well but are accompanied by cooler nights. Heat in late April/May is unrelenting, hot days followed by muggy nights. Shown: Pune [Fig 1] and Panjim (Goa) [Fig 2] #pune #panjim #heatwave .🧵](https://pbs.twimg.com/media/HIUq59RaQAAfW9k.jpg)


![weathersightio's tweet photo. Nuuk, Greenland Jan 2026. It was warmer than the previous warmest [1985] by 2.5°C and the only year where Tavg of Jan was above 0°C [Fig 2]. Many locations on the western coast of Greenland (and Baffin Bay) were > +7C from their '91-'20 normals. #nuuk https://t.co/qUVO4gXA4F](https://pbs.twimg.com/media/HBuLIv0aQAA9meP.jpg)
![weathersightio's tweet photo. Western and Central India, Dec 2025. One of the coldest starts to winter cities like Mumbai and Pune are witnessing cold streaks that rank amongst the longest in December [Fig 1, 2]. But, Nagpur and Indore in the interior might be enduring one of their *longest* and *coldest* [Fig 3, 4] #indianwinter #ColdWave](https://pbs.twimg.com/media/G8pIuKIbAAADKCW.jpg)
![weathersightio's tweet photo. Western and Central India, Dec 2025. One of the coldest starts to winter cities like Mumbai and Pune are witnessing cold streaks that rank amongst the longest in December [Fig 1, 2]. But, Nagpur and Indore in the interior might be enduring one of their *longest* and *coldest* [Fig 3, 4] #indianwinter #ColdWave](https://pbs.twimg.com/media/G8pIuKHbMAAmc3c.jpg)
![weathersightio's tweet photo. Western and Central India, Dec 2025. One of the coldest starts to winter cities like Mumbai and Pune are witnessing cold streaks that rank amongst the longest in December [Fig 1, 2]. But, Nagpur and Indore in the interior might be enduring one of their *longest* and *coldest* [Fig 3, 4] #indianwinter #ColdWave](https://pbs.twimg.com/media/G8pIuKEbMAM0ezE.jpg)
![weathersightio's tweet photo. Montana, Dec 17 2025. Wind gusts in numerous locations exceeded 100km/h (~62 mph). Helena Airport, recorded gusts of 129km/hr (80mph) [Fig 1]. The next two days will see strong gusts sweep across the continent [Fig 2]. How rare are such strong wind events?
In the Helena area, it appears to be a 1-in-30 yr event (Fig 3: to be verified), but our dataset does not have an example in the last 50yrs [Fig 4: https://t.co/o7GPjzCuos]. #wind](https://pbs.twimg.com/media/G8a8wtqaMAAq_qv.jpg)
![weathersightio's tweet photo. Montana, Dec 17 2025. Wind gusts in numerous locations exceeded 100km/h (~62 mph). Helena Airport, recorded gusts of 129km/hr (80mph) [Fig 1]. The next two days will see strong gusts sweep across the continent [Fig 2]. How rare are such strong wind events?
In the Helena area, it appears to be a 1-in-30 yr event (Fig 3: to be verified), but our dataset does not have an example in the last 50yrs [Fig 4: https://t.co/o7GPjzCuos]. #wind](https://pbs.twimg.com/media/G8a5OSkaoAAEhFA.jpg)
![weathersightio's tweet photo. Montana, Dec 17 2025. Wind gusts in numerous locations exceeded 100km/h (~62 mph). Helena Airport, recorded gusts of 129km/hr (80mph) [Fig 1]. The next two days will see strong gusts sweep across the continent [Fig 2]. How rare are such strong wind events?
In the Helena area, it appears to be a 1-in-30 yr event (Fig 3: to be verified), but our dataset does not have an example in the last 50yrs [Fig 4: https://t.co/o7GPjzCuos]. #wind](https://pbs.twimg.com/media/G8a5OSfakAEvz52.jpg)







![weathersightio's tweet photo. Western India, May 2026. Many locations have endured a long heat-wave. High day temps (Tmax) occur in Mar/Oct as well but are accompanied by cooler nights. Heat in late April/May is unrelenting, hot days followed by muggy nights. Shown: Pune [Fig 1] and Panjim (Goa) [Fig 2] #pune #panjim #heatwave .🧵](https://pbs.twimg.com/media/HIUrEHqa4AAiIqc.jpg)


![weathersightio's tweet photo. Nuuk, Greenland Jan 2026. It was warmer than the previous warmest [1985] by 2.5°C and the only year where Tavg of Jan was above 0°C [Fig 2]. Many locations on the western coast of Greenland (and Baffin Bay) were > +7C from their '91-'20 normals. #nuuk https://t.co/qUVO4gXA4F](https://pbs.twimg.com/media/HBuLKy-acAAoB-u.jpg)
![weathersightio's tweet photo. Western and Central India, Dec 2025. One of the coldest starts to winter cities like Mumbai and Pune are witnessing cold streaks that rank amongst the longest in December [Fig 1, 2]. But, Nagpur and Indore in the interior might be enduring one of their *longest* and *coldest* [Fig 3, 4] #indianwinter #ColdWave](https://pbs.twimg.com/media/G8pIuKIbQAA8OSi.jpg)
![weathersightio's tweet photo. Montana, Dec 17 2025. Wind gusts in numerous locations exceeded 100km/h (~62 mph). Helena Airport, recorded gusts of 129km/hr (80mph) [Fig 1]. The next two days will see strong gusts sweep across the continent [Fig 2]. How rare are such strong wind events?
In the Helena area, it appears to be a 1-in-30 yr event (Fig 3: to be verified), but our dataset does not have an example in the last 50yrs [Fig 4: https://t.co/o7GPjzCuos]. #wind](https://pbs.twimg.com/media/G8a9S8qakAMRPPl.jpg)


