Data is everywhere, but most people don’t know how to read it.
I’m learning and sharing data concepts in the simplest form possible charts, patterns, basic analysis, and how numbers explain everyday life.
Follow If you’re new to data or want to understand it without the jargon.
DAY 16/90 | My Data Analysis Journey 📊
Would you trust a sales report with missing information?
Today, I learned how to identify missing values and investigate duplicate records in Excel.
One key lesson: Two identical records don’t automatically mean one should
#DataAnalytics
For data analysts: When evaluating business performance, would you prioritise total profit or profit margin? Why?
I’m learning in public and growing one day at a time.
#90DaysOfDataAnalysis#DataAnalytics
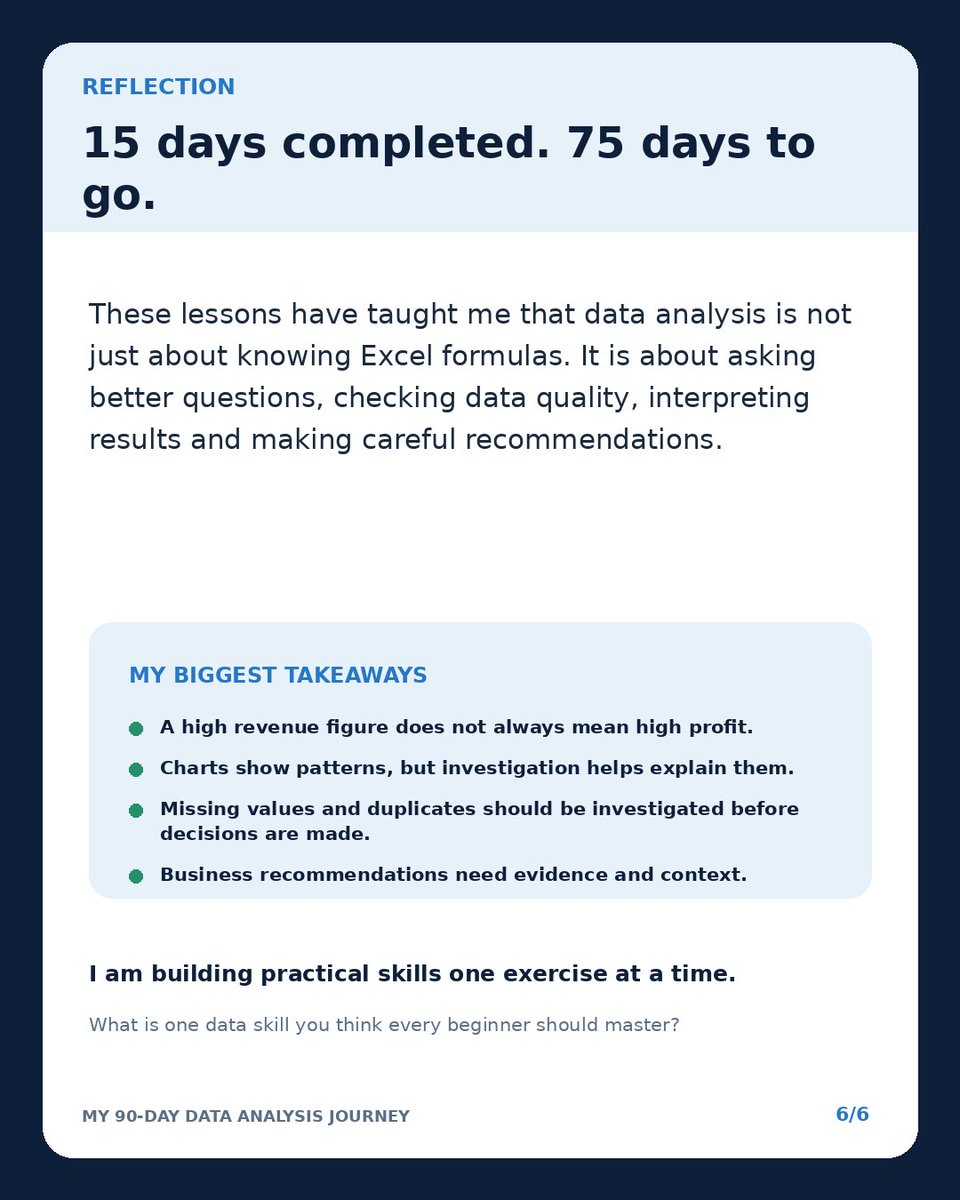
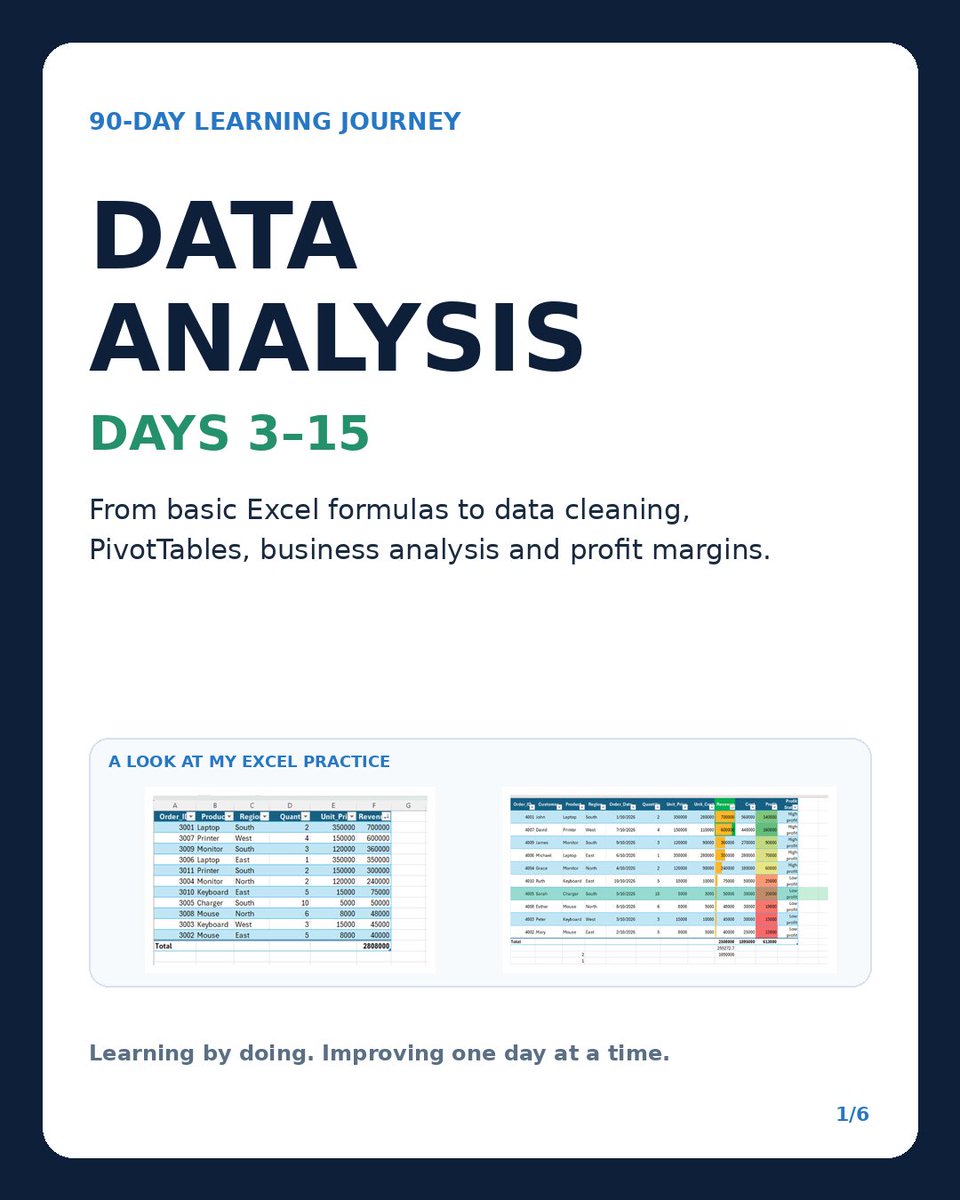
FROM LEARNING EXCEL FORMULAS TO THINKING LIKE A DATA ANALYST
I’m 15 days into my 90-day Data Analysis Journey, and one thing is becoming clear:
Data analysis is more than knowing Excel formulas. It’s about understanding data
Here’s what I’ve learned so far. 🧵
MY BIGGEST TAKEAWAY
Data analysis is about asking the right questions, ensuring data quality, interpreting results and making evidence-based decisions.
15 DAYS COMPLETED. 75 DAYS TO GO! 📊
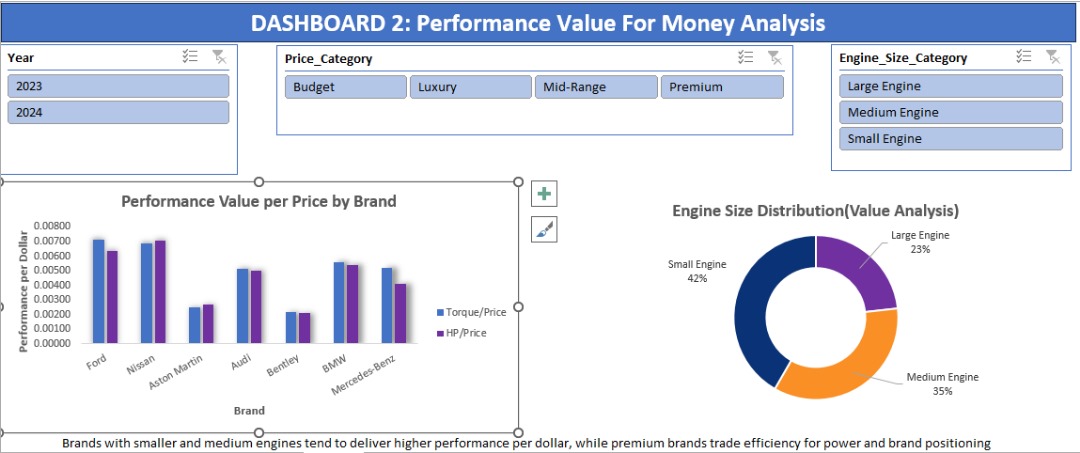
A few weeks ago, I started exploring an automotive dataset that was messy and inconsistent.
After cleaning the data and engineering new features, I built Dashboard 2 in Excel to answer a different question:
This makes it possible to compare brands on efficiency, not just scale all powered by pivot tables, charts, and slicers in Excel.
This project reinforced something important for me:
Analytics isn’t about fancy charts
Free courses to take in 2025
Google Data Analytics
https://t.co/nXpXcsW2eX
IBM Data Science
https://t.co/75x3yCRWjy
Google IT Support
https://t.co/ttykQnnUTa
Meta Frontend Developer
https://t.co/uteimb5RWw