Clinical Anaesthesiologist | MD, DrAnaes&CritCare, FCAI, ESRA-DRA, EACVI Adult TOE, Fellowship in Cardiothoracic & Vascular Anaesthesia and Intensive Care, AM
Flynn et al present a case of Guillain-Barré syndrome and discuss how processed EEG can be inaccurate in measuring the conscious state.
https://t.co/t5iXxp9X8B
Another paper on sugammadex v neostigmine!
This one looks at the risk of postoperative pulmonary complications after upper gastrointestinal endoscopic procedures.
#anaesthesia#MedTwitter
https://t.co/zMQNHJLZzj
Central Venous Pressure Revisited: Physiology, Pitfalls, Misconceptions, and Modern Clinical Interpretation in Critical Care
CCR Journal Watch
https://t.co/Sp06oA6IDG
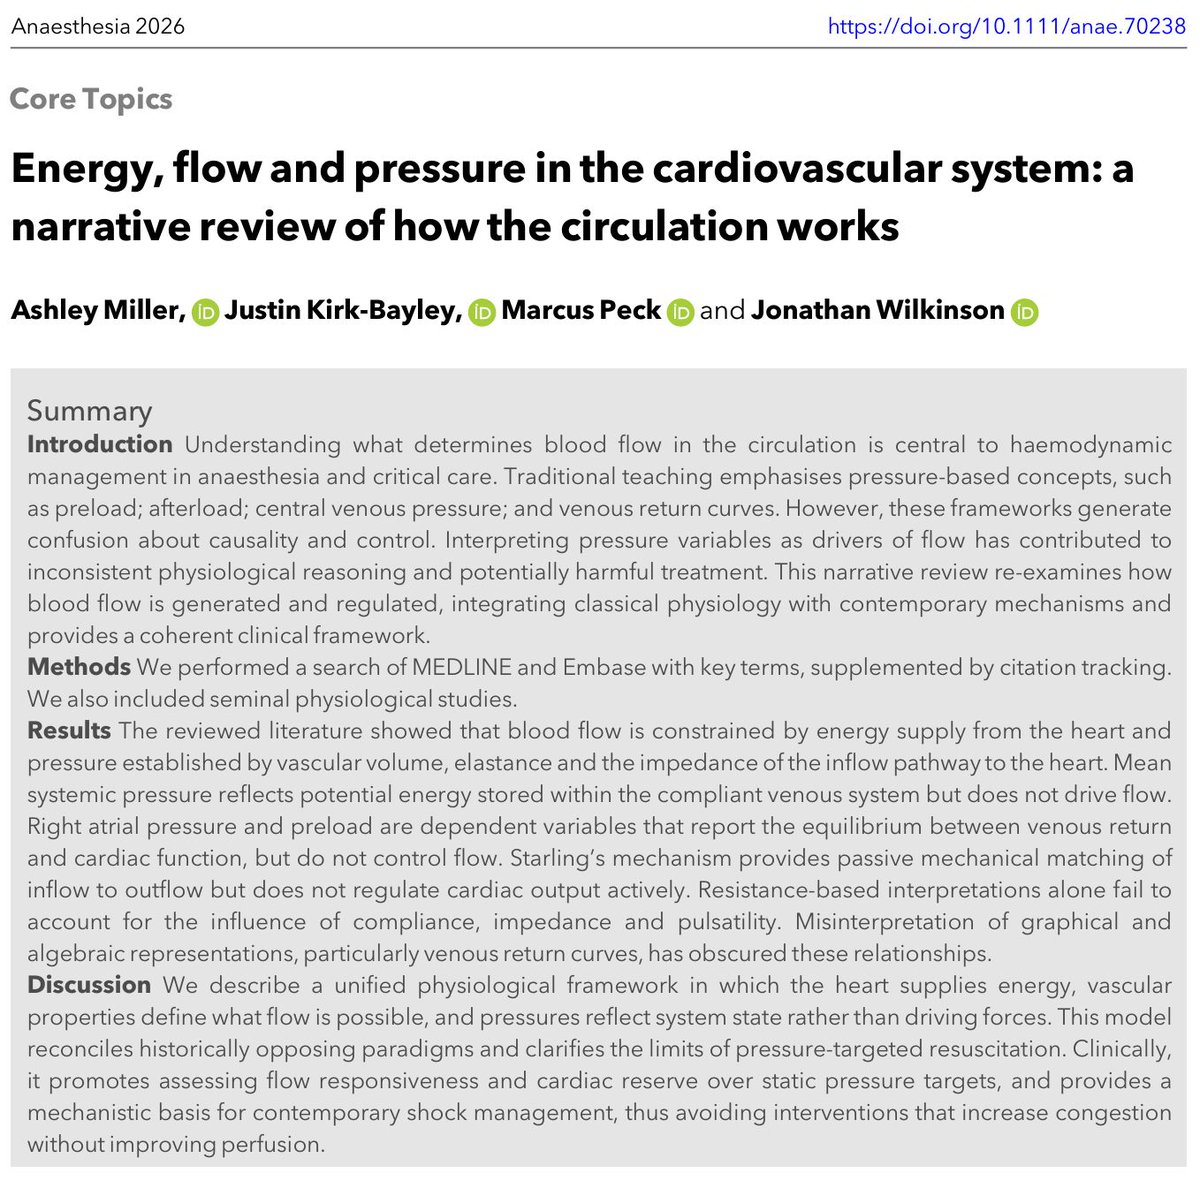
Haemodynamic equations are useful. But they also mislead.
Take:
CO = HR × SV
CO ≈ (MAP − RAP) / SVR
Both are mathematically true. But they can make the variables they contain look like the controllers of output.
Often they are not.
In the intact circulation, these equations describe the resolved state of the system. They do not, by themselves, tell you what is supplying energy, what is constraining flow, or what is actually limiting output.
That is one of the central themes of our review:
Energy, flow and pressure in the cardiovascular system: a narrative review of how the circulation works.
https://t.co/L19bsDCzr6
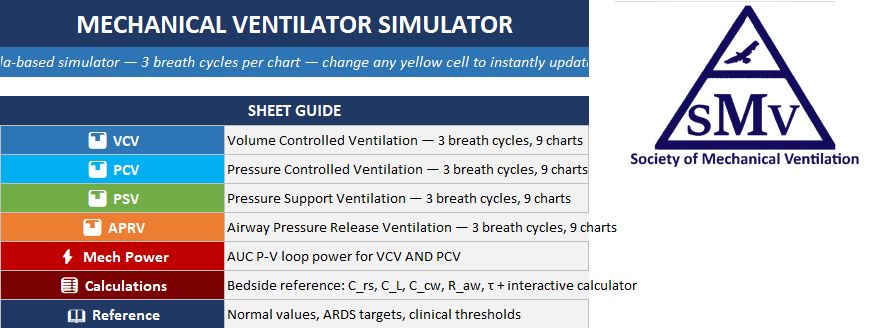
We are excited to share a mechanical ventilator simulator built in Excel! It models VC, PC, PS, APRV, and SIMV ventilation with real-time waveforms for airway pressure, flow, volume, esophageal pressure, transpulmonary pressure, and alveolar pressure.
https://t.co/Dw4u64UF8E
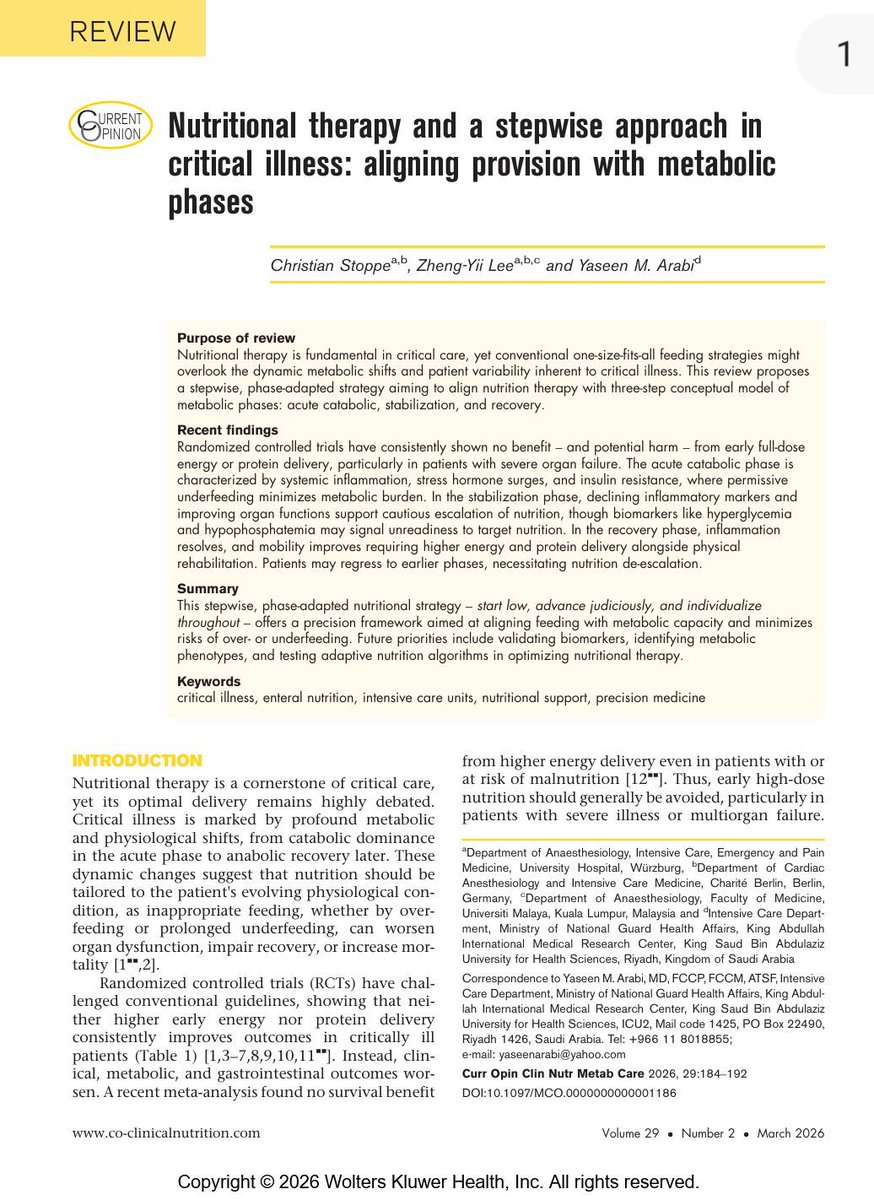
🍽️ ICU nutrition: we’ve been doing it wrong for years?
More calories
More protein
Earlier feeding
Sounds logical
But physiology disagrees
⚠️ The key update
High-quality RCTs now show:
❌ Early full-dose nutrition
→ NO benefit
→ Potential harm
Especially in:
• Shock
• Multiorgan failure
• High metabolic stress
👉 This is not neutral
👉 This is dangerous practice
🧠 Critical illness is not static
It evolves through metabolic phases:
1. Acute catabolic phase
2. Stabilization phase
3. Recovery phase
👉 Feeding must follow physiology
Not protocols
🔥 Phase 1: Acute catabolic
• High inflammation
• Insulin resistance
• Endogenous substrate mobilization
👉 The body is NOT ready for full nutrition
💡 Strategy:
✔️ Permissive underfeeding
✔️ Low protein
Why?
Because early overload leads to:
• Hyperglycemia
• Hepatic dysfunction
• Renal stress
• Impaired autophagy
👉 You are feeding dysfunction, not recovery
⚖️ Phase 2: Stabilization
• Inflammation decreasing
• Organ function improving
👉 Now metabolism starts to tolerate nutrition
💡 Strategy:
✔️ Slow escalation
✔️ Daily reassessment
⚠️ Red flags:
• Hypophosphatemia
• Hyperglycemia
→ Patient is NOT ready
💪 Phase 3: Recovery
• Anabolism returns
• Mobility improves
👉 NOW nutrition matters most
💡 Strategy:
✔️ Higher calories
✔️ Higher protein
✔️ Combine with rehab
👉 This is where you rebuild muscle and function
📊 The real takeaway
Nutrition is NOT:
❌ A fixed prescription
❌ A calorie target
It is:
✔️ A dynamic therapy
✔️ A metabolic intervention
🎯 The new principle
“Start low
Advance judiciously
Individualize throughout”
👉 Precision ICU nutrition
⚠️ Final thought
Overfeeding early harms
Underfeeding late harms
👉 Timing is everything
📚 Stoppe C et al. Curr Opin Clin Nutr Metab Care 2026
DOI: 10.1097/MCO.0000000000001186
🩺 Arterial line ≠ just a number on the monitor
If you’re only looking at MAP…
you’re missing most of the physiology.
🧠 Invasive BP is a real-time hemodynamic language
Every component tells a different story:
▪️ MAP → organ perfusion
▪️ DAP → vascular tone
▪️ SAP → LV afterload
▪️ Pulse Pressure (PP) → stroke volume surrogate
➡️ It’s not one number.
It’s a dynamic physiological system
⚠️ First rule, often ignored:
👉 If the waveform is wrong → everything is wrong
Before interpreting:
✔️ Check damping
✔️ Perform fast flush test
✔️ Look for:
Rapid upstroke
Dicrotic notch
Smooth diastolic decay
➡️ Bad waveform = bad decisions
📉 MAP alone is NOT enough
We target MAP ≥65 mmHg…
but:
▪️ Duration of hypotension matters
▪️ Individual physiology matters
▪️ CVP matters
👉 Think instead:
🎯 Perfusion pressure = MAP − CVP (MPP)
➡️ A “normal MAP” can still mean hypoperfusion
🔥 DAP = your vasopressor trigger
Low DAP = low vascular tone
▪️ Septic shock → ↓ DAP
▪️ Early signal before MAP collapses
👉 Use it to:
✔️ Start norepinephrine earlier
✔️ Avoid delayed vasopressor therapy
➡️ It’s one of the most underused variables in ICU
⚡ Pulse Pressure = hidden CO monitor
PP reflects:
▪️ Stroke volume
▪️ Arterial stiffness
👉 Dynamic changes = key:
✔️ PLR
✔️ Fluid challenge
✔️ Ventilator cycles (PPV)
➡️ You can track CO trends without a CO monitor
🧬 Next-level physiology (very underrated):
New indices:
▪️ DSI = HR / DAP
→ identifies vasoplegia early
▪️ VNERi = DAP / (HR × NE dose)
→ detects norepinephrine resistance
👉 These may define who needs vasopressin early
💡 Mindset shift
Don’t ask:
❌ “What’s the MAP?”
Ask:
✔️ “What is the physiology behind this waveform?”
🧠 Take-home
Arterial line monitoring is not passive.
It’s:
▪️ Diagnostic
▪️ Therapeutic
▪️ Predictive
➡️ If you read it correctly…
it becomes a precision resuscitation tool
📚 Bertrand M et al. (2025)Annals of Intensive Care
DOI: 10.1186/s13613-025-01608-y
How to do mitral valve with 3D #echofirst
Always starting with good 2D and think #ALAMO
👉Annulus within 2D Datablock
👉Leaflet within 2D Datablock
👉(no) Artifacts within 2D Datablock
👉Movement of leaflets with data block
👉Orientation (Landmarks)
#3DEchoBerlin
These guys administered rocuronium, then sugammadex, then the patient developed severe anaphylaxis unresponsive to usual therapies, was in extremis, so they treated the patient with another dose of rocuronium.
https://t.co/2q6E1YLMxv
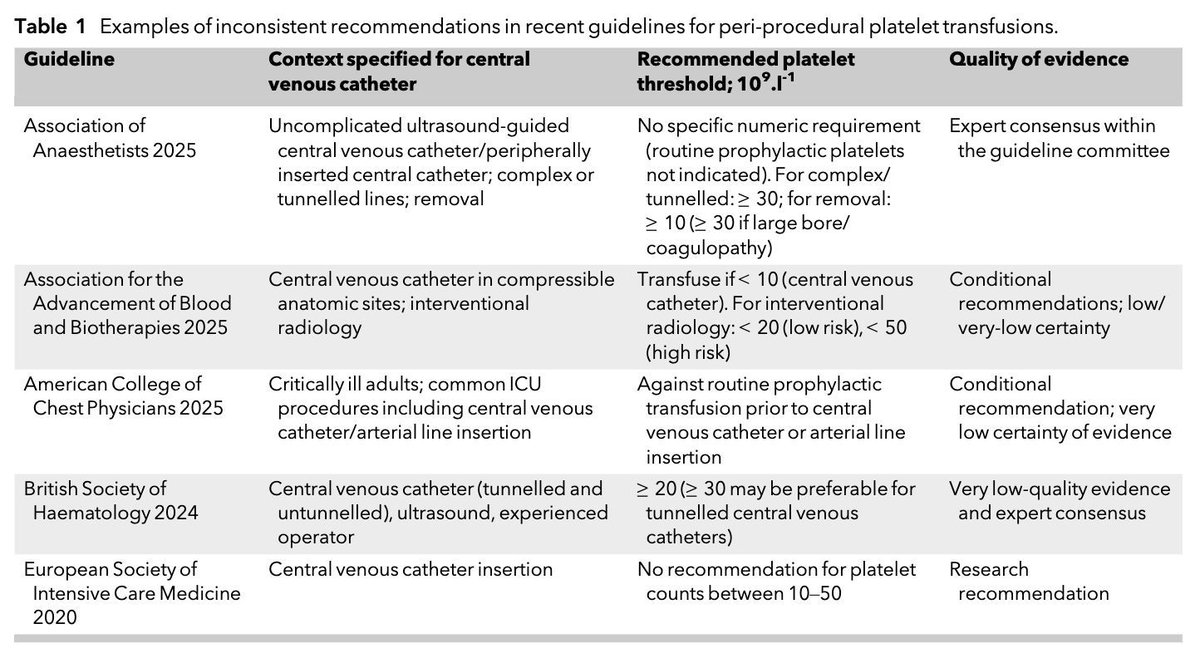
What is your platelet threshold for vascular access?
There are inconsistent recommendations in recent guidelines for peri-procedural platelet transfusions and a lack of robust clinical evidence to underpin the strength of any recommendations.
#anaesthesia#MedTwitter
https://t.co/tBqJW6PzzK
🎉 It’s here!
Baby Blocks has launched the ONLY local anesthetic calculator that tracks cumulative toxicity — 100% FREE. FOREVER.
Calculate dosing for your LA cocktail including adjuvants.
Check it out: https://t.co/23Jv2E5WMw
#pedspain#pedsanes#anesthesiology#anesthesia
Understanding exercise intensity zones and physiological stress
This chart integrates sport science and exercise physiology terminology to explain how intensity, effort perception, and physiological stress align across different training zones. It bridges objective markers such as VO₂max and metabolic thresholds with subjective effort scales used in training and research.
1️⃣ Intensity continuum
Exercise intensity progresses from very low (sleep or inactivity) to very high (near-maximal effort). As workload increases, oxygen consumption (VO₂), heart rate, and perceived exertion rise along a continuous physiological gradient.
🟢 Example: Zone 1 (very light to light) corresponds to low heart rates and minimal lactate accumulation, supporting recovery and aerobic base development.
2️⃣ Metabolic thresholds
Two key thresholds define transitions between metabolic states.
Threshold 1 (LT1): the point where lactate begins to accumulate, marking the shift from easy to steady aerobic work.
Threshold 2 (LT2): the onset of significant lactate accumulation and a transition toward anaerobic metabolism.
🟢 Example: Training just below LT2 (“tempo” or Zone 3) improves endurance efficiency and lactate clearance.
3️⃣ Zone classification
Sport science often divides effort into five zones (Z1–Z5):
Z1–Z2: aerobic, low stress, used for long-duration or recovery work.
Z3: tempo or steady-state, moderate stress.
Z4: threshold, high stress near VO₂max.
Z5: supramaximal, brief, maximal exertion (HIIT, sprint intervals).
🟢 Example: Zone 5 training elicits rapid VO₂ kinetics and enhances anaerobic capacity but requires longer recovery.
4️⃣ Subjective perception (RPE and OMNI scales)
The Rate of Perceived Exertion (RPE) correlates closely with physiological strain. Moderate efforts feel “somewhat hard” (RPE 12–14), while near-maximal work rates (RPE 18–20) reflect lactate saturation and cardiovascular limits.
🟢 Example: Using RPE alongside heart rate helps athletes gauge training stress during environmental or fatigue-related variability.
5️⃣ Applied context
Understanding where intensity lies along the stress continuum informs training prescription, recovery management, and adaptation.
🟢 Example: Endurance programs often allocate ~80% of volume to low-intensity zones (Z1–Z2) and 20% to high-intensity zones (Z4–Z5) for optimal performance and resilience.
This framework connects metabolic physiology with subjective effort, helping athletes and practitioners quantify training load, manage fatigue, and optimize long-term adaptation.
https://t.co/GV8kAGEkwP