$BTC Final overview:
The movement of the Bitcoin price seems to follow a recurring fractal pattern. Structures that first form on smaller time intervals gradually expand and reappear on larger time intervals, maintaining the same market character.
Instead of focusing solely on price targets, this model examines the behavior of accumulation, expansion, distribution, and correction. The same sequence has been repeated multiple times throughout the history of Bitcoin, with each cycle unfolding on a larger scale than the previous one.
If this fractal continues to develop, then the current market may still be following a plan set by earlier structures, which suggests that larger-scale phases of correction and re-accumulation may occur before the next long-term expansion cycle begins.
As a result, my long-term re-accumulation targets remain below $19,000, with key zones at $15,400, and $11,700. These levels remain valid unless the market proves otherwise.
$HYPE Update — Short Setup Still Active
Our HYPE short setup remains active, and price is now moving back toward our original $72 (77$)sell zone.
Despite the recent strength, I still view this as a relief rally, not the start of a new macro uptrend. The current structure continues to suggest that this rally is a corrective move before the next major bearish leg.
Sell Setup:
• Sell zone: $72-(77)
• Wait for rejection and confirmation before entering.
• Avoid chasing momentum above the range without confirmation.
Bearish outlook:
If this structure plays out, I expect the relief rally to complete inside the sell zone, followed by a deeper correction toward the $41–47 re-accumulation area, where a stronger long-term foundation could develop.
$NEAR Sell Setup:
The current structure still suggests that this move is a relief rally, not the beginning of a new bull market.
•Sell Zone: $2.40 – $2.50
This area aligns with major resistance and is where I’m expecting the rally to lose momentum. As long as price remains below a confirmed breakout, I see this as an opportunity to reduce exposure or look for short setups rather than chase the upside.
If this scenario plays out, the next leg lower could mark the beginning of Phase 2 of the broader correction, with an initial target around $1.60, followed by a much deeper reset over the coming years.
The long-term roadmap still points to a final accumulation zone around $0.33–0.40, where the larger bearish cycle may come to an end before the next major bull phase begins.
$SYN / USDT – Sell Setup
The current rally looks more like a relief rally within a larger bearish structure than the start of a new bull market.
As long as price remains below the major resistance zone, I expect this move to be temporary before the next leg lower begins.
•Sell Zone: $0.45 – $0.50
•Mid-term Targets:
• $0.077
• $0.046
This structure still suggests that the broader correction is incomplete. A push into the sell zone could trap late buyers before bearish momentum resumes.
$BONK Buy & Sell Setup
BONK appears to be forming a relief rally within a much larger bearish structure. While short-term upside is possible, the current move should not be mistaken for the start of a new bull market. The broader trend still points toward a major bearish continuation.
•Buy Zone: 0.00000400 – 0.00000437
Target 0.00000970-0.00001180$
•Sell Zone: 0.00000970 – 0.00001180
Target 0.00000400-0.00000350-0.00000280$
The expectation is for price to rally into the highlighted sell range before the larger corrective trend resumes. If this fractal continues to play out, the relief rally could provide one of the best opportunities to reduce risk before another significant downside move.
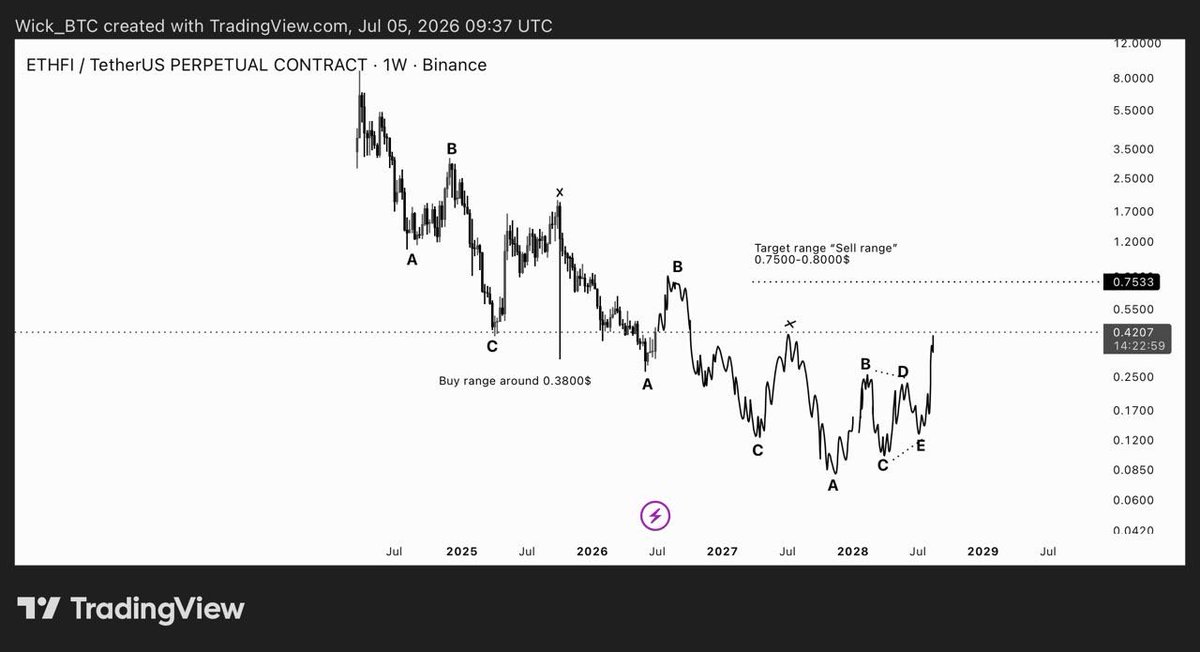
$ETHFI Buy & Sell Setup
The current rally looks like a relief rally, not the beginning of a new bullish cycle. As long as this structure remains valid, the expectation is for price to push into the highlighted resistance before the larger bearish trend resumes.
•Buy Zone: Around $0.38 (for the relief rally).
Target : 0,75-0.80$
Sell Zone: $0.75–$0.80.
Target 0.3800-0.2810$
This move is expected to be a temporary recovery, offering a potential exit opportunity before the next major leg down. If the fractal continues to play out, the market could resume its bearish continuation after reaching the target range.
$BTC buy & Sell setups ( Mid-term)
Current structure suggests a potential relief rally before the next leg down. As long as Bitcoin holds the $58.5K–$60K support zone, a short-term bounce toward the $65K–$66K resistance area remains possible.
•Buy Zone: $58,500 – $60,000
•Target: $65,000 – $66,000
Once price reaches the sell range, I expect the rally to exhaust and form an ABC corrective structure, opening the door for a deeper decline.
•Sell Zone: $65,000 – $66,000
•Downside Target: ~$53,000
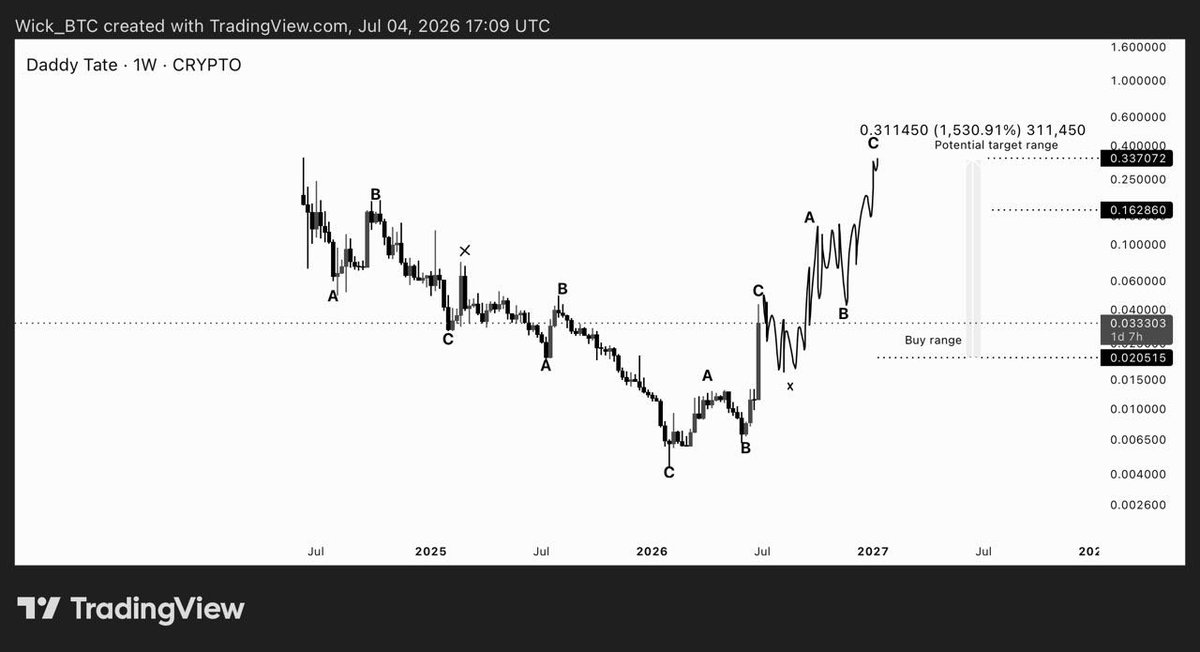
$DADDY
One of the most interesting setups on my watchlist.
The chart is shaping up for a potential breakout into new ATHs if momentum continues to build.
If the setup plays out, the upside could be massive.
@Cobratate
$DADDY
One of the most interesting setups on my watchlist.
The chart is shaping up for a potential breakout into new ATHs if momentum continues to build.
If the setup plays out, the upside could be massive.
@Cobratate
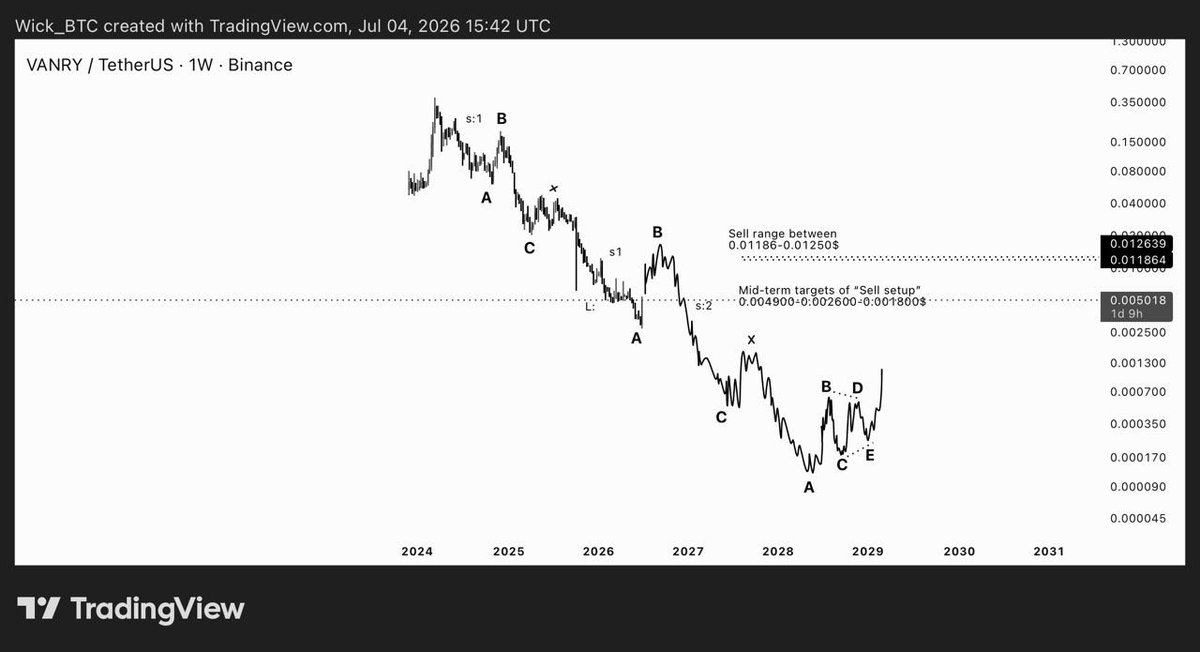
$VANRY Mid-Term Sell Setup
The current recovery looks like nothing more than a relief rally within the broader bearish structure. Unless price invalidates the count, I’m expecting this bounce to complete before the next impulsive leg lower begins.
•Sell Range: $0.01186 – $0.01250
•Mid-Term Targets:
• $0.00490
• $0.00260
• $0.00180
The larger bearish wave structure still appears incomplete. This rally is expected to be a temporary correction rather than the start of a new bull trend. If the projected wave count remains valid, the next bearish phase should follow after the relief rally reaches the sell zone.
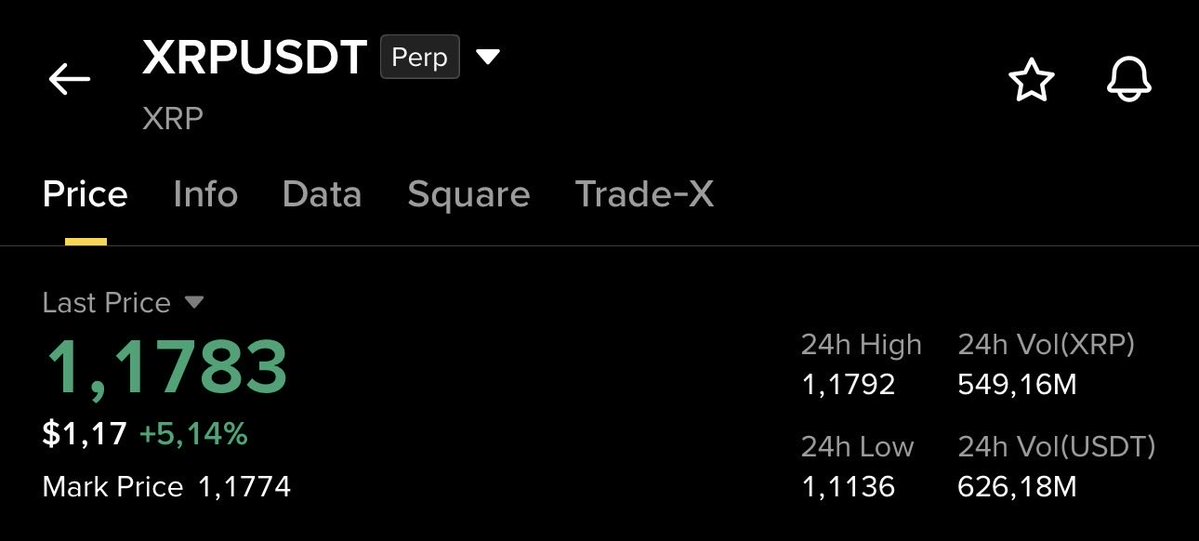
$XRP Buy & Sell Setups (Mid-term)
Current structure suggests a potential relief rally before the next corrective leg. As long as XRP holds the $1.00–$1.04 support zone, a short-term move toward the $1.18–$1.22 resistance area remains likely.
• Buy Zone: $1.00 – $1.04
• Target: $1.18 – $1.22
Once price reaches the sell range, I expect the rally to lose momentum and complete an ABC corrective structure, increasing the probability of another decline.
• Sell Zone: $1.18 – $1.22
• Downside Target: ~$0.88
$WIF Buy & Sell Setups (Mid-Term)
Current market structure suggests the ongoing bearish phase is approaching a key accumulation area before a potential relief rally. As long as price holds the $0.1300-1400$ support zone, a recovery toward the $0.43–$0.50 resistance area remains the preferred scenario.
• Buy Zone: $0.1530 – $0.1700
• Target: $0.43 – $0.50
Once price reaches the target zone, I expect the relief rally to lose momentum and complete an ABC corrective structure, setting up the next major bearish continuation.
• Sell Zone: $0.43 – $0.50
• Downside Target: $0.1300$
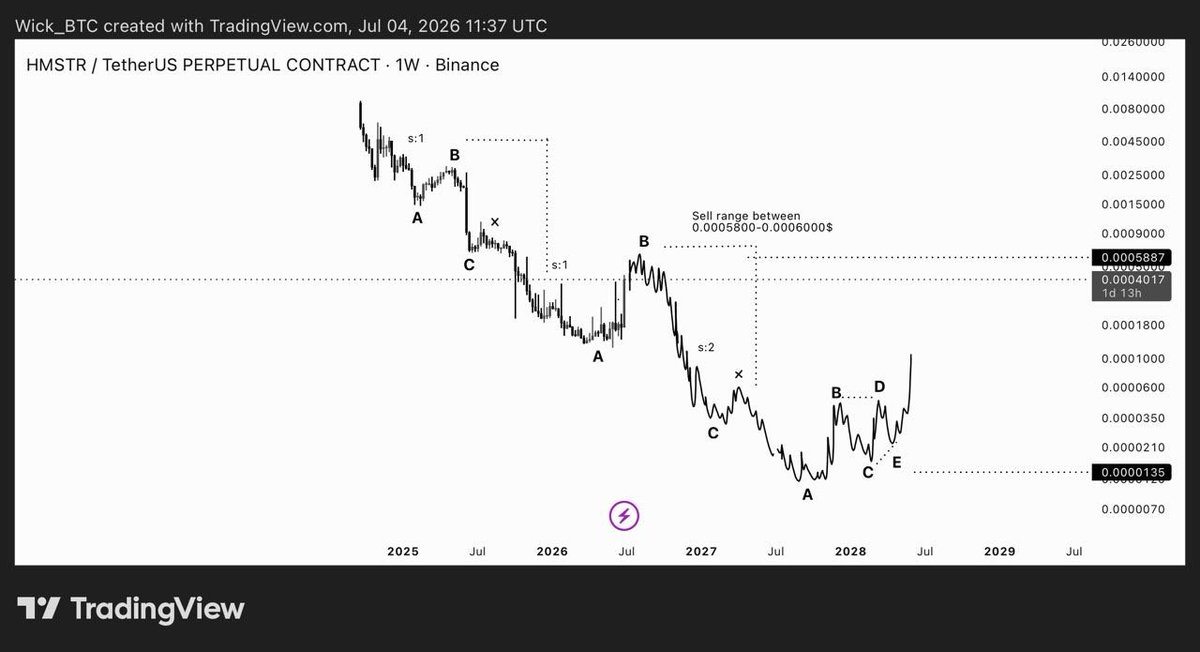
$HMSTR Mid-Term Sell Setup
The current upside move is expected to be a relief rally within the broader bearish structure. As long as the overall wave count remains valid, I’m treating this rally as an opportunity to position for the next leg lower rather than the start of a new bull trend.
•Sell Zone: $0.0005800 – $0.0006000
Plan:
Wait for price to reach the sell range.
Look for rejection and signs of exhaustion before entering a short.
This rally is expected to be temporary, followed by a continuation of the larger bearish trend.
Targets:
TP1: Previous local lows.
TP2: Around $0.00021 support.
TP3: New cycle lows below the current bottom if bearish momentum continues.
$GRAM/USDT — Sell Setup
The current rally is still unfolding and hasn’t entered its final bullish phase yet. I expect further upside as the corrective structure continues to develop before the major bearish continuation begins.
•Sell Zone: $2.35 – $2.40
Wait for price to reach the sell zone and form a clear rejection before considering a short position.
•Initial Bearish Target: $1.65
This is expected to be the first major bearish leg, with the overall structure likely remaining bearish after relief rallies. Until then, I remain focused on the $2.35–2.40 area as the preferred short-entry zone.
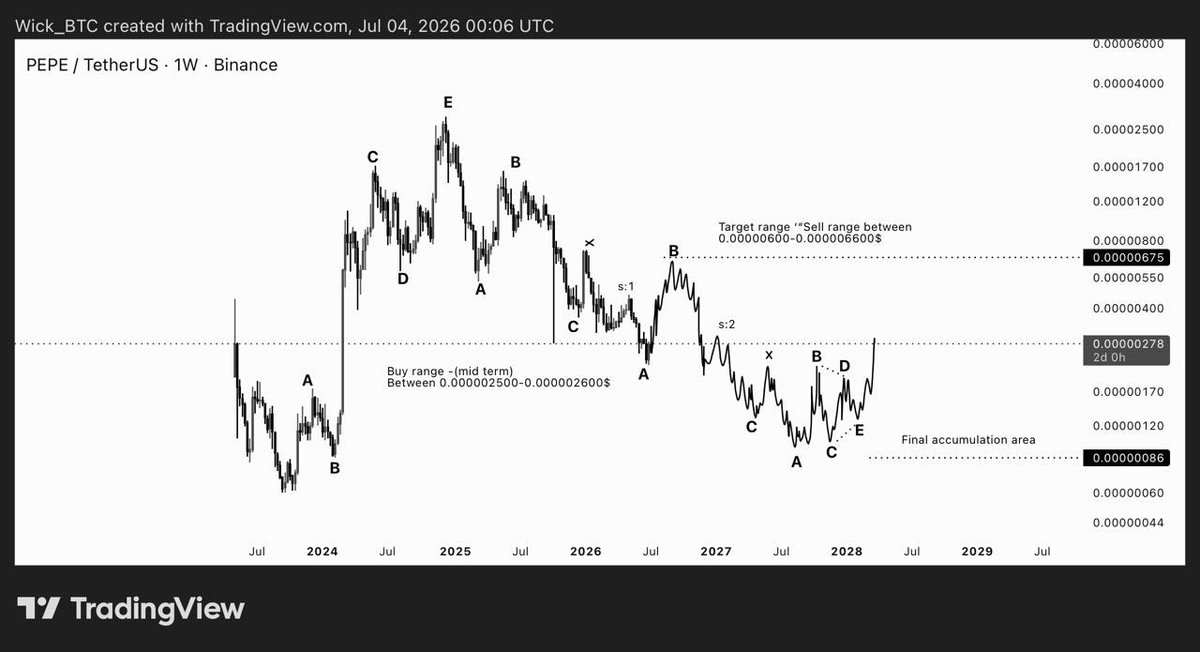
$PEPE Buy & Sell Setups (Mid-term)
Current structure continues to follow my projected wave path. I expect a relief rally before the next major bearish leg. As long as PEPE holds the 0.00000230–0.00000250 support zone, a move toward the 0.00000600–0.00000660 resistance area remains the primary scenario.
• Buy Zone: 0.00000250 – 0.00000260
• Target: 0.00000600 – 0.00000660
Once price reaches the sell range, I expect the relief rally to lose momentum and complete the corrective structure. From there, the next bearish phase should begin, with lower highs and lower lows.
• Sell Zone: 0.00000600 – 0.00000660
• Downside Target: Final accumulation area around 0.00000086
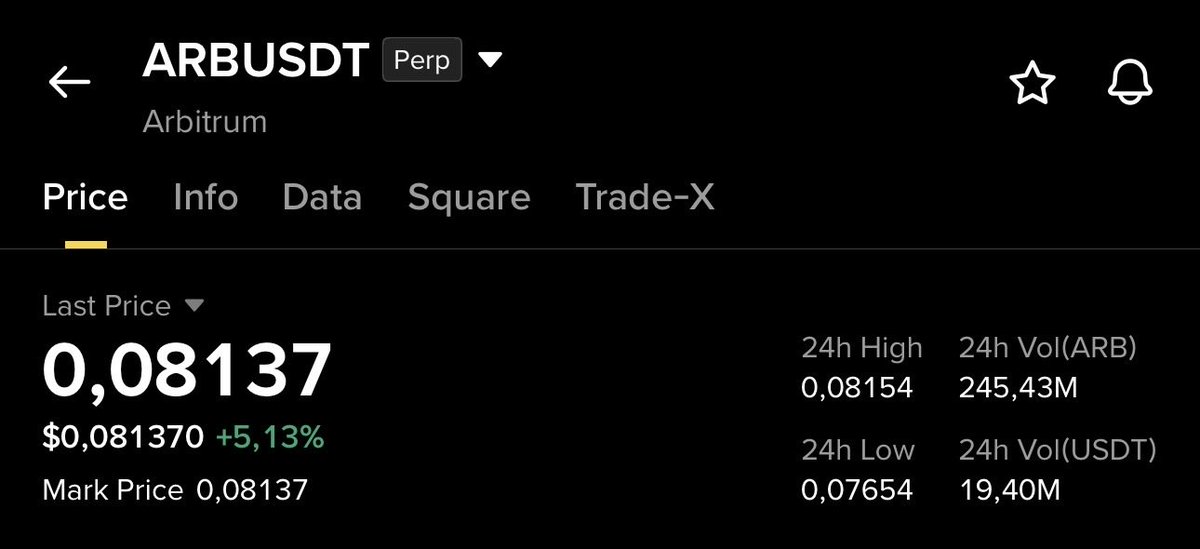
$ARB “Mid-Term Buy Setup”
Current price is approaching a key accumulation zone. Based on this analysis, I’m expecting a relief rally before the broader bearish trend resumes.
•Buy Range: $0.0700 – $0.0760
•Target: $0.1900 – $0.2200
This area offers the best risk-to-reward for a mid-term long position. The expected move is a relief rally, not the start of a new bull market.
Once price reaches the $0.1900–$0.2200 resistance zone, I’ll be looking for bearish confirmation to close longs and potentially open a short position, as I still expect a major bearish continuation afterward.
$ETH Buy & Sell Setups (Mid-term)
Current structure suggests a potential relief rally before the next corrective leg. As long as Ethereum holds the $1,520–$1,570 support zone, a short-term recovery toward the $1,730–$1,770 resistance area remains likely.
• Buy Zone: $1,520 – $1,570
• Target: $1,730 – $1,770
Once price reaches the sell range, I expect the rally to lose momentum and complete an ABC corrective structure, increasing the probability of another leg lower.
• Sell Zone: $1,730 – $1,770
• Downside Target: $1,400 – $1,340
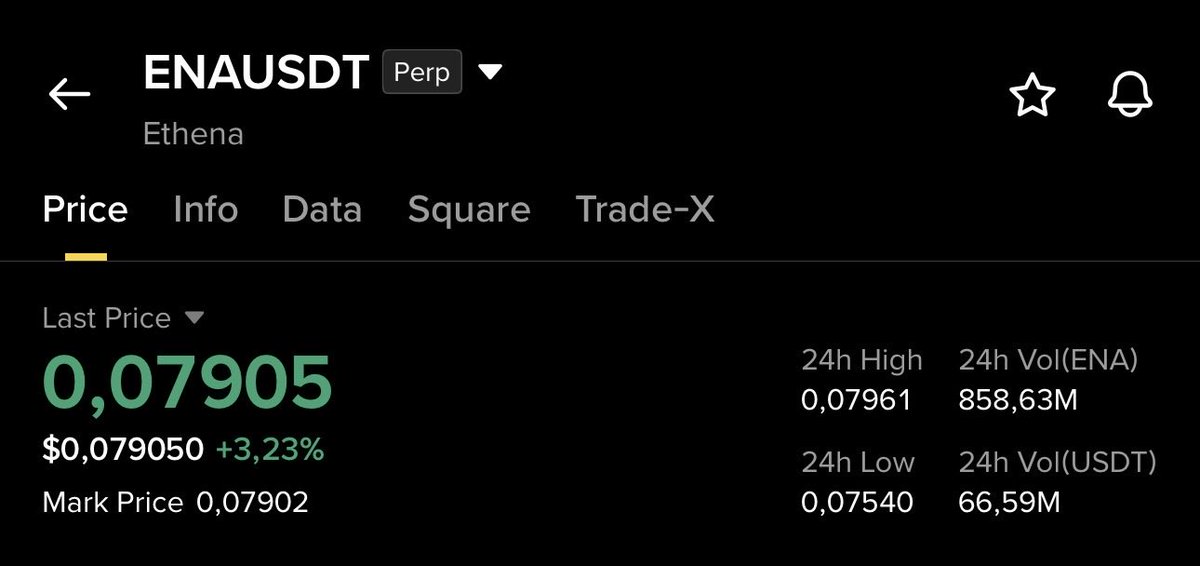
$ENA (1W) — Buy & Sell setup:
My current ENA outlook suggests a relief rally is likely before the larger cycle fully completes.
Accumulation around $0.065–0.070 offers favorable risk/reward, with a projected rally into $0.206–0.255 as the main sell zone.
If a deeper reset occurs, the final long-term accumulation area remains $0.0266–0.0300.
$ALICE (1W)
Relief rally expected before the next major bearish continuation.
Mid-term buy range: $0.1218–0.1300.
Targeting a rebound into $0.55–0.58, where I’ll be looking to open shorts.
The larger trend remains bearish, so this rally is viewed as a temporary recovery rather than a new bull market.