#ProTip Some handy #Github repo for a better #WinDbg experience:
- https://t.co/XQHfIP8wQJ
- https://t.co/41Tj3D1RtH by @timmisiak
- https://t.co/wqv7OmTphD by @yarden_shafir
- https://t.co/k7Q1gtjcdL by @0vercl0k
- https://t.co/A1O5eEizD6 by @_hugsy_
Got more? Add here 👇
If you update WinDbg today (1.2504.15001.0), you might notice another icon in the View tab of the ribbon, one called "Parallel Stacks". While incredibly useful in its own right, this isn't just a parallel stacks view. It's the introduction of graph visualization for extensions!
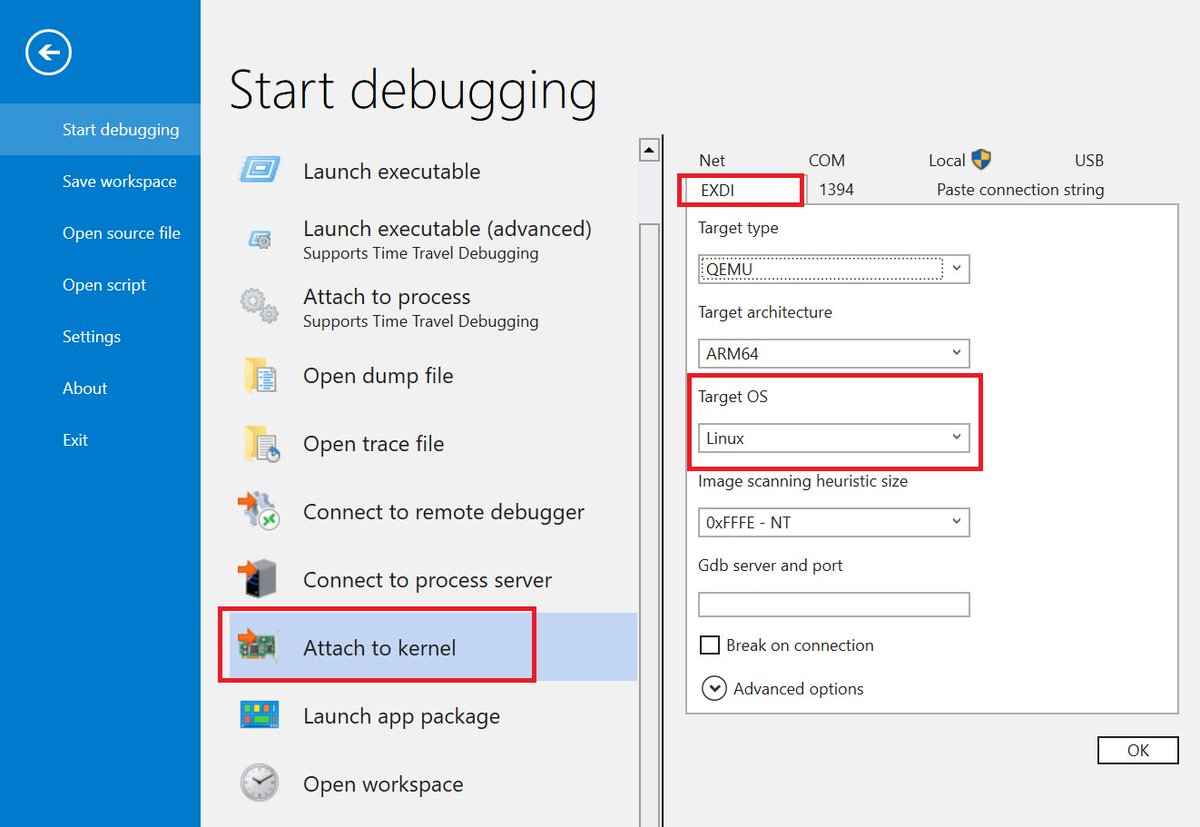
@jvert @markrussinovich Well... It's not quite KD, but WinDbg has supported debugging the Linux kernel via an EXDI connection for some time. Easiest setup is to enable the gdbserver on QEMU and use EXDI in WinDbg selecting "Linux" as the OS. I've source level stepped the Linux kernel doing that...
It's been a minute since we have released a new version of TTD! New version is now available (1.11.410) which fixes module selective recording, enables large queries via .Calls() and fixes some emulator bugs reported by our customers. https://t.co/PyeQjyNcGX
I know I'll catch flack for not knowing this, but the Mex WinDbg extension is so cool!
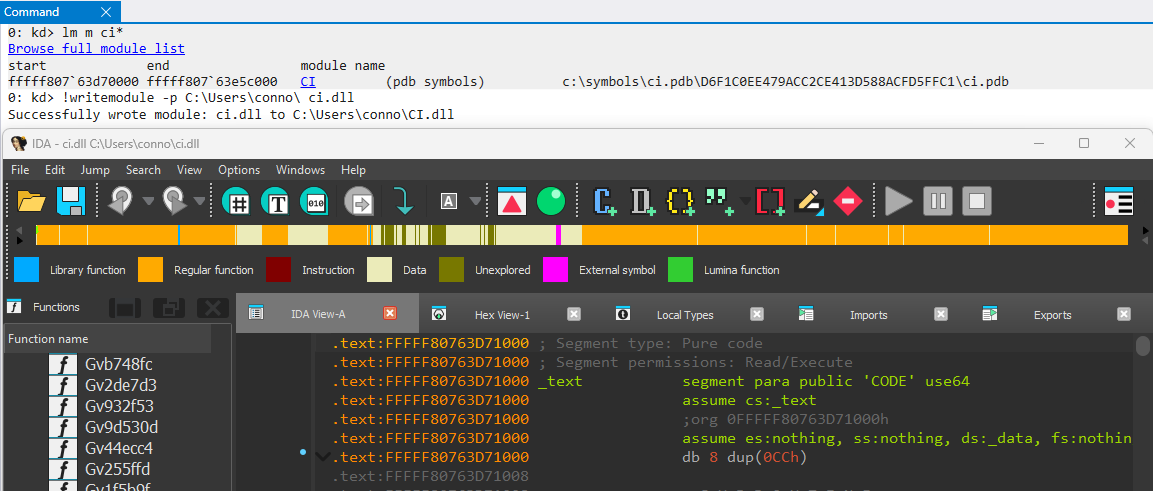
During dynamic analysis I needed to grab the exact version of a module from a target but didn't want to resume execution to fetch it since hitting the breakpoint was tricky. !writemodule FTW!
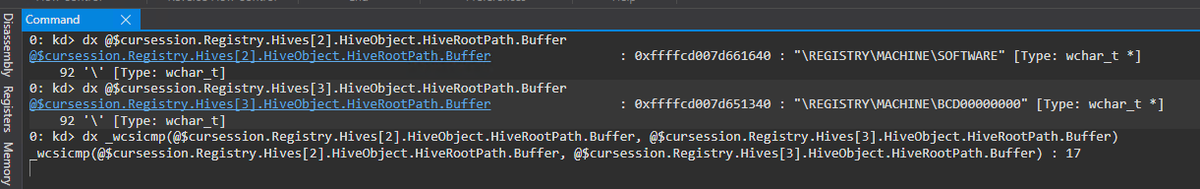
WinDbg has a few but very useful (undocumented) intrinsics directly usable from `dx`, such as: __iserror, __ignoreerror, __isnovalue. Also some functions in dbgeng.dll can be used for quick (wstr, str, mem) comparison , like _wcsnicmp, _wcsicmp, _stricmp, memicmp, etc.
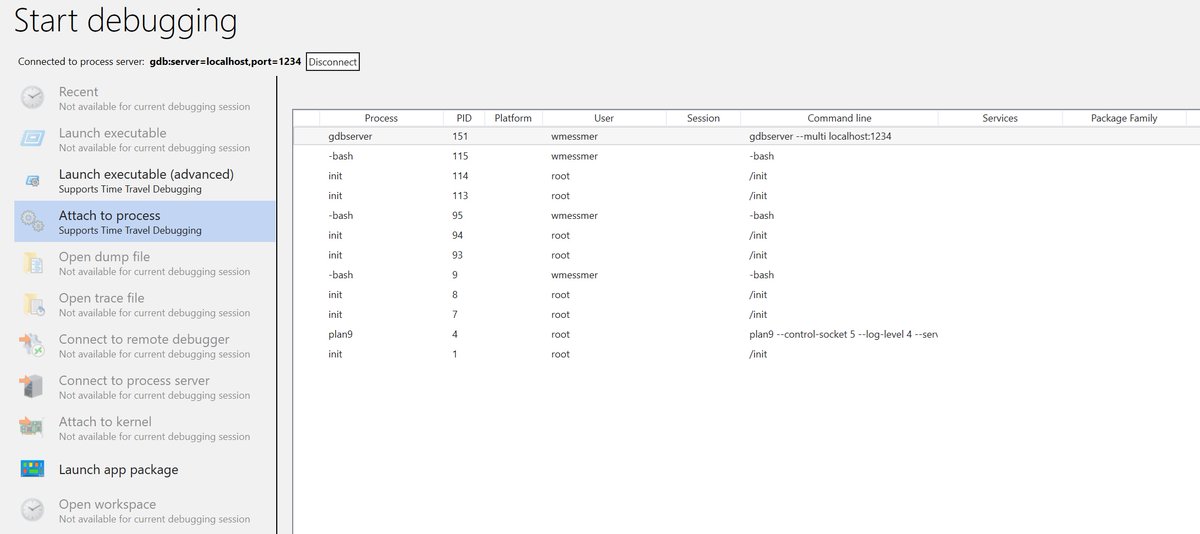
If you spin your gdbserver with --multi (e.g.: gdbserver --multi localhost:1234), you can connect to it via the "Connect to Process Server" (same protocol string) and then see the process list and attach...
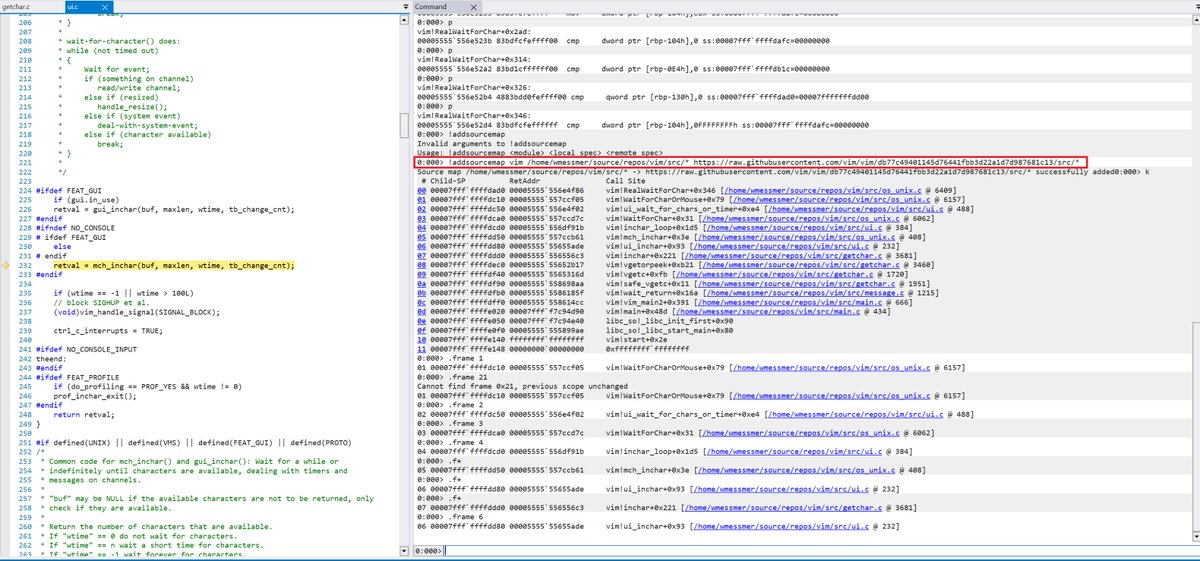
You can even tell us how to pull sources automatically from GitHub for your source level debugging... !addsourcemap <module> <local spec> <remote spec> as highlighted below. The db77...1c13 is the commit on master from which I built vim for this example.
Once you've connected, things should work very similarly to what you expect debugging a live Windows process. You can set breakpoints, single step, get locals, etc...
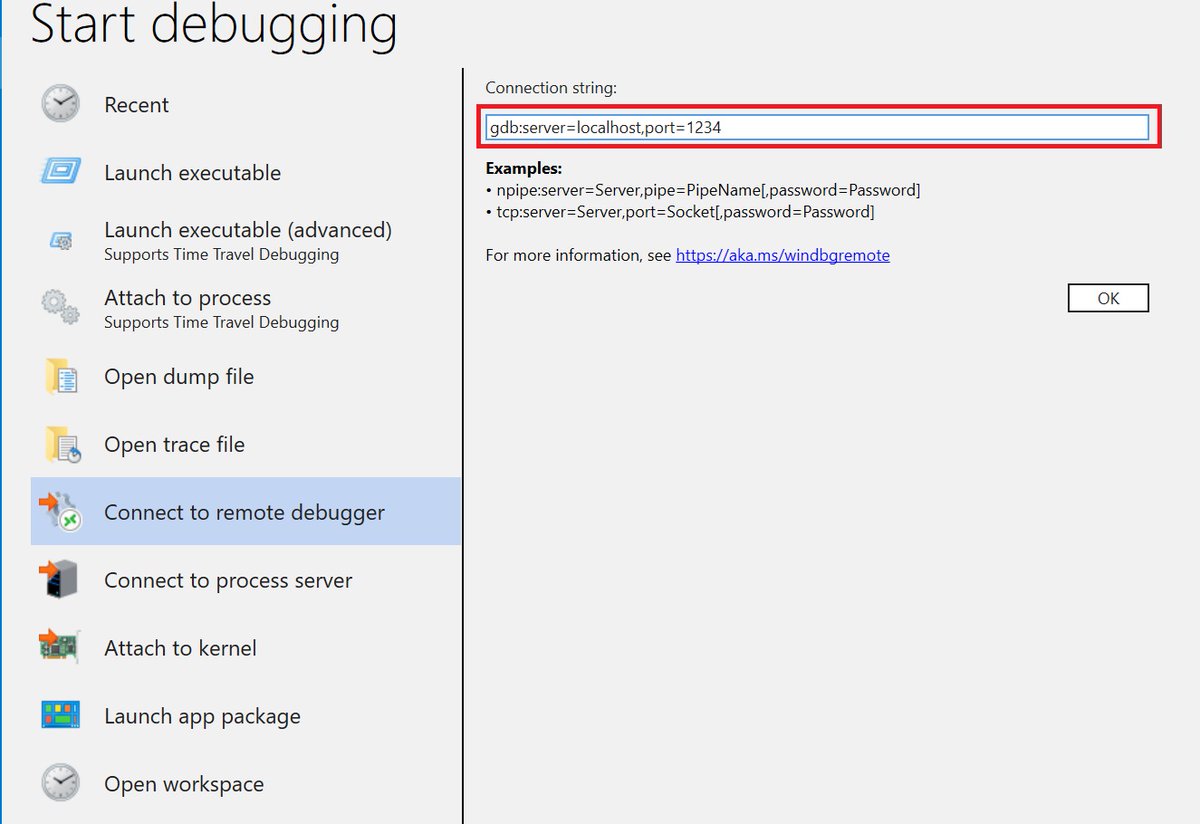
If you've ever wanted to live debug user mode Linux processes (e.g.: in WSL) from WinDbg, with 1.2402.24001.0, you can! Start up a gdbserver in WSL (e.g.: gdbserver localhost:1234 ./vim) and connect to it via WinDbg's "Connect to remote debugger"
I'm starting a series of WinDbg tutorial videos starting with the absolute basics. The first two videos cover how to install WinDbg and how to start a debugging session.
https://t.co/tI90ZkE5qs
https://t.co/81kFNRBFFn
Do you wish Time Travel Debugging was faster and more lightweight? Our latest version lets you decide exactly what you want recorded! Select modules to record or use the API for full control. Get your recording just the way you like it. Crusts optional. https://t.co/PyeQjyNcGX
Thanks to @_hugsy_'s contributions, the kdmp-parser library is now available on PyPI and also supports the new kernel dump types (8, 9, 10) that appeared in WinDbg around ~2022 😱
Go check it out: https://t.co/scwrzN9Sky / https://t.co/FdAES3A4EA 🔥
WinDbgX tip: If you press Ctrl+Shift+B, you can open a hex viewer for a file. The data is virtualized so that it can handle any size file. Like this 334MB Windows.UI.Xaml.pdb file.
It's somewhat undocumented because it was just a test bed for the memory window, but still useful.
New drop of TTD adds recording of 32-bit apps on 64-bit Intel/AMD machines and fixes EULA issues @timmisiak reported. https://t.co/qVnSkk8Mx3 or tell winget you want to time travel!
📢 @_hugsy_ added Python (>=3.8) bindings to udmp-parser (https://t.co/sCHBOvldHV) and we think they are ready for testing!
Go try them out 🔥
https://t.co/xSn6eHjA0x
For those on the latest dev builds (>= 4337), make sure to check out the new TTD (Time Travel Debugging) support included in the built-in debugger!
https://t.co/1jUtfLF6W0