Bitcoin Market Report.
You need to know this.
Bitcoin Top-Down Analysis:
1. The Weekly Chart
Everything should be built from the top down. First decide the weekly trend and then use the lower timeframe to form a bias.
After the range low touch at $60k, the bullish fuelled by mass short liquidations,has started to form some bullish structure on the weekly.
80K has become an imperative level to hold (you'll see in the daily chart how it's currently being exhausted). Otherwise, a sweep of the low at $75k becomes a very probable move, as standard Bitcoin PA has shown us time and again that a major HTF sweep tends to fuel the next major run.
(Note: every local top that formed in the bear market came from a major sweep of highs.)
With that being said, we're currently sitting at the weekly supply zone (the last weekly down close before the expansive move higher). This could be the catalyst for the next leg up, putting in the HTF higher low most market participants long for... pardon the pun.
2. The Daily Chart
With the weekly context in mind, we can now go through the daily chart with a finer comb.
As I keep repeating in the market update videos, auction market theory reigns supreme in BTC price action, with every major expansive move followed by a long consolidation / range.
After we flipped the HTF range high of $75k, which coincided with a sweep of the LTF low, we pushed bullishly up through $80k (a major psychological resistance / round number) towards the yearly open (another major psychological resistance) and started forming our next consolidation / LTF range.
Since then we've broken down through that LTF range. Every bullish attempt to push back up has been met with sharp sell-offs at logical resistance overhead, like the mid-range point of the LTF range (all covered in my market update videos).
Bitcoin hasn't been helped at all by news-driven events and global uncertainty, which naturally leads to selling pressure (like the ETF outflows we saw over the last couple of weeks) as people dump their risk assets in pursuit of more certain market conditions.
On the daily we're now back at our previous LTF range highs, with multiple stabs below $80k.
$80.6k is a key level in its own right. It was a prior bear market range low, and it was the primary resistance when we were trying to get through $80k in the first place.
Rather concerningly, we're currently back under that level and have seen some bearish underside retests of it on the lower timeframes.
That being said, for me these have always been levels of discount and uncertainty worth putting a small portion of risk on. Most people wait for price to be exploding to the upside before jumping in head first. The best expected value always comes at these discounted, scary levels that everyone begs for, yet bails on once the market actually presents them.
In the words of a once infamous person in this space:
"Big week ahead"
3. This Week's Macro News (some big ones here)
Bitcoin has been trading like a tech stock all month, so most of what moves it this week won't come from crypto at all.
- Wednesday: The Fed. No hike is expected, with most expecting them to hold until after the midterms. Microsoft and Alphabet also report, and the capex numbers are what matter. If the AI spending story starts to crack, BTC follows the Nasdaq down.
- Thursday: PCE and Q3 GDP. A hot PCE print puts a December hike firmly back on the table. Amazon and Coinbase also report, and Coinbase gives a decent read on whether retail is actually trading.
- Oil: Brent hit $116 after the Houthi strikes on Saudi infrastructure, its highest since April. Saudi, Turkish and Pakistani officials meet Iran in Tehran this week. How that goes decides whether the inflation trade comes back.
- Midterms: next week, and another pivot point for the Fed.
I'm marking my levels, cutting size and letting the data come to me. In weeks like this, most of the money gets lost chasing the first move.
My 6 rules after 9 years in this market (it doesn't matter but I think it sounds cool)
1. The exit is decided before the entry. Always. If I don't know the exit, I won't enter.
2. No trades in the middle of the range unless you're a scalping genius or a market maker, which you're not.
3. Never add to a loser because you're just praying to get out at a loss unless you've some magical forensics balance sheet reading ability which doesn't matter in Crypto.
4. Never increase size to win back a loss,if you're doing this, you're not a disciplined trader which just means you can't trade.
5. If the plan said no and price pumped, you still don’t enter. Read the last part of point 4 again.
6. Boring is profitable which means your strategy after studied and executed should be a boring signal where you're not leaving things to be guessed.
$BTC Plan TWC Traders 😎
The strategy I shared on Telegram has worked 100% so far. 🤌🏻
No FOMO, no FUD. Liquidation sweeps and manipulation signal opportunities.
Even better setups ahead.
DM to join: https://t.co/tLVsOmjVlB
GMMMMM best
Focus on the ranges and the 1D chart. From there, drop down to the lower timeframes and trade objectively.
The direction is still messy and unclear.
But Crypto Twitter loves extremes: when the market is red, everything is going to zero; when it’s green, everything is going to $1 million.
Ignore the noise. Read the chart and trade what you see—objectively.
Well, $BTC has almost reached the zone I had indicated.
I won’t be entering the market straight away: at these levels, the risk is still too high. Losing this support could quickly send us towards the 75–76K area.
I need to see consolidation at the lows, followed by a reclaim of a key level within the range. Only then will I consider entering.
For now, I’m waiting
$ATOM The trade setup Video 😎
Everything is clear, concise, and clean. A PO3 video in 1 minute. I’ve also posted it on my YouTube channel, where you can check out the other content.
DM to join the TWC Traders channel: https://t.co/hSFpOUcAFk
Don’t forget to comment and RT the post for more content.
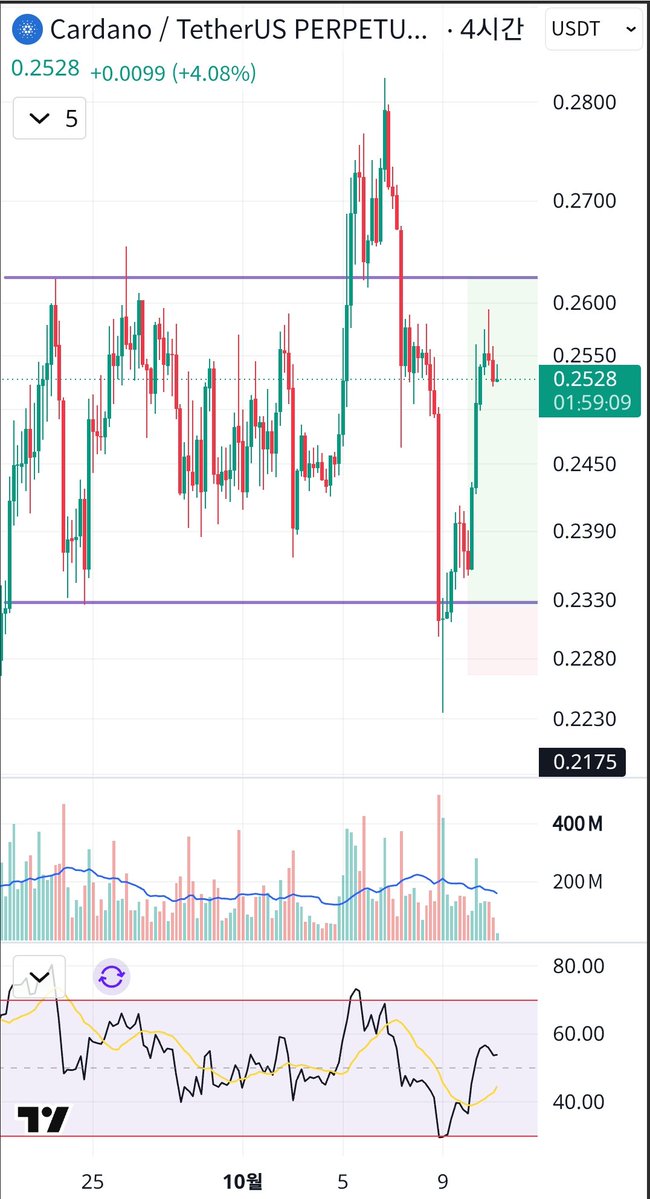
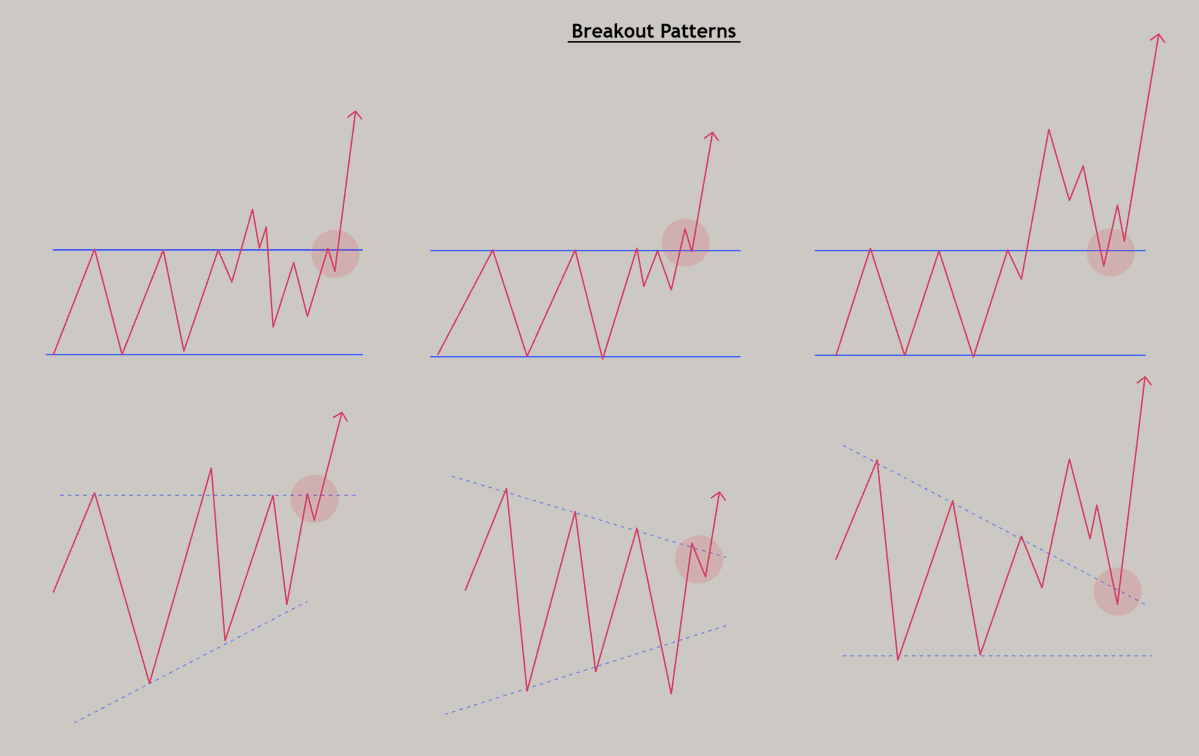
WHY DOES THE BREAKOUT FAIL RIGHT AFTER YOU BUY IT?
Because it was never a breakout. It was a deviation.
Price steps outside the range, takes the stops, traps the breakout traders, and comes back in. That is where I enter. The target is the other side of the range.
No deviation, no trade.
EP 02: THE RANGE
Full lesson on YouTube 👇
https://t.co/sadRQT6b3W
WHY DOES IT PUMP AFTER YOU GET STOPPED OUT?
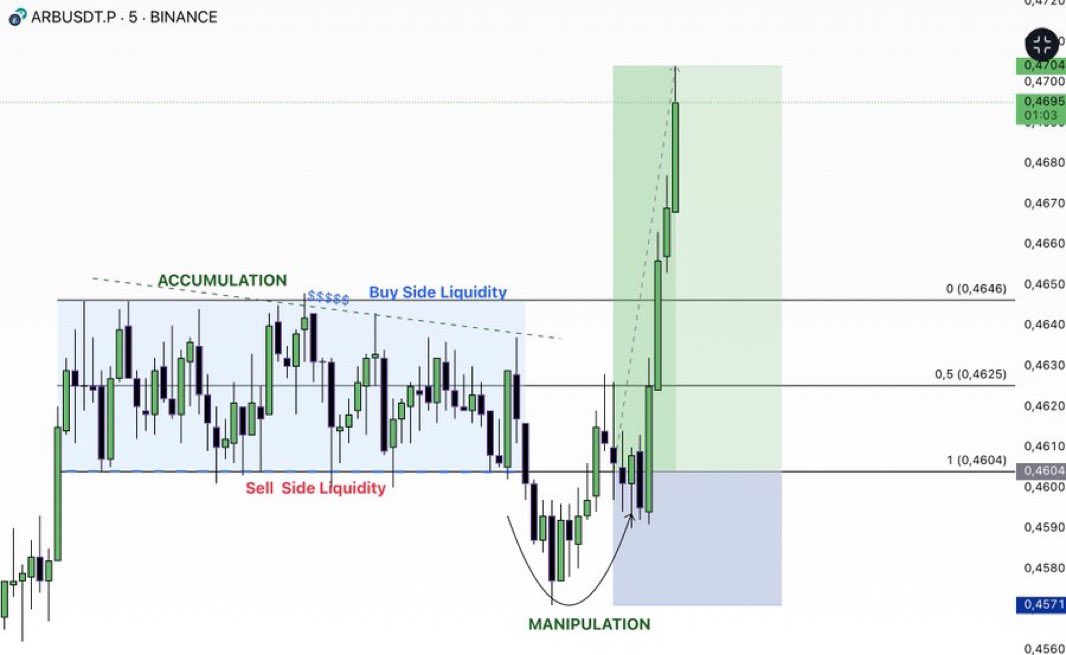
This is where the logic of PO3 begins: accumulation, manipulation, and distribution.
In this video, I show step by step how price sweeps below the range and returns, where the entry is, and how the move unfolds toward the targets.
For me, it’s about watching what price does next rather than rushing into the first breakout.
LSTRADER | PO3 Episode 01
Watch it, then look at your own charts through this lens.
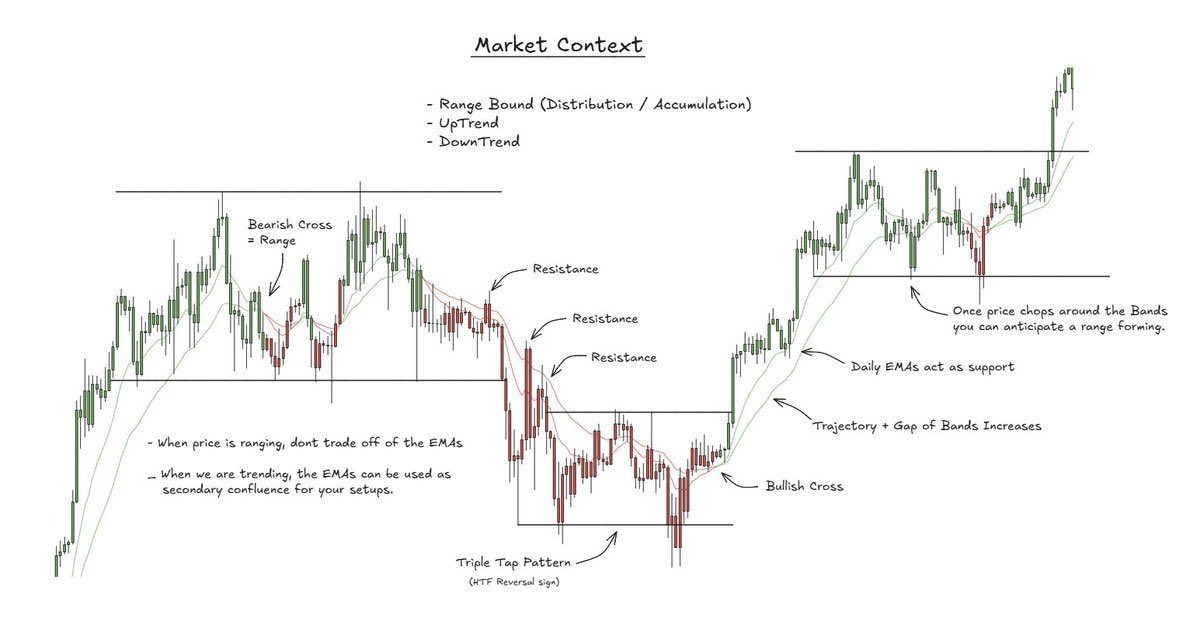
Market Context
This is the most important foundation of my trading:
@Trader_XO was the first person to bring this to my attention and to this day his teachings still have a tremendous impact on my trading / process.
Market context should be one of the foundations of your trading. It helps you identify which trades you should be focusing on, from a more directional point of view.
Patterns don’t mean shit unless you are trading them in the right context, this goes for double tops / bottoms and even compression setups.
The daily / weekly 12/25 EMAs (TraderXO Macro Trend Scanner) is one of the simplest yet most efficient way to ensure your always on the right side of the trade.
In an uptrend, the daily bands will be green and price comfortably above. In a downtrend, the daily bands will be red, and they will act as resistance when price trades into them from the underside. In rotational (Range) environments you will see the daily bands more frequently cross both bullish & bearish.
My favourite tip for identifying a rangebound environment after an uptrend, is when we have the first bearish cross on the bands. Vis versa, in a downtrend you can wait for the first bullish cross to anticipate a rotational environment.
I urge you all to implement market context into your trading process and have clear rules defining how you identify each environment.
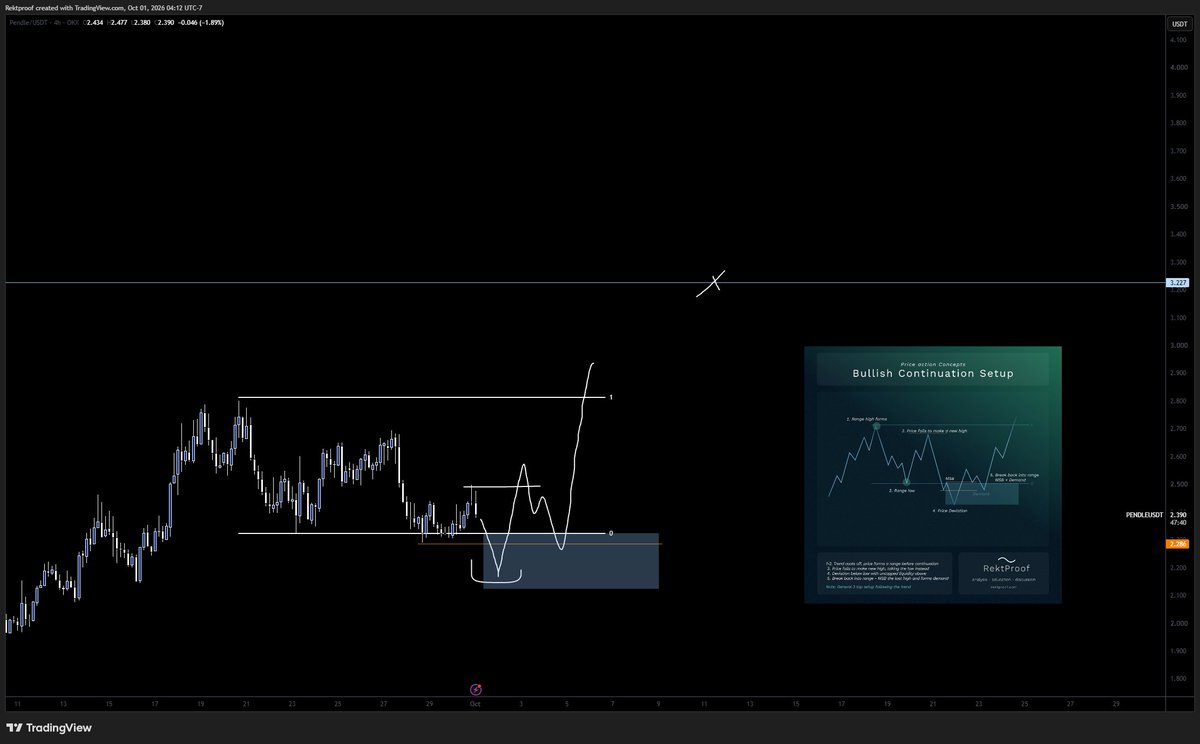
$PENDLE
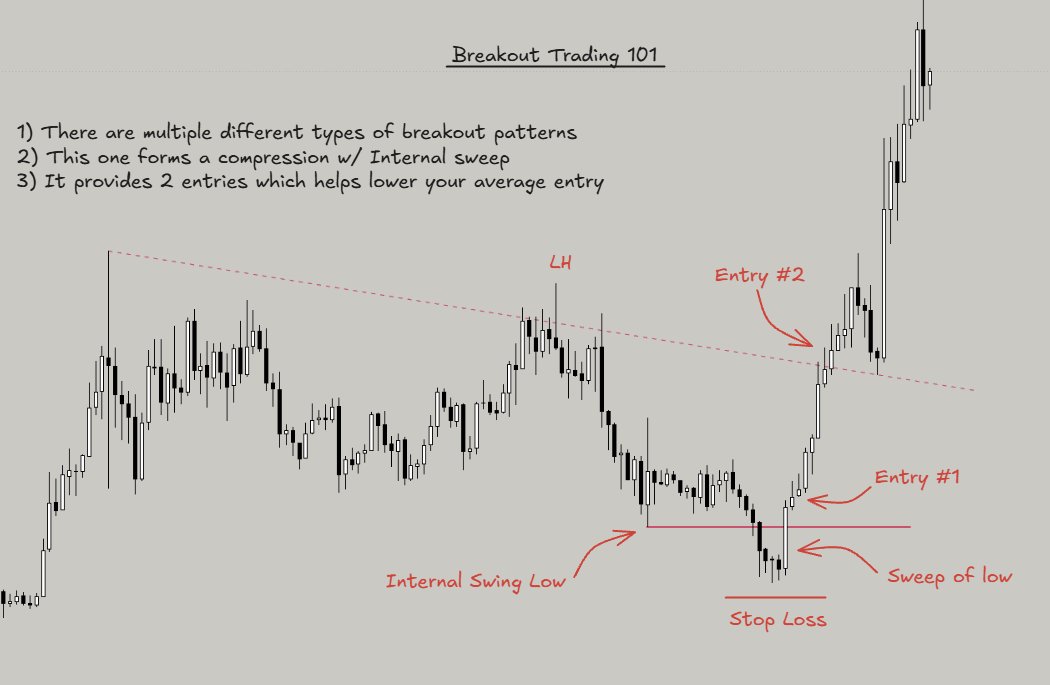
Structure looks good- looking for a low to shift below and break back above giving us the msb and formed demand for a long
3.2 monthly NPOC target
$BTC is currently in the middle of a no-trade zone. I’m not interested in entering here—I need a trigger.
A trigger is not a random line. It is a liquidity sweep outside the range, followed by a reclaim and retest.
Sweep above + reclaim below = potential short.
Sweep below + reclaim above = potential long.
The $82K–$83K area is different: there, I would consider entering on a direct retest without necessarily waiting for a deviation.
I’m not trying to predict every move. I’m waiting for price to reach my levels and give me a clear setup with easy invalidation.
Drawing lines is easy. Patience, confirmation and execution make the difference.