IV on all #GME and #AMC calls and puts continues to increase tonight.
If the implied volatility (IV) on #GameStop $125 June 21, 2024, call contracts is increasing from 500% on Friday at market close to 625% by Sunday night, several factors might be contributing to this change, even though the market is closed.
Here are some potential reasons:
### Anticipation of Major Events or News
- **Pending Announcements**: There might be anticipated announcements or news related to GameStop expected to occur over the weekend or before the market opens on Monday. This could include company-specific news, industry developments, or broader market news that could significantly impact GameStop's stock price.
- **Speculation and Rumors**: Increased speculation or rumors circulating over the weekend about GameStop could lead to higher expected volatility. For instance, discussions on social media, forums, or news outlets might drive traders to anticipate more significant price swings.
### Broker and Market Maker Adjustments
- **Algorithmic Updates**: Brokers might update their implied volatility models over the weekend based on the latest available information and anticipated market conditions. This could involve recalibrating models to reflect increased expected volatility.
- **Market Sentiment**: Changes in market sentiment or broader economic factors can lead brokers to adjust IV in anticipation of market reopening. For example, if there is increased concern about market volatility in general, this might be reflected in higher IV for specific stocks, including GameStop.
### Historical Volatility and Market Trends
- **Historical Volatility Patterns**: If GameStop has shown significant historical volatility, especially around certain periods or events, brokers might increase IV in anticipation of similar patterns repeating.
- **Options Demand**: Increased demand for options contracts over the weekend, even if not traded, could be reflected in higher IV. This could be due to hedging activities or speculative positions that brokers anticipate.
### Market Structure and Technical Factors
- **Volatility Products**: The activity in volatility-related financial products or derivatives might impact the IV of specific options. For instance, if there are significant movements in volatility indices or related instruments, this might influence IV calculations for individual stocks.
- **Global Events**: Any significant global events occurring over the weekend (geopolitical developments, economic data releases, etc.) might indirectly affect GameStop's expected volatility, leading to adjustments in IV.
### Practical Implications
- **Pre-Market Activity**: Even though options markets are closed, the anticipation of significant price movements when markets reopen can drive IV higher. This adjustment helps prepare for the potential increased trading activity and volatility expected on Monday.
- **Strategic Adjustments**: Traders and market makers might be positioning themselves based on expected volatility, leading to higher IV as they anticipate increased demand for options contracts once trading resumes.
### Conclusion
The steady increase in implied volatility for GameStop $125 June 21, 2024, call contracts from 500% to 625% over the weekend likely reflects a combination of anticipated events, speculative activity, and adjustments by brokers and market makers.
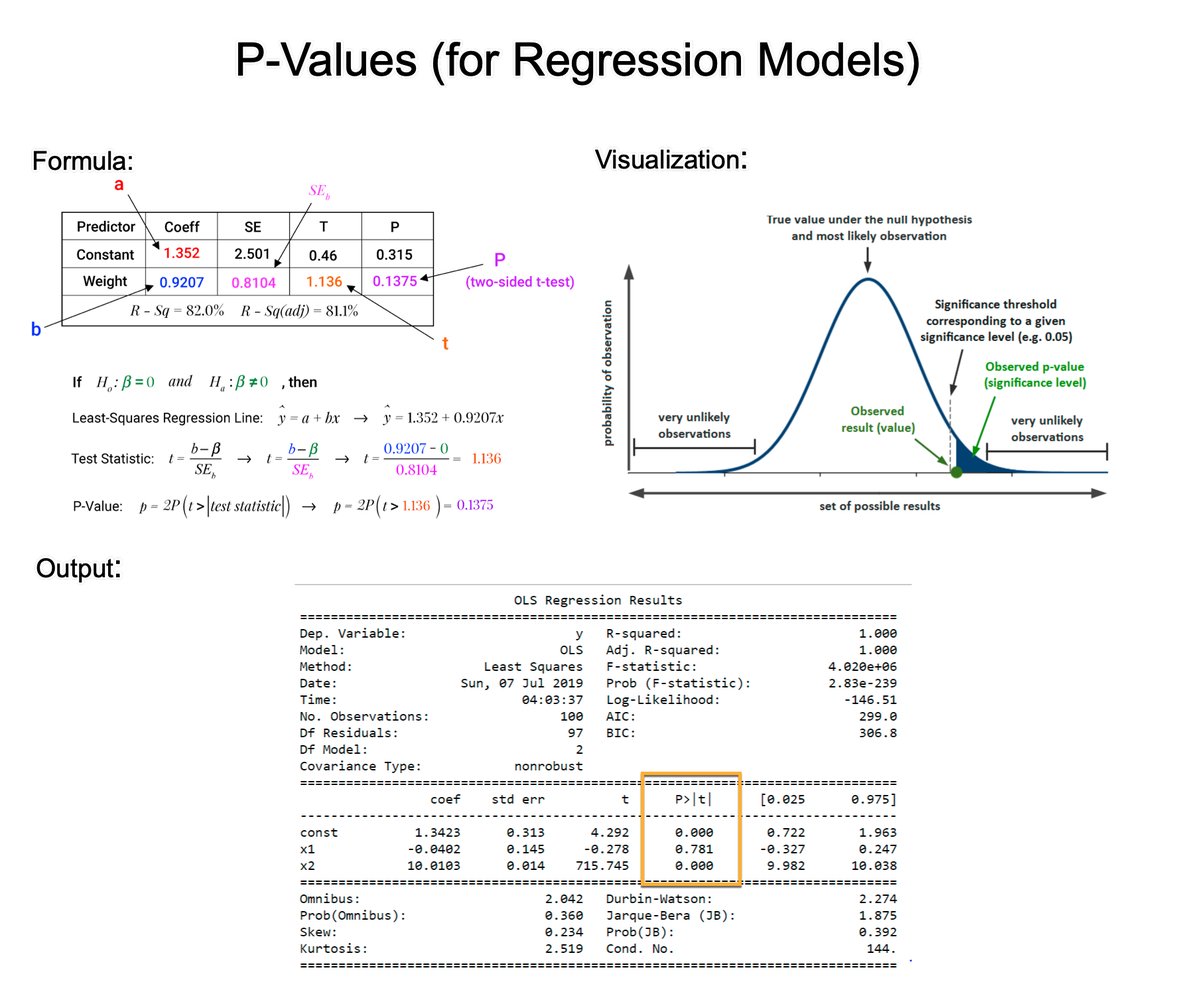
Understanding P-Values is essential for improving regression models. In 2 minutes, learn what took me 2 years to figure out.
1. The p-value: A p-value, in statistics, is a measure used to assess the strength of the evidence against a null hypothesis.
2. Null Hypothesis (H0): This is a general statement or default position that there is no relationship between two measured phenomena or no association among groups. For example, the regressor does not affect the outcome.
3. Alternative Hypothesis (H1): This is what you want to test for. It is often the opposite of the null hypothesis. For example, that the regressor does affect the outcome.
4. Calculating the p-value: The p-value for each coefficient is typically calculated using the t-test. There are several steps involved. Let's break them down.
5. Coefficient Estimate: In a regression model, you have estimates of coefficients (β) for each predictor. These coefficients represent the change in the dependent variable for a one-unit change in the predictor, holding all other predictors constant.
6. Standard Error of the Coefficient: The standard error (SE) measures the accuracy with which a sample represents a population. In regression, the SE of a coefficient estimate indicates how much variability there is in the estimate of the coefficient.
7. Test Statistic (T): The test statistic for each coefficient in a regression model is calculated by dividing the Coefficient Estimate / Standard Error of the Coefficient. This gives you a t-value.
8. Degrees of Freedom: The degrees of freedom (df) for this test are usually calculated as the number of observations minus the number of parameters being estimated (including the intercept).
9. P-Value Calculation: The p-value is then determined by comparing the calculated t-value to the t-distribution with the appropriate degrees of freedom. The area under the t-distribution curve, beyond the calculated t-value, gives the p-value.
10. Interpretation: A small p-value (usually ≤ 0.05) indicates that it is unlikely to observe such a data pattern if the null hypothesis were true, suggesting that the predictor is a significant contributor to the model.
There you have it- my top 10 concepts on p-values. The next problem you'll face is how to apply data science to business.
I'd like to help.
I’ve spent 100 hours consolidating my learnings into a free 5-day course, How to Solve Business Problems with Data Science. It comes with:
300+ lines of R and Python code
5 bonus trainings
2 systematic frameworks
1 complete roadmap to avoid mistakes and start solving business problems with data science, TODAY.
👉 Here it is for free: https://t.co/YXG4pL97ZN
#Bitcoin's Puell Multiple has performed its one and only natural reset of the cycle.
The Puell Multiple uses a 365-day moving average of the money that miners bring in from mining Bitcoin.
The halving, which occurred just 4 days ago, causes a massive natural drop in this metric due to the loss in mining revenue.
This was much needed as the metric was running into double resistance at the mid-top and cycle top line.
Recoveries from natural drops are usually swift and include the best cycle price action.
The average payment on a new home is now at a record $2,900/month.
The average house is now renting for a record $1,900/month.
The average new car payment is now at a record $740/month.
The average used car payment is now at a record $530/month.
The average student loan payment is now $500/month.
The average gallon of gas is now nearing $4.00 again.
The average household credit card balance is now at a record $7,300.
The average household will have $0 of excess savings by the end of this quarter.
How can the average person afford to live?
The Upcoming AI Wars and The Science Behind Multimodal Large Language Models (MLLMs)
Today, GPT-4 reigns supreme on all the LLM benchmarks and leaderboards but rumors are that it will soon be displaced.
Google is claiming its Gemini model is 5 times more powerful than GPT-4. In addition to its power, Gemini has multimodal capabilities, meaning it can process and generate text, code, images, and audio.
Gemini is rumored to be a massive model (65T parameters!!) and trained on YouTube data! So will Gemini, soon replace GPT-4, and will it be as magical as Google claims it will be?
First, let's break down the science of these MLLMs. You can create MLLMs in a couple of different ways
One common approach is to use a multimodal encoder to convert both the image and text into a common latent space. This allows the LLM to learn how to correlate different types of information, such as the visual appearance of an object and its textual description.
To break this down, Google has published papers outlining how to adopt the transformer architecture for image processing. Images can be broken into 14x14 pixel patches, each patch goes through the same learnable linear transformation to transform into a vector. Each vector is concatenated with a learnable positional embedding. These concatenated vectors are then fed into a Transformer model, ViT. The output of ViT is an embedding representation of the image.
For an input prompt that has both images and words, both the words and images are converted into vectors and fed into an LLM. The LLM is fine-tuned on the multi-media training data and the resulting model is a MLLM. As you can imagine, you can extend the same technique to audio and video files.
Another approach is to use a cross-modal transformer, which is a type of neural network that can learn to translate between different modalities. This allows the LLM to directly process both image and text inputs, without the need for a separate encoder.
Another common cross-modal approach is to use multimodal contrastive learning. Multimodal contrastive learning is a type of training objective that encourages the LLM to learn how to distinguish between positive and negative pairs of data points. Positive pairs are data points that are related to each other in some way, such as an image and its corresponding text description. Negative pairs are data points that are not related to each other. The LLM is trained to maximize the similarity between the representations of positive pairs and minimize the similarity between the representations of negative pairs. This encourages the LLM to learn how to extract meaningful features from the different modalities and to correlate the different modalities with each other.
Google has been tight-lipped about Gemini and we don't really know what approach they are using. There is speculation that Gemini may combine standard LLM training techniques with techniques from AlphaGo, like reinforcement learning.
While GPT-4 has multi-modal capabilities, OpenAI has not made that widely available due to concerns over how its capabilities may be misused by bad actors to break captchas and the like. However, given the competition from Gemini, they are likely to release this shortly as GPT-Vision. OpenAI is also working on a new multi-modal model of their own - Gobi. This could potentially be GPT-5. YAY!!
In the meantime, Meta is working on a competitor to ChatGPT. The big question is whether they will make their new model which is supposed to rival GPT-4, open source?
If all goes well, Meta will release Llama-3 to the public, OpenAI will launch GPT-Vision and Gobi, and Google will release Gemini. In that scenario, competition will be alive and well and the much-needed powerful models will finally move AI applications from the hype land to the genuinely useful land🤞
Common Probability Distributions That Occur In Nature And Why Mathematics Is The Language Of The Universe
Fundamentally the patterns of the universe repeat themselves making machine learning and AI possible.
Basically, when training ML models, including NNs we are attempting to model the patterns in the data. A good model can predict unseen data points that are part of the original data distribution.
Here are the common probability distributions and where they occur naturally
Symmetry and normal distributions - Nature loves balance. You see it in butterfly wings, faces, and even in physical laws. Natural phenomena that exhibit symmetry often fit well with a normal distribution.
The Central Limit Theorem tells us that the sum of many independent, identically distributed variables approaches a normal distribution. These distributions are characterized by a mean and a standard deviation and everything from human heights, IQ scores, and even the velocities of molecules in a gas follow a normal distribution
Log-normal distribution - If the logarithm of the variable follows a normal distribution, then the variable itself has a log-normal distribution. The distribution of financial assets, or the sizes of particles generated by grinding, blood pressure, and metabolic rates in various organisms often follow a log-normal distribution.
The Log-Normal Distribution often arises from multiplicative growth processes, where you're repeatedly multiplying by some random factor.
Uniform Distribution. This is self-explanatory. All outcomes are equally likely. In the continuous case, the probability density function is flat between the minimum and maximum values. Rolling a fair die, or picking a card from a well-shuffled deck follows uniform distributions
Poisson Distribution It describes the probability of a given number of events occurring in a fixed interval of time or space. The events must occur with a known constant mean rate and independently of each other. It is the go-to for predicting rare events.
Poisson distribution models the number of times a radioactive atom decays in a given time period, or the number of cars passing through a certain point in a given time frame.
If a particular intersection sees an average of 10 cars passing through it per minute, the Poisson Distribution can estimate the probability of 15 cars passing through in the next minute. Similarly in sports like hockey or soccer where goals are rare, you can use distribution to model the number of goals scored by each team.
Bernoulli Distribution, the binary star of the probability universe! Scientifically speaking, it's a discrete probability distribution that models a single experiment with exactly two outcomes, often termed "success" and "failure," and is characterized by a single parameter p, the probability of success.
The flip of a coin, genetic inheritance (you either have a trait or you don't), and the polarization of a single photon (either vertical or horizontal) model this distribution.
Binomial Distribution It describes the number of successes in a fixed number of independent Bernoulli trials, each with the same probability of success.
For example, The number of heads when flipping a coin multiple times, or the number of defective items in a batch of manufactured goods can be modeled with this distribution.
Exponential Distribution models the time you have to wait for the next event in scenarios where events happen independently and at a constant average rate. It's often used to describe phenomena like the time between bus arrivals or the intervals between radioactive decay events.
In essence, it's the go-to distribution for understanding "waiting times" in various natural and man-made systems.
This is a summary of the most common distributions. There are a bunch of other distributions that are related or variations on the above distributions and the image below captures some of them.
These naturally occurring distributions speak to why mathematics is the language of the universe and how you can use it to model and predict its behavior
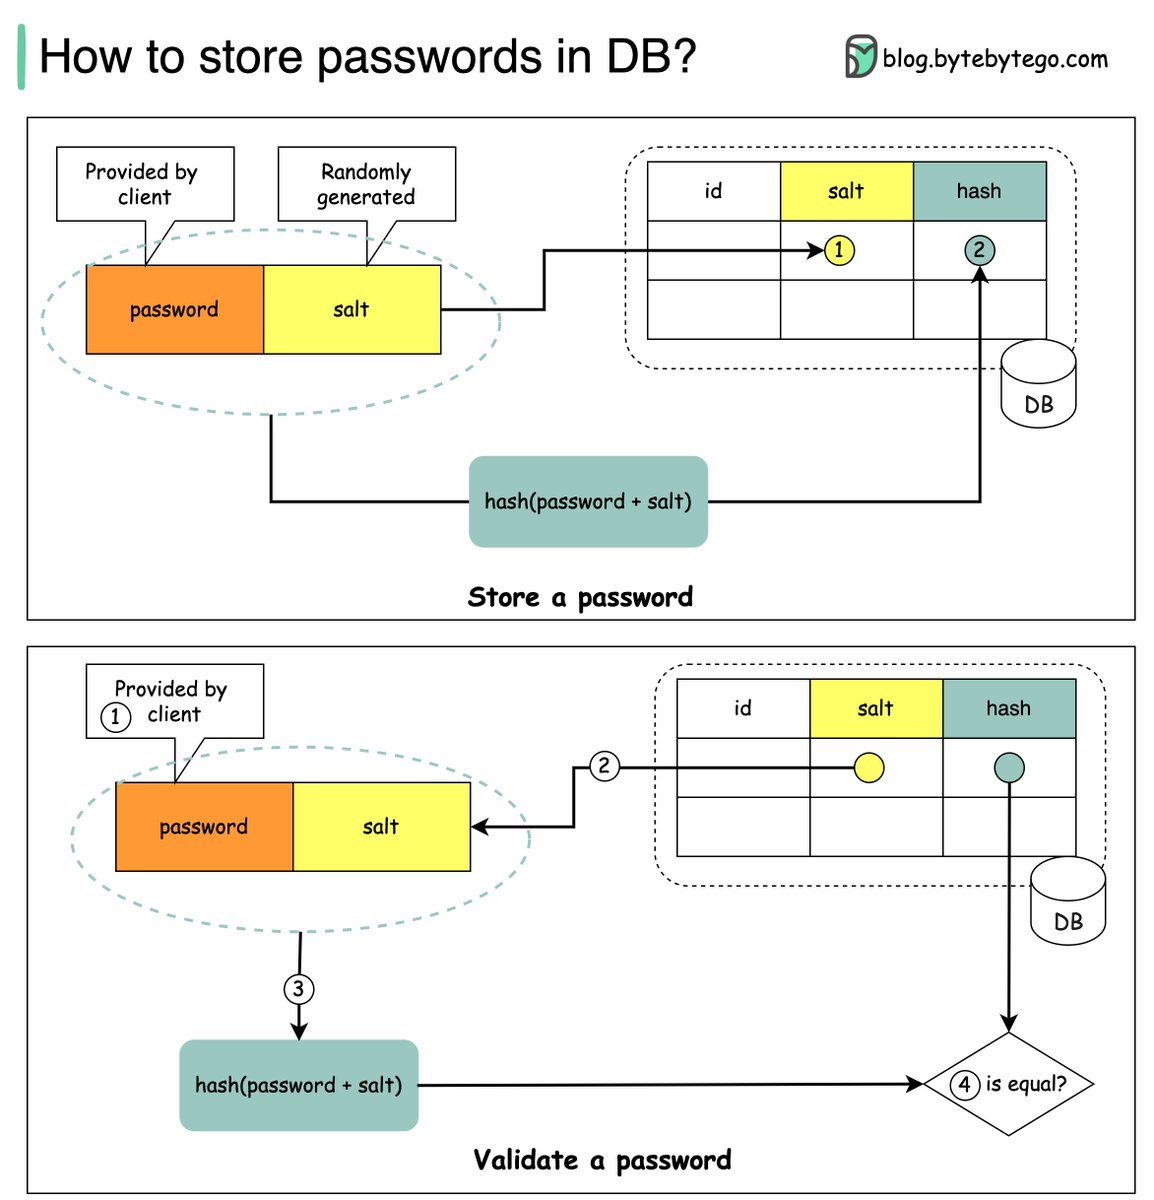
How to store passwords safely in the database and how to validate a password? Let’s take a look.
𝐓𝐡𝐢𝐧𝐠𝐬 𝐍𝐎𝐓 𝐭𝐨 𝐝𝐨
🔹 Storing passwords in plain text is not a good idea because anyone with internal access can see them.
🔹 Storing password hashes directly is not sufficient because it is pruned to precomputation attacks, such as rainbow tables.
🔹 To mitigate precomputation attacks, we salt the passwords.
𝐖𝐡𝐚𝐭 𝐢𝐬 𝐬𝐚𝐥𝐭?
According to OWASP guidelines, “a salt is a unique, randomly generated string that is added to each password as part of the hashing process”.
𝐇𝐨𝐰 𝐭𝐨 𝐬𝐭𝐨𝐫𝐞 𝐚 𝐩𝐚𝐬𝐬𝐰𝐨𝐫𝐝 𝐚𝐧𝐝 𝐬𝐚𝐥𝐭?
1️ A salt is not meant to be secret and it can be stored in plain text in the database. It is used to ensure the hash result is unique to each password.
2️ The password can be stored in the database using the following format: 𝘩𝘢𝘴𝘩( 𝘱𝘢𝘴𝘴𝘸𝘰𝘳𝘥 + 𝘴𝘢𝘭𝘵).
𝐇𝐨𝐰 𝐭𝐨 𝐯𝐚𝐥𝐢𝐝𝐚𝐭𝐞 𝐚 𝐩𝐚𝐬𝐬𝐰𝐨𝐫𝐝?
To validate a password, it can go through the following process:
1️ A client enters the password.
2️ The system fetches the corresponding salt from the database.
3️ The system appends the salt to the password and hashes it. Let’s call the hashed value H1.
4️ The system compares H1 and H2, where H2 is the hash stored in the database. If they are the same, the password is valid.
Over to you: what other mechanisms can we use to ensure password safety?
—
Subscribe to our weekly newsletter to get a Free System Design PDF (158 pages): https://t.co/uc5M7CdXXC
Wealth of Elon Musk
2012: $2,000,000,000
2023: $248,800,000,000
Wealth of Jeff Bezos
2012: $18,400,000,000
2023: $160,900,000,000
Wealth of Mark Zuckerberg
2012: $17,500,000,000
2023: $105,200,000,000
Federal Minimum Wage
2012: $7.25
2023: $7.25
Three words: tax the rich.
The ultimate purpose of education is to change an empty mind into an open one.
If you wanna be a good teacher, teach open-mindedness, teach enthusiasm, inquisitiveness, heuristics, and values.
People always ask what the catalyst will be for the next bull market.
The answer is simple.
Higher prices.
Higher prices create FOMO which pushes prices higher.
Rinse repeat.
Humans gonna human.
10 AI Tools to Maximise Productivity & Save Time:
1. AI Website Builder
https://t.co/eBICDIxhzh
2. AI YT Summaries
https://t.co/H9DD57tXIj
3. AI PDF Summaries
https://t.co/VxiUh8xCAJ
4. Enhance Image
https://t.co/40thPeYTaO
5. AI Meeting notes
https://t.co/4PYCvhbNLh
6. AI Videos
https://t.co/SnKuFN0nbD
7. AI Design
https://t.co/WAHqWYExxc
8. AI Images
https://t.co/YdVcXVxGUu
9. AI Automation
https://t.co/4HiMWM5FJu
10. AI Thumbnails
https://t.co/qGgM5UumZ8