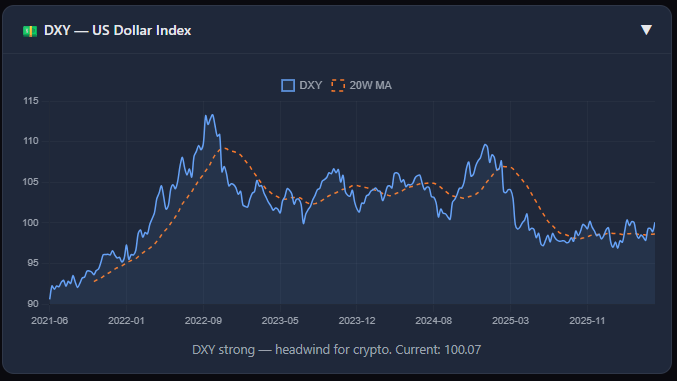
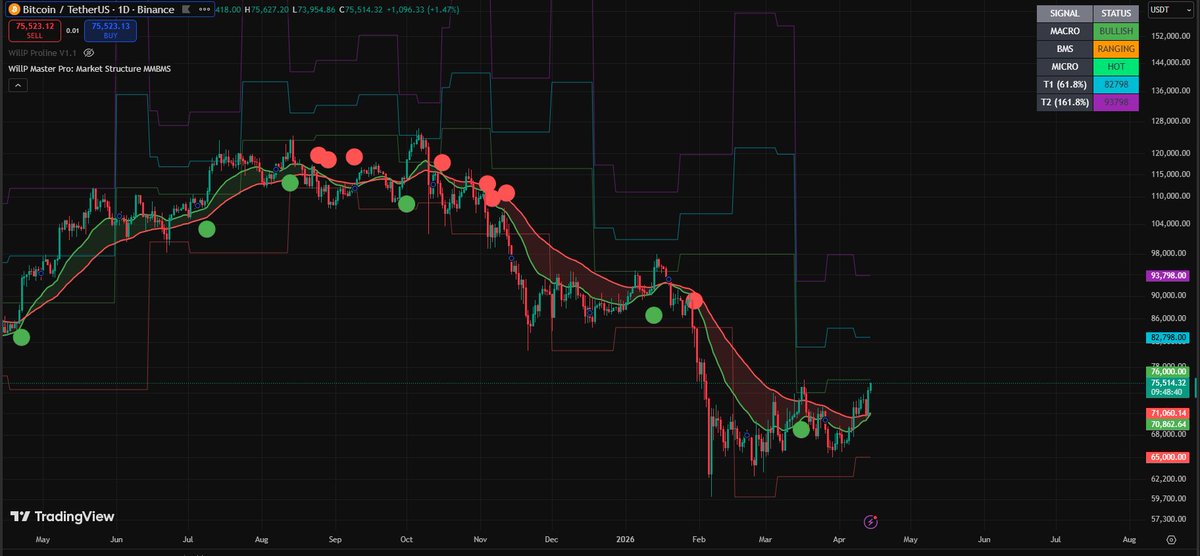
BTC: Seems like we have dipped our toe below the 200WMA, which is bear territory. DXY has strengthened, causing head winds, and my signal indicator dashboard is lighting up like a 'bear' Christmas tree.
Looking at my indicator dash board, a lot of bottoming zones been hit, cycle bottoms suggested 4.5+STD away from ACL centre line. Doesn't mean it can't go lower but it's a trigger to say we are in the zone.
BTC: Bear: Weekly close below the February low.
Momentum making a fresh RSI low while price breaks support. Failure to hold the green accum box $58k. BULL A weekly close back above $76k then $84k.
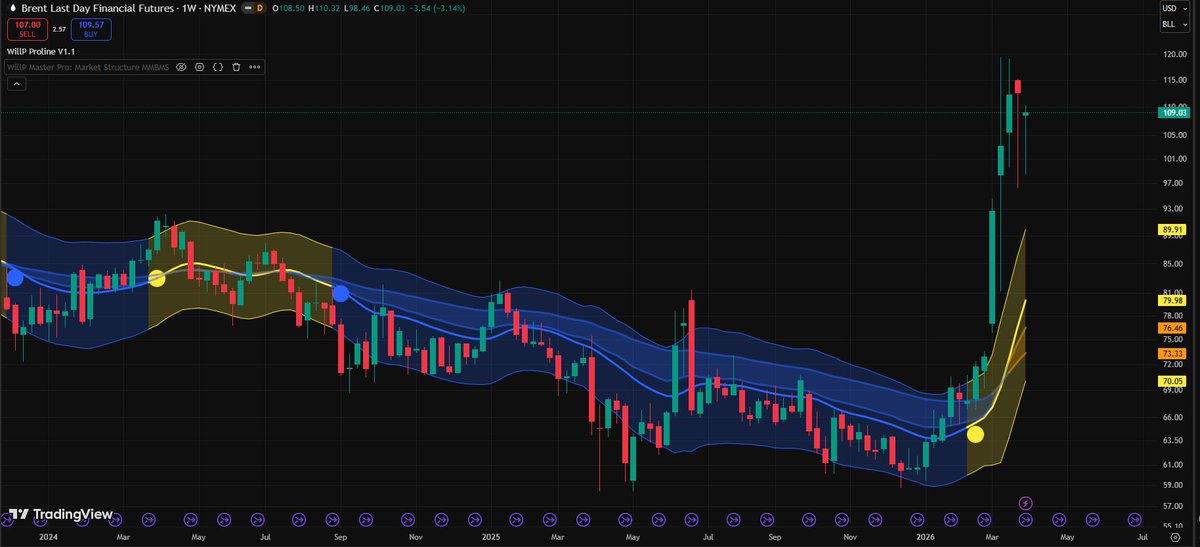
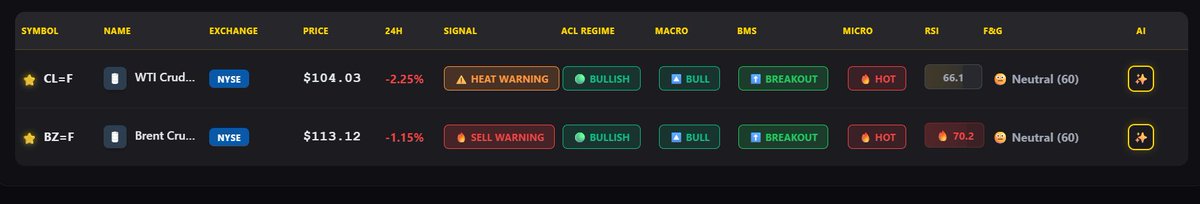
BRENT CRUDE: First bearish blue dots have on the ACL, Macro bearish, Alpha Trend still showing bullish signs on the daily and Macro is still bullish on the weekly, lets see if the flip is real or fake out.
SOL: Its a difficult one, I think from a weekly and daily perspective we are deciding what's next. Weekly still bearish, but my indicator is saying Buy the Dip, Daily still in compression and squeeze yet to decide up or down. ACL Bull on daily but AlphaTrend yet to confirm.
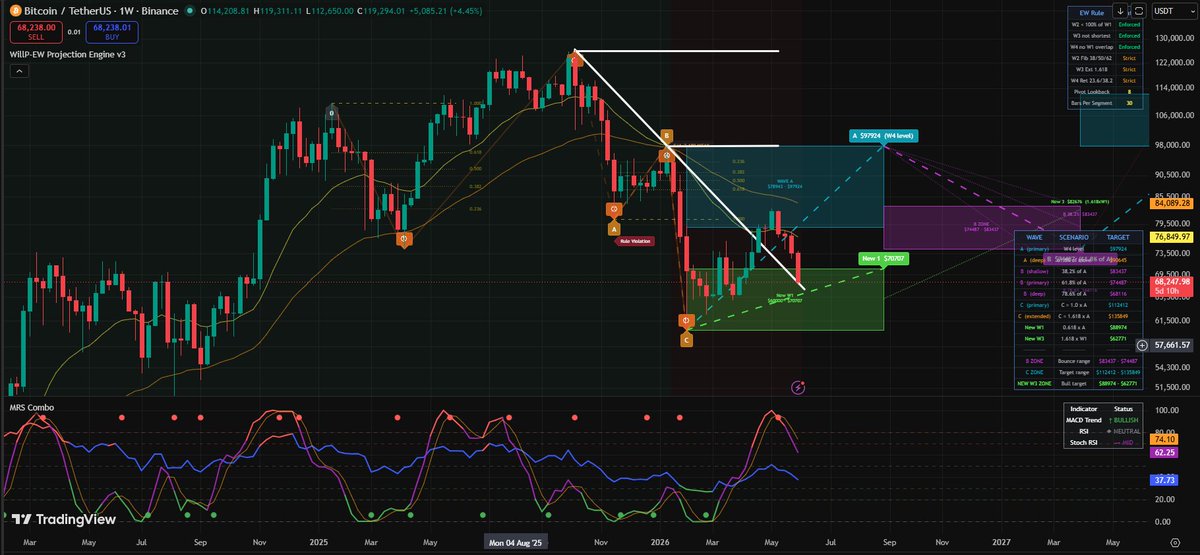
BTC: Don't shoot me, but looking at some Elliot wave counts from a 5 wave top, here are some predictions!!! A wave down to $74500, B wave bounce to circa $106K and C wave down to £54k with slight variations in between. All Potentials.
ETH: On the daily ACL green dots printing bullish setup and now confirmed with Alpha Trend turning orange / yellow. Ceiling height $2464 target T1 $2616
SUI: 2nd green dot on the Daily ACL indicator, grey squeeze on the Alpha Trend. Waiting for that to go yellow and that's double confirmation of Bull setup. Let's go.
SOL: On the daily first green dot printed on ACL, squeeze coming on Alpha Trend line turning grey, when this turns yellow, double confirmation for Bull setup on the Daily.
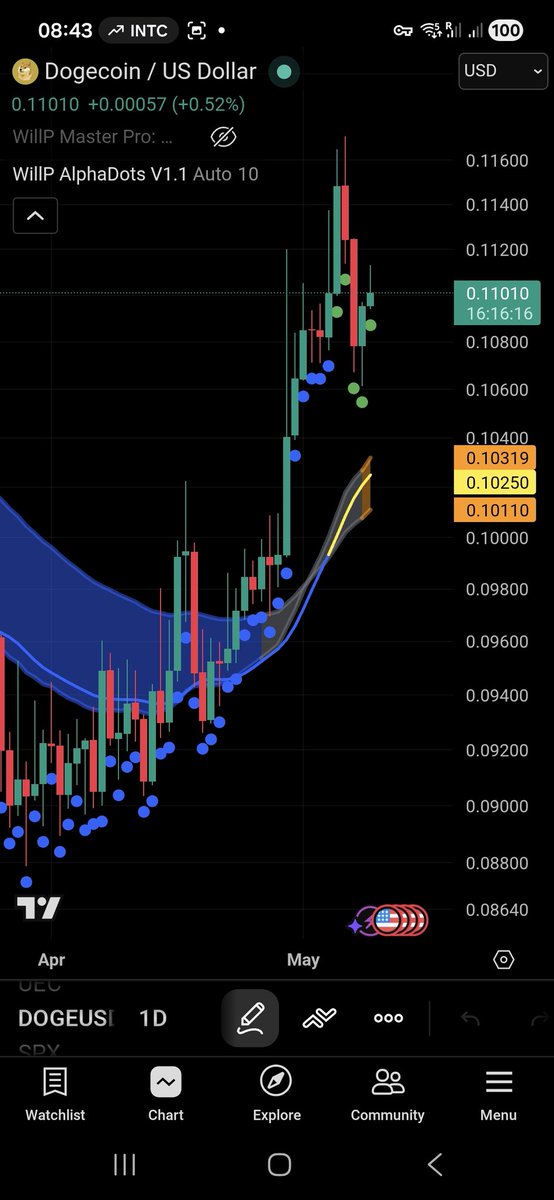
SEI: Are we looking at a very early setup here. Testing Macro, DXY in a squeeze potential move to the downside. M2 rising. If we can confirm above $0.06, with no DXY fake out then, potential setup, looking towards $0.11 (maybe)
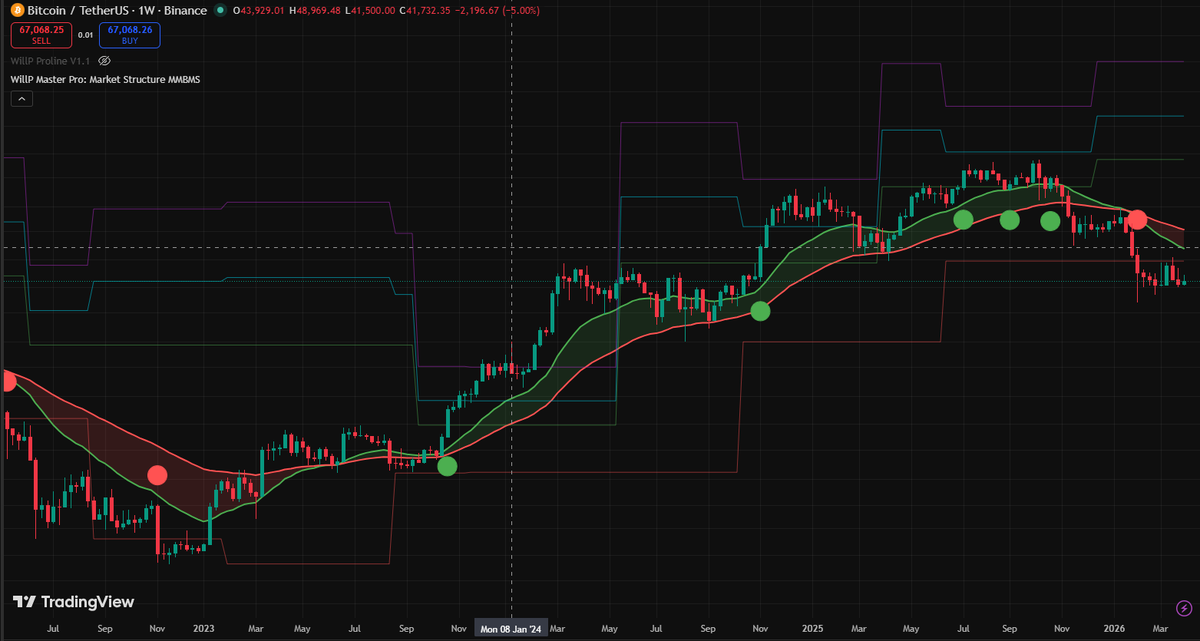
BTC: The ACL Regime is bullish, suggesting a weekly trend in favor of the bulls.The MACRO signal is bearish, indicating that the overall trend direction is still downward.The RSI(14) is at 46.5, which is neutral, and the Fear & Greed index is also neutral.
BZ=F (Trent Crude Oil) Currently at $95.4 dollars, last target top was around $118 dollars, using 61.8% fib level as support at $95.5 now, worth keep an eye on this level, bullish bounce could take it to $100 to $110, monitor closely.
BTC, Watch signal on the weekly, Neutral on the ACL. On the daily showing positive moves price rising above ACL top band and 21EMA teasing 50EMA for a cross. Weekly and Daily need to align to be 100% bullish.
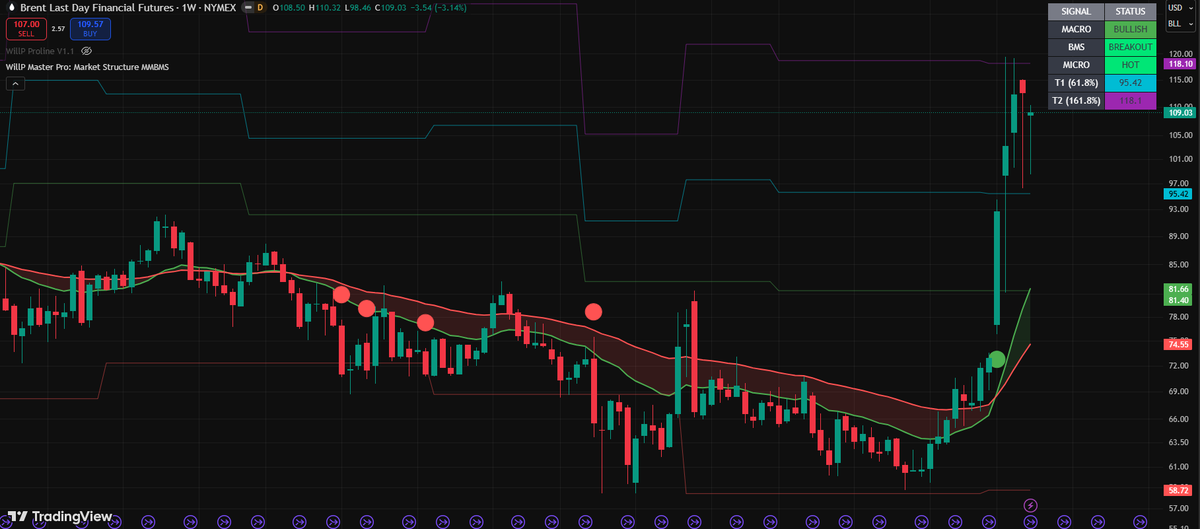
BZ=F (TRENT) bullish trend continues, with the ACL and MACRO signal confirming a bullish outlook. The RSI of 80.5 asset is overbought, but the BMS breakout signal indicates potential for further upside. Given the hot MICRO signal, nears term price target range could be $110-$115
BTC is Bearish, ACL and macro signals indicating downside pressure. An RSI of 33.3 oversold conditions, which could trigger a short-term bounce, but micro signals and BMS point to continued weakness. Near term, BTC may range between $60K and $70K, though this remains uncertain.
FET's current price is $0.2438 with a 5.91% increase in 24 hours. The BMS signal indicates a ranging market, suggesting a potential trading range. A reasonable price target range for FET could be between $0.22 and $0.28, considering the current RSI and sentiment.
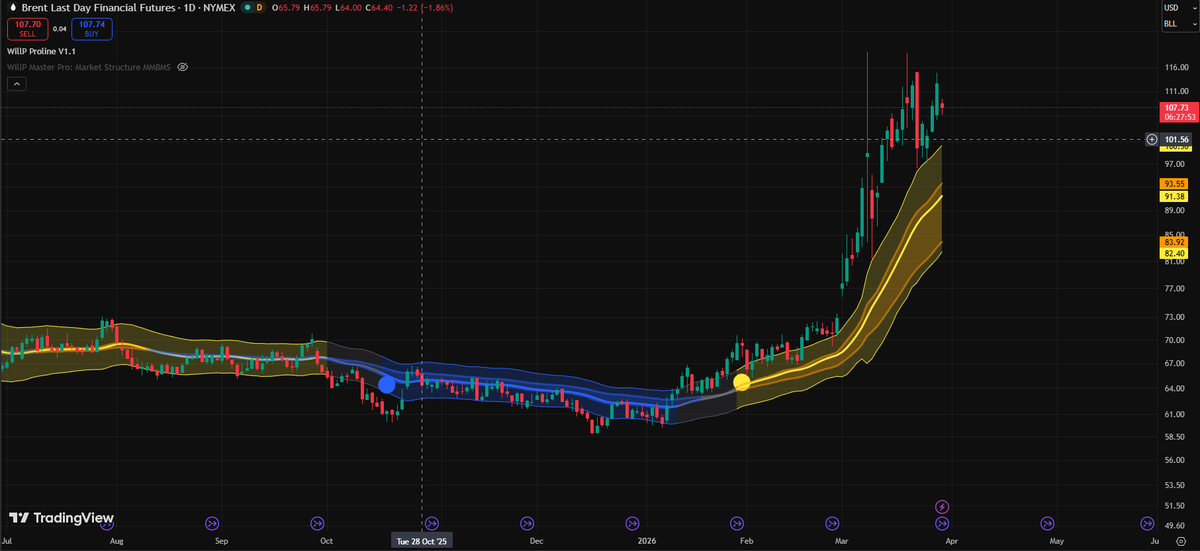
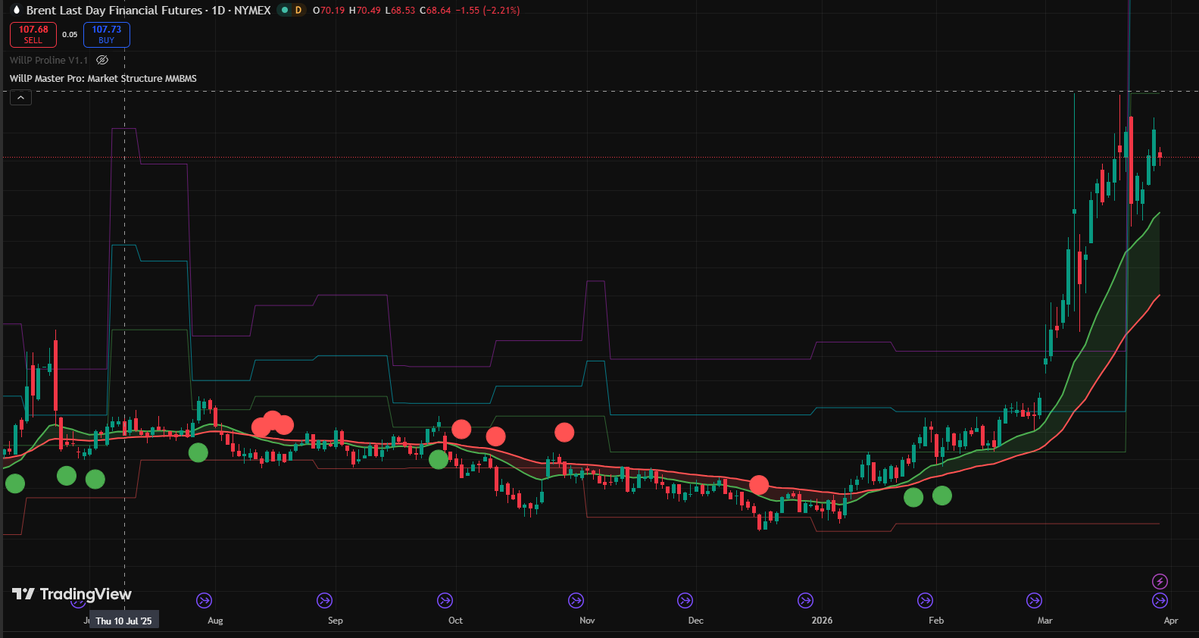
Daily Chart, BZ=F (Brent) dropped ~3.9% in 24h despite a broader bullish trend.
Momentum signals hint at a possible rebound, but RSI ~79 shows overbought conditions.
Upside target: $110–115; downside support: $105–100.