ACCESS GRANTED 📲
iOS USER GUIDE | START FROM THE DOWNLOAD.
// Tips for Your XP Journey:
1. Go to: https://t.co/SfsqhIfWRg
2. Download: via TestFlight
3. Install: XP App
Don't just watch the market → join it.
🔲 XP BREAKING NEWS: #Bitcoin Has 125 Days Until the Real Bottom • Charts Warn
// Quick Take:
• bitcoin:native currently navigates a 50% drawdown from peak valuation while multiple cyclical models confirm the fundamental 4 year market structure remains entirely intact.
• Historical halving data and advanced spiral analysis simultaneously project the definitive market bottom to materialize in approximately 125 days aligning closely with October 2026.
• Critical moving averages have flipped into overhead resistance leaving recent spot accumulators underwater and forcing a slow time based capitulation.
// Core Extraction:
A profound convergence of independent analytical frameworks indicates the digital asset has not yet reached its terminal cycle low.
The market is currently driven by four critical structural factors.
(1) The Halving ClockEvaluating historical rhythms analysts highlight that every preceding cycle established its absolute bottom near day 900 post halving. Positioned at day 775 today this leaves a precise 125 day window before historical capitulation targets open.
(2) The Cyclical SpiralThis timeline aligns perfectly with visual spiral models which confirm that despite new institutional narratives the foundational geometry continues to repeat. These metrics project a highly probable accumulation floor descending into the $40000 target band.
(3) The Overhead ResistanceEssential pricing levels including the 21 week simple moving average and the short term holder cost basis have transitioned into formidable resistance. Operating below the $77000 cost basis signals that recent buyers are underwater amplifying overarching selling pressure.
(4) The Breakout RequirementThe structural burden of proof now sits entirely with the bulls. A weekly close decisively reclaiming the $78900 threshold is the absolute minimum requirement to formalize a breakout and invalidate this downward trajectory.
→ Key observations moving forward:
░ The structural capacity of the $40000 projection band to absorb the final phases of cyclical capitulation.
░ The critical necessity of a weekly reclaim above $78900 to formally signal returning institutional momentum.
Decode the cycle.
Master the timing.
Follow us to dissect market dynamics in real time. @wwwxpcom 🔔
#MarketSignals #XPInsight #CryptoData #Web3
🔲XP MARKET UPDATE 📊 June 08
➡ Market sentiment indicates a structural recovery as systematic accumulation accelerates across global risk networks.
➡ Positive capital inflows trigger an intensive risk on rotation pushing open interest up significantly while macroeconomic liquidity seeks high growth positioning.
// Quick Take:
• ethereum:native & solana:So11111111111111111111111111111111111111112 record the steepest expansions with strong surges of 5.61% and 4.76% respectively.
This confirms aggressive liquidity returning to higher beta layer one ecosystems and smart contract platforms as market participants confidently re risk portfolios.
• bitcoin:native demonstrates expected gravitational dominance amid a broader capillary recovery posting a 2.47% increase. After wiping out over leveraged positions the network efficiently absorbs returning spot buying pressure to reclaim the 63,000 threshold.
• binancecoin:native & ethereum:0x75231f58b43240c9718dd58b4967c5114342a86c undergo a calculated structural rebound navigating upward by 3.97% and 3.67%. Renewed institutional positioning remains evident as platform utility assets mark consecutive inflows amid a wider digital asset market recovery.
• ripple:native litecoin:native cardano:native and ethereum:0x7fc66500c84a76ad7e9c93437bfc5ac33e2ddae9 experience tightly synchronized uptrends cascading between 1.14% and 3.06%. This uniform asset expansion is amplified by multi chain accumulation rather than asset specific catalysts while decentralized finance platforms absorb returning capital flows.
Understand the market and invest with XP now. 👋🏻
#XPInsight #MarketSignals #CryptoData #Web3 #TradePlan
@DDEX__Official Exactly. You read our data perfectly.
The on chain numbers always front run the mainstream narratives and smart capital knows exactly where to position itself first.
🔳 XP ACADEMY | TRADING MECHANICS 🔰
➡ SPOT TRADING | The Foundation of Ownership
Engage with the fundamental layer of digital asset markets where transactions settle immediately with actual asset custody.
1) Real Asset Ownership
Purchasing on the spot market means you take direct possession of the underlying token securing legal rights such as voting for major network upgrades or participating in staking ecosystems.
2) Instant Execution
Orders are fulfilled instantly matching immediate supply and demand. You exchange fiat or other digital assets directly aiming to profit purely from long term capital appreciation without the complexities of holding costs.
3) Continuous Market Access
Operate within a completely unrestricted trading environment giving you the absolute freedom to buy sell or hold your assets twenty four hours a day seven days a week.
➡ FUTURES TRADING | Advanced Capital Efficiency
Execute sophisticated market strategies by trading derivative contracts that represent specific cryptocurrency values without ever holding the underlying physical asset.
1) Amplified Leverage
Multiply your market exposure with exceptional capital efficiency. Utilize up to 200x leverage to open substantial positions at a fraction of the total cost unlike spot markets which require full capital allocation.
2) Bidirectional Speculation
Capitalize on pure market volatility by going long during upward momentum or executing short sales to profit from declining prices. This flexibility allows traders to build complex hedging strategies against market downturns.
3) Deep Liquidity And Risk Control
Benefit from a highly liquid market environment processing massive global volume which ensures minimal slippage. Navigate advanced pricing mechanisms and utilize exchange insurance funds to manage your portfolio risks effectively.
Understand the mechanics.
Choose your instrument.
Execute the strategy.
...🪙⏭📈
#XPAcademy #Spot #Crypto #Futures #TradingTips
📰 XP Weekly Recap | Capital Gravity & Compliance
:: Market Read
Capital remains heavily anchored in apex assets to dictate the broader financial architecture amidst extreme fear and accelerated deleveraging.
:: Macro Metrics
■ Global Crypto Market Cap consolidates at 2.25T with a 24 hour trading volume of 130B.
■ Bitcoin Dominance holds at 55.7% confirming an institutional flight to quality.
■ bitcoin:native retracts by 2.3% to a 1.251T valuation while spot ETFs conclude a 13 day consecutive outflow trend with a renewed 2.69 million dollar net positive allocation.
■ ethereum:native experiences a 4.0% correction down to 209.27B despite welcoming 18.87 million dollars in positive ETF inflows.
■ binancecoin:native and ripple:native face synchronized drawdowns of 3.4% and 4.7% respectively signaling liquidity extraction from alternative ecosystem assets.
:: Industry Drivers
■ Standard Chartered maintains its 100,000 dollar Bitcoin target for 2026 highlighting resilient macro conviction.
■ United Kingdom lawmakers urge the Bank of #England to ease #stablecoin rules to protect digital market growth.
■ @binance blurs the line between traditional and digital finance by launching United States stocks and ETF trading.
■ @ether_fi deploys 100 million dollars into the @plumenetwork to unlock institutional grade RWA yield instruments.
Watch the liquidity.
#XPRecap #Markets #CryptoData #DailyNews #Web3
🔲 XP ACADEMY | CANDLESTICK MECHANICS🔰
➡️ THE ANATOMY | Decoding Market Data
Follow this exact sequence to read any standard candlestick structure like a professional trader.
1) The Real Body
Look at the thick colored section first to identify the open and close prices which immediately shows who won the battle between buyers and sellers.
2) The Upper Wick
Check the thin vertical line above the body to find the absolute highest price buyers pushed the asset during that specific timeframe.
3) The Lower Wick
Inspect the thin line below the body to see the lowest point sellers managed to reach before bullish demand stepped back in.
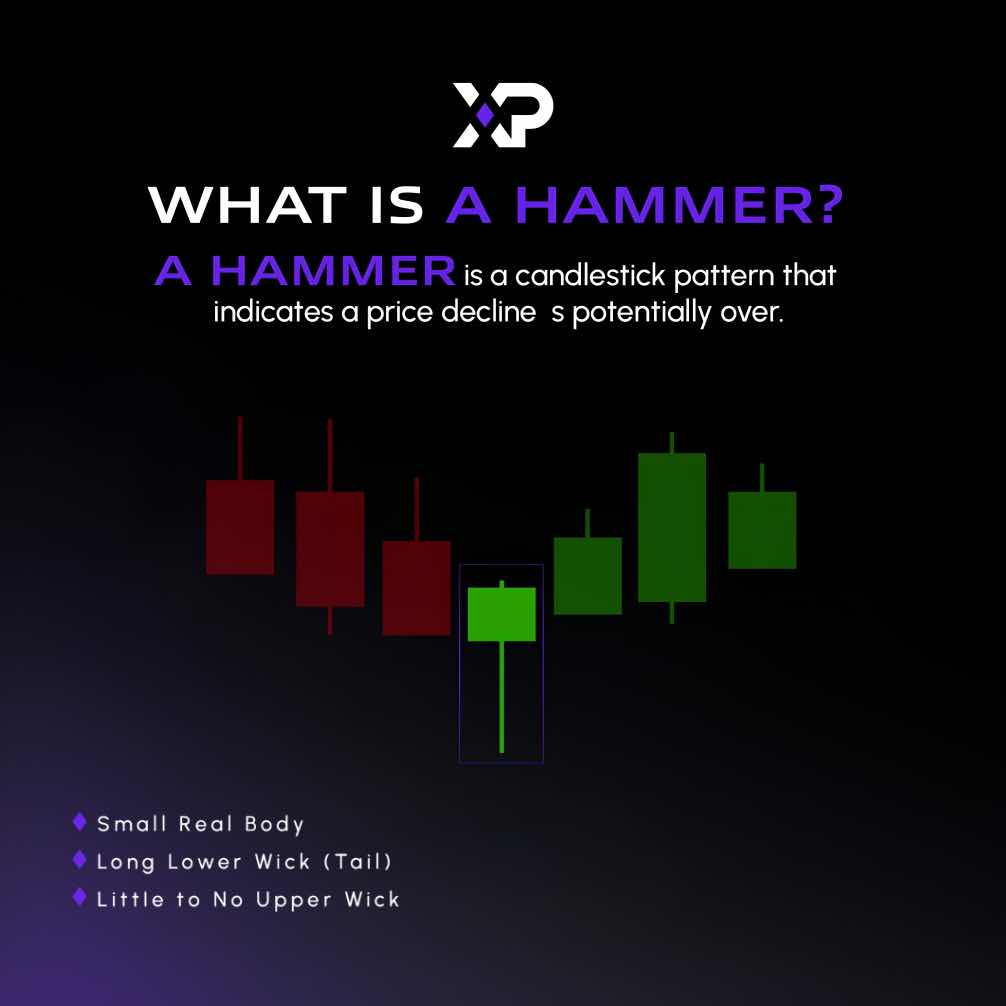
➡️ THE HAMMER | Spotting The Reversal
A Hammer indicates a price decline is potentially over. Identify this critical pattern through this four step visual checklist.
1) Spot the Trend
Confirm the asset is currently experiencing a definitive downward trajectory before looking for the pattern.
2) Check the Body
Locate a remarkably small real body positioned at the very top of the candlestick structure.
3) Analyze the Wicks
Ensure there is little to no upper wick alongside an extended long lower tail.
4) Decode the Signal
Recognize that the long lower wick proves sellers aggressively pushed prices down but overwhelming bullish demand entirely absorbed the pressure and forced a reversal.
Read the data.
Spot the signal.
Execute the strategy.
...🕯⏭📈
#XPAcademy #MarketAnalysis #Web3Trading #Hammer #Candlestick
🔲 XP ACADEMY | CANDLESTICK MECHANICS🔰
➡️ THE ANATOMY | Decoding Market Data
Follow this exact sequence to read any standard candlestick structure like a professional trader.
1) The Real Body
Look at the thick colored section first to identify the open and close prices which immediately shows who won the battle between buyers and sellers.
2) The Upper Wick
Check the thin vertical line above the body to find the absolute highest price buyers pushed the asset during that specific timeframe.
3) The Lower Wick
Inspect the thin line below the body to see the lowest point sellers managed to reach before bullish demand stepped back in.
➡️ THE HAMMER | Spotting The Reversal
A Hammer indicates a price decline is potentially over. Identify this critical pattern through this four step visual checklist.
1) Spot the Trend
Confirm the asset is currently experiencing a definitive downward trajectory before looking for the pattern.
2) Check the Body
Locate a remarkably small real body positioned at the very top of the candlestick structure.
3) Analyze the Wicks
Ensure there is little to no upper wick alongside an extended long lower tail.
4) Decode the Signal
Recognize that the long lower wick proves sellers aggressively pushed prices down but overwhelming bullish demand entirely absorbed the pressure and forced a reversal.
Read the data.
Spot the signal.
Execute the strategy.
...🕯⏭📈
#XPAcademy #MarketAnalysis #Web3Trading #Hammer #Candlestick