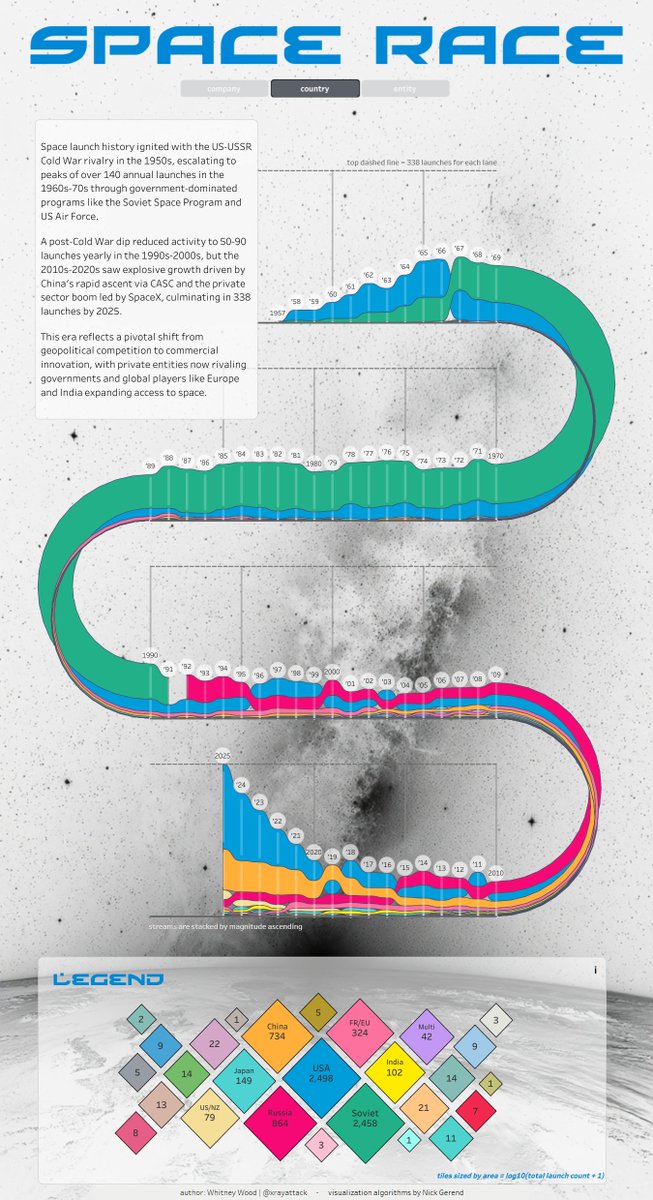
🚨New #dataviz on the Space Race! Explore launches from 1957-2025 by country, company, and entity.
🔗: https://t.co/QNTFH7XDsL
🛠️: visualization algorithm by Nick Gerend
#datafam#tableau#python#streamgraph
Introducing the 2026 Tableau Ambassadors. 🎉
These 357 community leaders teach, share, innovate, and inspire everyone with data.
Meet this year's Ambassadors: https://t.co/yzoCbzgDL1
#TableauAmbassador
New game announced where your cat companion has its own mood swings
- You share the same heartbeat
- You name it Mio after the sound it makes
- The Sentinels are hunting your cat
- It grows giant and you can ride it
Game is Ylem's Cat
Hosted Tableau MCP is live in the Tableau Community Slack workspace! 🙌
Ask questions, check Pulse metrics, and pull insights from your governed Tableau Cloud data—all inside Slack.
Join the Community and get started: https://t.co/Ko7ROdPfe3
Hey #datafam, new blog up on #Medium! - Behind the Viz: “California Quakes 2019” with Python and Tableau. A complete code and #Tableau build walkthrough.
https://t.co/AjDEFwascX
#dataviz#python
Applications and nominations for the next Tableau Ambassador cohort are open! 🎉
Tableau Ambassadors create opportunities for connection, growth, and inspiration.
Apply by July 16: https://t.co/Tm2BjYQH1H
In this #VizOfTheDay, @xrayattack delivers a geospatial analysis of a month-long California earthquake sequence.
Through interactive map layers and chronological data tracking, the dashboard visualizes the magnitude distribution and frequency of the historic Ridgecrest shocks.
Explore the viz on Tableau Public: https://t.co/5wJ9EnR4v7