Founded one of the first synthetic grass & golf systems companies in the US in 1998. I consult on large golf systems projects world-wide. Avid crypto investor.
@Scarfacelion09 @trader_yun Based on chart history, all I can tell you is that it's at an attractive price and has been for awhile. I don't look for assets to "pump". I look for assets that will appreciate nicely over a reasonable period of time. Patience is what will make you wealthy, not a pump!
Let's take a look at #LTC on the macro to put things into perspective. Often, when there's a market bottom, you can see a dip below a long term respected structure to flush out weak hands.
If Litecoin fell to the .786 macro fib level, that's 20% below the macro trend support. A move like that will typically recover back into structure relatively quickly since it's designed to liquidate leverage traders and late shorts.
I don't see it falling to the next order block as that would be a 45% drop below structure and there's no justification for that type of a move unless we saw some type of black swan.
@RegtWillem There are never any guarantees, only probabilities. Price cascaded beyond what TA can show. Panic selling and stop orders being taken out caused price to go much lower.
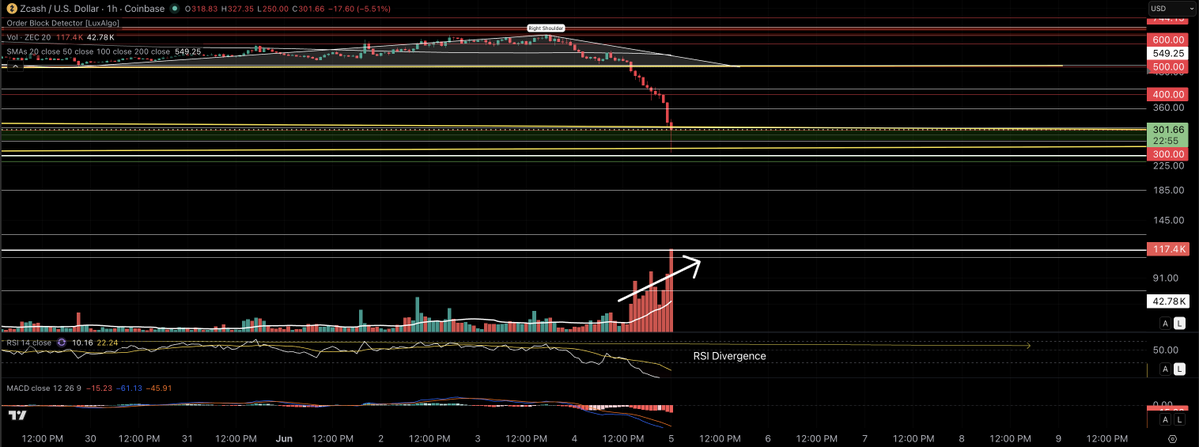
Just be aware that a #ZEC relief bounce could take price as high as $350 to $400 up to the .382 fib level. It can easily fall back down from there as it targets the large liquidity zone below!
@trader_yun That's certainly possible and maybe even this year. Like Zcash was, it has been in a multi-year compression structure. The entire market this year really depends on how geo-politics play out.
If you ever wondered what volume expansion looked like, this is one of the best examples I've seen in awhile. Unfortunately, it's to the downside but it works both ways!
What you're seeing now with #ZEC is most likely a relief bounce so don't think it's going to turn around and go to the moon!!
The area of interest are the huge order block sections in green I've marked here with the rectangle. This is where a ton of liquidity resides.
We need to see price settle in and accept somewhere and range in that area for a period. The volatility of this asset is off the charts currently!
#ZEC is now at the point where this drop is being driven by panic, fear, and a cascade effect due to stops getting destroyed. It fell through structure like it wasn't even there so I can't tell you how low this thing will go at this point!
Most likely, price is heading towards the most liquidity, which is the very large, green order block area below.
#ZEC price bounced right off the top of the upper rail of the macro structure as I indicated it might. $300 is just below the rail. Lot's of confluence here so this is the level to watch for now.
@Puer_Homme I don't know about that. It's an asset that has had major parabolic runs without an appropriate correction to reset a base. This was bound to happen eventually. Price always goes where liquidity is.
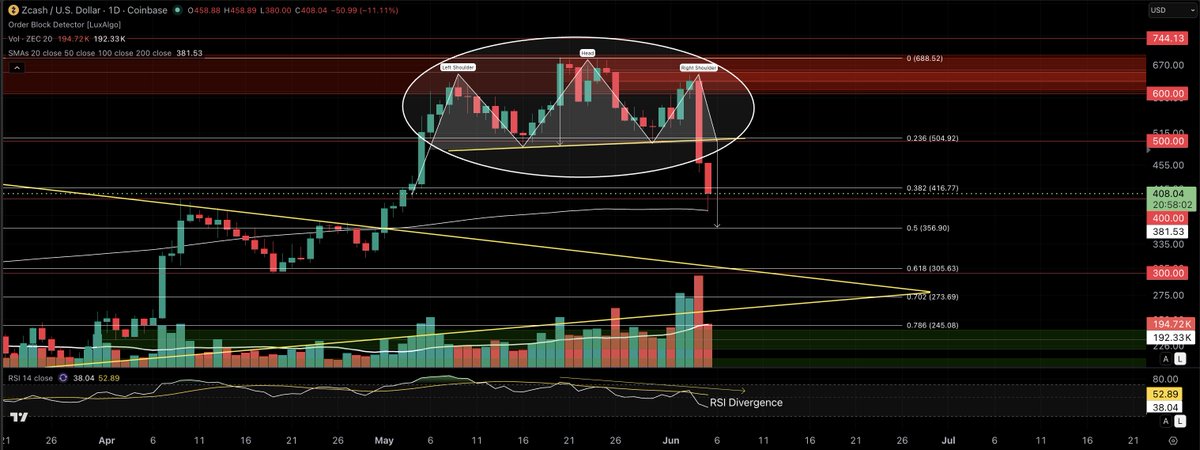
Guys, understand the following so that in the future you don't confuse narrative with structure.
This structure I have circled, developing directly into major HTF resistance, is what my warning signal was about. Long before the Head & Shoulders formed, I was talking extensively about the need for a correction to at least the $400 area. That was weeks before today's #ZEC news narrative hit the wire.
Structure tells the story.
Narratives are usually just the reason people assign to the move after it has already started.
Structure first. Narratives follow.
Always.
Price has now tagged the 200 SMA on the daily and reached the area I've been discussing for quite some time. Will that be enough to stop the decline? I don't know.
What I do know is that this correction has finally brought price back into an area where a healthier foundation can begin to form. That's important if Zcash is ultimately going to make higher highs.
Scared investors sell bottoms.
Experienced investors look for areas where risk begins decreasing and reward begins increasing.
The next few weeks should be very interesting!
@Puer_Homme I gave my targets in an earlier post. Around $300 is the most logical but no guarantee it even holds there. I can't tell you exactly where the bottom will be. No analyst can.
@Puer_Homme That can simply be a bear flag. Where the triangle is located is important. Whether it's during a down trend or an uptrend makes a difference. Those don't always break up.