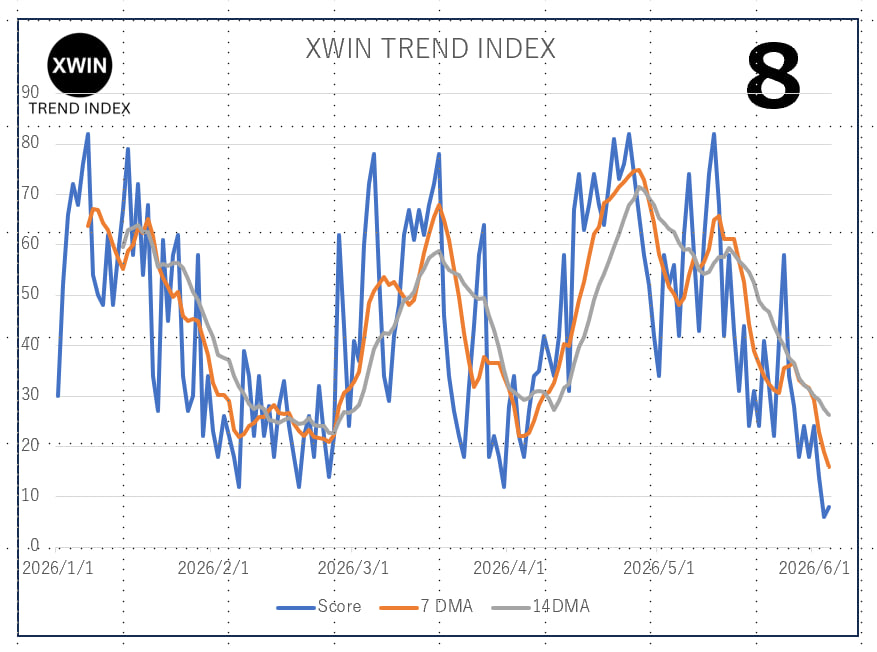
XWIN Trend Index Signals Trouble: Bitcoin Market Hits Record Low Score of 6 via @cryptoquant_com(Report-#306)
The XWIN Trend Index is a proprietary indicator that evaluates Bitcoin market conditions using CryptoQuant on-chain data, ETF flows, derivatives positioning, sentiment, macro conditions, and institutional activity.
Unlike price-based indicators, it is designed to assess the forces driving future market direction and has historically functioned as a leading indicator for roughly 2–4 weeks ahead.
The first half of 2026 featured two major recovery attempts. The index reached 82 in January and again in May as ETF inflows improved, whale accumulation increased, exchange reserves declined, and regulatory optimism surrounding the CLARITY Act grew.
However, both rallies ultimately failed.
The reason was simple: demand never fully returned.
Recent CryptoQuant data shows persistent weakness across several key indicators. Coinbase Premium remains negative, signaling weak U.S. spot demand. Spot Bitcoin ETF flows have turned sharply negative, while exchange inflows have increased as short-term holders realize losses and move BTC onto exchanges.
At the same time, network activity has slowed, spot trading volumes remain weak, and derivatives markets continue to show elevated leverage relative to actual demand.
Another warning came from the 14-day moving average of the XWIN Trend Index. While daily readings briefly returned above 80 in May, the moving average had already started flattening, suggesting that market momentum was weakening beneath the surface.
By June 3, the index had collapsed to 6.
Unlike 2022, this is not a structural crisis. ETFs exist, institutional ownership remains strong, and regulatory progress continues. The issue is not infrastructure—it is demand.
The next major signals to watch are ETF flows, Coinbase Premium, spot trading volume, and continued progress of the CLARITY Act.
The first half of 2026 can be summarized in one sentence:
Regulation advanced, but demand failed to follow.
https://t.co/DCDb3mabaG
📊【XWIN TREND INDEX | June 4, 2026】
Overall Score: 8 / 100
• 80–100 = Strong Uptrend
• 60–79 = Moderately Bullish
• 40–59 = Neutral / No Clear Direction
• 20–39 = Moderately Bearish
• 0–19 = Strong Downtrend
7-Day Moving Average: 16.00 / 100
14-Day Moving Average: 26.29 / 100
Market Direction: Strong Downtrend
"The score remains significantly below both the 7-day and 14-day moving averages, confirming continued deterioration in both short- and medium-term trends. The market remains characterized by a lack of buyers rather than excessive selling."
―――――――――――――――――――
Market Summary
• BTC briefly fell below $66,000, testing a critical support zone
• Spot BTC ETFs recorded their 12th consecutive trading day of net outflows
• BTC ETFs saw approximately $445 million in daily outflows and $1.93 billion over the past 7 days
• ETH ETFs recorded approximately $313 million in net outflows over the past week
• ETH fell below $1,800, reaching its lowest level in nearly three months
• Approximately $1.29 billion in crypto positions were liquidated during the past 24 hours
• More than $1.07 billion of those liquidations were long positions
• Market attention has shifted toward the defense of the $65,000 demand zone
―――――――――――――――――――
On-Chain & Technical Trends
• Coinbase Premium remains weak and in negative territory
• U.S. institutional spot demand continues to be subdued
• IBCI remains at 9.52, maintaining its Accumulation Zone status
• SSR has declined to 10.6, indicating substantial dry powder remains in the system
• Short-Term Holder (STH) capitulation has reached one of the highest levels of 2026
• Approximately 53,800 BTC were transferred to exchanges at a loss
• Exchange BTC reserves continue to rise, signaling potential sell-side pressure
• Market structure is currently classified as "Fragile / Distribution"
―――――――――――――――――――
Sentiment
• Crypto Fear & Greed remains in Extreme Fear territory
• Predictions of BTC falling below $60,000 are increasing
• Retail investor capitulation appears to be accelerating
• Meanwhile, some whales have started accumulating again
• Whale vs. Retail Delta is trending upward
• BTC CVD data shows signs of whale buying activity
• Market sentiment remains overwhelmingly pessimistic
• Historically, extreme fear has often preceded major recoveries
―――――――――――――――――――
U.S. Traditional Markets
• The S&P 500 remains near all-time highs
• The NASDAQ continues to be supported by AI-related stocks
• Capital continues flowing heavily into the technology sector
• AI-focused ETFs remain strong beneficiaries of investor inflows
• Ray Dalio has warned about potential signs of an AI bubble
• The divergence between equities and crypto continues to widen
• The U.S. Department of Justice has launched an investigation into parts of the private credit market
• This week's key macro event is the U.S. Non-Farm Payrolls (NFP) report
―――――――――――――――――――
Overall Assessment
Bitcoin remains in a correction driven primarily by weak demand rather than aggressive selling pressure. Twelve consecutive trading days of ETF outflows, a persistently negative Coinbase Premium, and rising exchange inflows all point to continued weakness in spot-market demand.
At the same time, IBCI remains firmly within the accumulation zone, SSR continues to decline, and early signs of whale accumulation are emerging. Combined with the extreme capitulation among short-term holders, several indicators associated with historical bottoming phases are beginning to appear.
Key Factors to Watch Today
• Defense of the $65,000 demand zone
• Potential reversal in BTC ETF flows
• Recovery in Coinbase Premium
• Further deleveraging in Open Interest (OI)
• Progress of the CLARITY Act
• Stabilization of Short-Term Holder selling pressure
Current Conclusion
The market remains in a strong downtrend. However, with an overall score of 8 compared to a 7-day moving average of 16.00 and a 14-day moving average of 26.29, investor fear has reached one of its highest levels of 2026. While short-term relief rallies remain possible, a sustainable trend reversal will require a recovery in ETF flows and a return of genuine spot-market demand.
#Bitcoin #BTC #Crypto
#XWINTrendIndex #OnChainAnalysis
#ETF #InstitutionalFlows #DigitalAssets
#MarketStructure #CryptoResearch #xWINResearch
📊【XWIN TREND INDEX | June 3, 2026】
Overall Score: 6 / 100
• 80–100 = Strong Uptrend
• 60–79 = Moderately Bullish
• 40–59 = Neutral / No Clear Direction
• 20–39 = Moderately Bearish
• 0–19 = Strong Downtrend
Market Direction: Strong Downtrend
"Record ETF outflows, BTC breaking below $67,000, and cascading long liquidations have pushed the market into extreme fear territory. However, contrarian investors are beginning to monitor potential accumulation opportunities."
―――――――――――――――――――
Market Summary
• BTC fell below $67,000, reaching its lowest level since April
• More than $1.2 billion in crypto positions were liquidated over the past 24 hours
• Spot BTC ETFs recorded approximately $480 million in daily outflows and $1.78 billion in weekly outflows
• U.S. spot BTC ETFs have now experienced 11 consecutive trading days of net outflows, totaling $3.45 billion
• Geopolitical tensions and weak ETF demand continue to pressure the market
• ETH also fell below $1,900
• The performance gap between U.S. equities and crypto assets continues to widen
• Market attention has shifted toward the $66,000–$65,000 demand zone
―――――――――――――――――――
On-Chain & Technical Trends
• Coinbase Premium remains in negative territory, signaling weak U.S. institutional demand
• IBCI has dropped to 9.52, remaining within the Accumulation Zone
• Bitcoin demand is shrinking at an annualized pace of approximately 232,000 BTC per month
• Short-Term Holders (STH) transferred more than 38,000 BTC to exchanges
• Over 35,000 BTC were reportedly sold at a loss
• Exchange inflows from 6–12 month holders continue to rise
• Retail investor BTC inflows into Binance have surged to approximately $9.2 billion
• The $66,000–$65,000 range is now viewed as the primary support zone
―――――――――――――――――――
Sentiment
• Social media sentiment has reached Extreme Fear levels
• Predictions of BTC falling below $60,000 are increasing rapidly
• Strategy’s sale of 32 BTC continues to weigh on investor psychology
• Long-position liquidations are accelerating
• Approximately 195,000 traders have been liquidated
• Retail investor capitulation appears to be underway
• Whale investors remain relatively calm and continue holding positions
• Historically, periods of extreme pessimism have often been followed by relief rallies
―――――――――――――――――――
U.S. Traditional Markets
• The S&P 500 closed at a new all-time high
• Total S&P 500 market capitalization reached a record $69 trillion
• Capital continues flowing into AI-related stocks
• U.S. equities are on track for a tenth consecutive week of gains
• Equity ETF inflows remain strong
• Traditional markets continue to outperform digital assets significantly
• Reports of ongoing U.S.–Iran negotiations have slightly eased geopolitical concerns
• This week’s Non-Farm Payrolls (NFP) report remains the key macroeconomic event
―――――――――――――――――――
Overall Assessment
Bitcoin is currently experiencing a demand-driven correction rather than a selling-driven collapse. ETF outflows, weak Coinbase Premium readings, and large-scale loss realization by short-term holders have created one of the weakest demand environments seen in 2026 so far.
At the same time, social sentiment has reached extreme fear levels, while IBCI remains firmly within the accumulation zone. Historically, similar conditions have often marked important observation points for long-term investors. Fear is reaching an extreme, but so is the potential for future opportunity.
Key Factors to Watch Today
• Defense of the $66,000–$65,000 demand zone
• Whether ETF outflows begin to slow
• Coinbase Premium recovery
• Stabilization of liquidation activity
• Progress of the CLARITY Act
• Positioning ahead of the U.S. employment report
Current Conclusion
The market remains in a strong downtrend. However, investor fear has reached one of the highest levels of this cycle, and a short-covering rally would not be surprising. While the broader trend remains bearish, conditions associated with long-term accumulation are beginning to emerge.
#Bitcoin #BTC #Crypto
#XWINTrendIndex #OnChainAnalysis
#ETF #InstitutionalFlows #DigitalAssets
#MarketStructure #CryptoResearch #xWINResearch
eading Bitcoin in June: CryptoQuant On-Chain Data Signals a Critical Turning Point via @cryptoquant_com
(Report-#305)
When analyzing Bitcoin in June, price alone is not enough. The key is understanding what is happening beneath the surface through on-chain data.
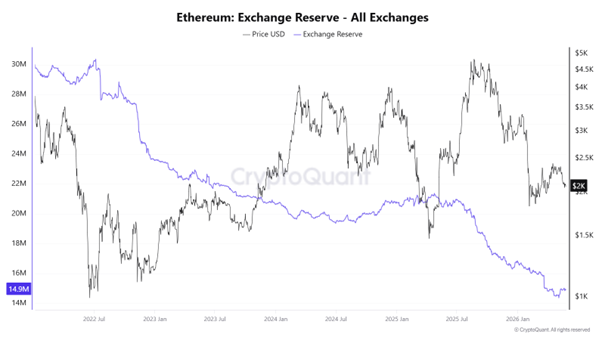
One of the most important indicators is Exchange Reserve, which measures how much BTC is available on exchanges for potential selling. Exchange balances continue to decline, suggesting that investors are moving coins into long-term storage. Lower exchange supply is generally considered a bullish signal because fewer coins are immediately available for sale.
Another positive sign comes from the Stablecoin Supply Ratio (SSR). This indicator helps estimate how much stablecoin capital is waiting on the sidelines. A lower SSR typically means there is still significant buying power available. Current levels suggest that liquidity remains available if market sentiment improves.
However, caution is warranted. The Coinbase Premium Index, which reflects the price difference between Coinbase and offshore exchanges, remains weak. Because Coinbase is widely used by U.S. institutions, a positive premium often signals institutional buying. Despite Bitcoin’s recent rebound, strong institutional demand has yet to appear.
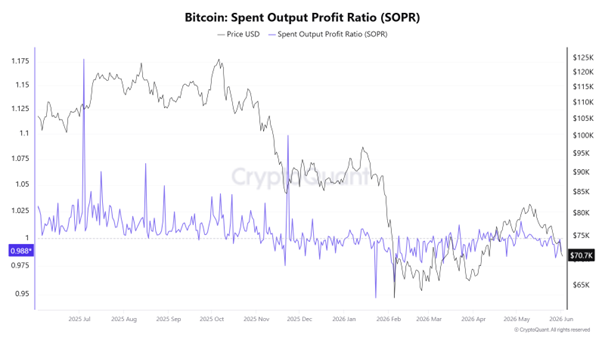
SOPR, which measures whether investors are realizing profits or losses, is also hovering near neutral levels. This indicates that market participants are not aggressively taking profits, but confidence remains limited.
Meanwhile, Open Interest in futures markets has started to cool after its rapid rise in May. This reduces excessive leverage and lowers liquidation risk, creating a healthier market structure.
MVRV, a measure of investor profitability, continues to rise but remains below historical overheating levels. This suggests growing unrealized profits without clear signs of a market top.
Overall, June presents a mixed picture: supply conditions are bullish, but demand remains insufficient. The most important indicators to watch are ETF flows, Coinbase Premium, SOPR, and Exchange Reserves. If institutional demand returns and ETF inflows accelerate, Bitcoin could enter its next major uptrend. If not, the current rally may prove temporary.
June may become one of the most important turning points for Bitcoin in 2026.
https://t.co/Ds9c4blKks
Has Michael Saylor Turned Bearish? — The Truth Behind Strategy’s 32 BTC Sale and Its New Bitcoin Model via @cryptoquant_com
https://t.co/5n9r9N7Zgc—-The-Truth-Behind-Strategy’s-32-BTC-Sale-and-Its-New-Bitcoin-Model
📊【XWIN TREND INDEX | June 2, 2026】
Overall Score: 14 / 100
• 80–100 = Strong Uptrend
• 60–79 = Moderately Bullish
• 40–59 = Neutral / No Clear Direction
• 20–39 = Moderately Bearish
• 0–19 = Strong Downtrend
Market Direction: Strong Downtrend
"BTC has fallen below $71,000 as ETF outflows and long liquidations accelerate. Defensive positioning remains the priority, although extreme fear is beginning to create conditions for a potential relief rally."
―――――――――――――――――――
Market Summary
• BTC fell below $71,000, reaching its lowest level since April
• Bitcoin has declined more than 4% over the past 16 hours
• Spot BTC ETFs recorded $139 million in daily outflows and $1.39 billion over the past 7 days
• ETH ETFs also saw $247 million of net outflows over the last week
• Market participants increasingly expect $70,000 before a return to $90,000
• Rising Middle East tensions pushed oil prices higher
• Stronger U.S. dollar continues to pressure risk assets
• The key short-term battle is whether BTC can hold the $70,000 level
―――――――――――――――――――
On-Chain & Technical Trends
• Coinbase Premium remains negative, signaling weak U.S. institutional demand
• Demand Absorption Trend (DAT) fell to its lowest level since October 2024
• Current weakness appears driven more by a lack of buyers than aggressive selling
• Long-term holders continue accumulating BTC
• BTC Supply in Loss has risen to 40.6%
• Exchange BTC reserves remain in a long-term declining trend
• Binance experienced approximately $1.2 billion in stablecoin outflows during May
• The $71,600 area remains vulnerable to additional long-liquidation events
―――――――――――――――――――
Sentiment
• Fear continues to dominate market psychology
• More than $144 million in crypto liquidations occurred within four hours
• Approximately $125 million of those liquidations were long positions
• Retail traders are experiencing significant leverage-driven liquidations
• Whale positioning remains relatively bullish according to several analysts
• The market is pessimistic, but not yet showing signs of full capitulation
• Strategy’s sale of 32 BTC has negatively affected sentiment despite its small size
• Extreme bearish sentiment is beginning to attract contrarian interest
―――――――――――――――――――
U.S. Traditional Markets
• U.S. ISM Manufacturing Index rose to 54.0, beating expectations
• Manufacturing activity has expanded for five consecutive months
• The S&P 500 remains near record highs
• The NASDAQ continues to be driven by AI-related stocks
• Concerns about excessive concentration in AI stocks are increasing
• USD/JPY remains near 160, supporting continued dollar strength
• Rising oil prices increase inflation risks
• This week’s Non-Farm Payrolls (NFP) report is the key macro event
―――――――――――――――――――
Overall Assessment
Bitcoin remains under significant pressure as ETF outflows, negative Coinbase Premium readings, long liquidations, and weakening liquidity continue to weigh on the market. The sharp decline in the Demand Absorption Trend suggests that the current weakness is driven less by panic selling and more by a lack of new capital entering the market.
However, continued accumulation by long-term holders, stable whale positioning, and the rising percentage of coins held at a loss suggest that the market may be gradually approaching a longer-term bottoming phase.
Key factors to watch today:
• Defense of the $70,000 level
• Spot BTC ETF flows
• Coinbase Premium recovery
• Stabilization of liquidation activity
• Market positioning ahead of the U.S. employment report
Current conclusion:
The market remains in a strong downtrend, but growing fear and ongoing long-term accumulation suggest that Bitcoin may be moving closer to a major bottoming zone rather than the start of a new structural bear market.
#Bitcoin #BTC #Crypto #OnChainAnalysis
#XWINTrendIndex #ETF #DigitalAssets
#MarketStructure #InstitutionalFlows #xWINResearch
📊【XWIN TREND INDEX | June 1, 2026】
Overall Score: 24 / 100
• 80–100 = Strong Uptrend
• 60–79 = Moderately Bullish
• 40–59 = Neutral / No Clear Direction
• 20–39 = Moderately Bearish
• 0–19 = Strong Downtrend
Market Direction: Moderately Bearish
“Selling pressure is beginning to ease, but spot demand remains weak. A short-term rebound is possible, yet market structure still favors caution.”
―――――――――――――――――――
Market Summary
• BTC is trading around the $73,000–$74,000 range
• Current price remains near $73,500
• Panic selling has eased compared to recent sessions
• However, downside risk below $73,000 remains
• ETH continues to trade near the $2,000 level with weak momentum
• Spot BTC ETF outflows remain a major headwind
• No clear signs of institutional buying returning yet
• A short squeeze toward the $78,000 liquidity zone remains possible
―――――――――――――――――――
On-Chain & Technical Trends
• Coinbase Premium remains in negative territory
• U.S. spot demand continues to lag
• IBCI remains at 9.52, signaling an Accumulation Zone
• Long-Term Holder (LTH) supply continues to rise
• Binance BTC reserves have increased, suggesting potential sell-side pressure
• Stablecoin liquidity continues to decline
• Market structure remains heavily futures-driven rather than spot-driven
• A break below $72,000–$73,000 could trigger renewed long liquidations
―――――――――――――――――――
Sentiment
• Crypto Fear & Greed Index remains in Fear territory
• No meaningful improvement in sentiment has been observed
• The issue is not aggressive selling, but a lack of buyers
• ETF outflows continue to weigh on market confidence
• Elevated short positioning creates potential squeeze conditions
• CLARITY Act progress remains a medium-term positive catalyst
• EU crypto tax discussions and regulatory uncertainty remain concerns
• Market sentiment remains pessimistic, approaching contrarian levels
―――――――――――――――――――
U.S. Traditional Markets
• The S&P 500 and NASDAQ remain near record highs
• Capital continues to concentrate in large-cap AI-related stocks
• Bitcoin continues to underperform relative to equities
• Gold remains resilient as investors seek safety
• This week’s key event is Friday’s U.S. Nonfarm Payrolls report
• ISM, JOLTS, ADP, and employment data will be closely watched
• Expectations regarding Fed rate cuts remain a key driver of risk assets
• Elevated equity valuations are becoming a growing risk factor
―――――――――――――――――――
Overall Assessment
Bitcoin continues to hold above $73,000, and some signs suggest selling pressure may be stabilizing. However, ETF outflows, weak Coinbase Premium readings, and declining stablecoin liquidity indicate that a sustainable recovery has not yet been confirmed.
The key indicators to watch today are ETF flows, Coinbase Premium recovery, defense of the $73,000 support level, liquidity concentration near $78,000, and changing expectations ahead of this week’s U.S. employment data.
The market currently appears to be in a difficult phase where potential bottom formation coexists with ongoing demand weakness.
#Bitcoin #BTC #Crypto #OnChainAnalysis
#XWINTrendIndex #ETF #MarketStructure
#InstitutionalInvestors #DigitalAssets #MacroEconomics
📊【XWIN TREND INDEX | May 31, 2026】
Overall Score: 18 / 100
• 80–100 = Strong Uptrend
• 60–79 = Moderately Bullish
• 40–59 = Neutral / Sideways
• 20–39 = Moderately Bearish
• 0–19 = Strong Downtrend
Current Outlook: Strong Downtrend
“Price remains resilient above key support, but continued capital outflows and weak spot demand suggest that supply-demand deterioration still outweighs recovery signals.”
―――――――――――――――――――
Market Summary
• BTC is trading in the $73,000–74,000 range
• Bitcoin has declined roughly 11% from its May 8 high near $82,000
• Spot Bitcoin ETFs have recorded more than $4 billion in cumulative outflows during May
• Weekly ETF flows show BTC -$1.42B and ETH -$241M
• The market's primary issue is not aggressive selling, but a lack of new buyers
• Bitcoin Realized Cap declined from $1.12T to $1.08T
• Approximately $40.8B of real capital has left the market
• Fund-held BTC balances continue to decline, suggesting a possible distribution phase
―――――――――――――――――――
On-Chain & Technical Trends
• Coinbase Premium remains in negative territory
• U.S. spot demand remains weak
• Whale and dolphin accumulation activity has largely stalled
• Wallets holding more than 10,000 BTC continue reducing exposure
• IBCI remains at 9.52, firmly within the Accumulation Zone
• aNUPL has fallen back into negative territory
• Stablecoin inflows to Binance have declined significantly
• A break below $73,000 could trigger another wave of long liquidations
―――――――――――――――――――
Sentiment
• Market sentiment remains in Fear territory
• ETF outflows continue to weigh on investor confidence
• Institutional investors remain in risk-reduction mode
• The current issue is a shortage of buyers rather than excessive selling pressure
• Optimism surrounding the CLARITY Act remains intact
• JPMorgan CEO Jamie Dimon continues to oppose the legislation
• Bitcoin dominance has fallen below 60%
• Capital is beginning to rotate selectively into certain altcoins
―――――――――――――――――――
U.S. Traditional Markets
• The S&P 500 remains near all-time highs
• Capital continues flowing into major AI-related companies
• Market gains remain concentrated among a small group of mega-cap stocks
• Corporate earnings and share buybacks continue to support equities
• Markets are focused on new Fed Chair Kevin Warsh’s first FOMC meeting
• Rate-cut expectations remain a major theme for the second half of 2026
• Weakening Chinese demand is contributing to softer oil prices
• Japanese bond market dynamics and BOJ quantitative tightening are emerging as global macro risks
―――――――――――――――――――
Overall Assessment
Bitcoin continues to hold above the $73,000 level, but underlying market conditions remain fragile. ETF outflows, declining Realized Cap, shrinking fund holdings, and stalled whale accumulation all point toward weakening market demand.
While long-term indicators such as the IBCI Accumulation Zone, strong long-term holder conviction, and regulatory progress through the CLARITY Act remain constructive, a sustainable bullish reversal has not yet been confirmed.
Key factors to monitor today include ETF flows, Coinbase Premium recovery, defense of the $73,000 support level, renewed whale accumulation, and shifts in market sentiment ahead of the June FOMC meeting.
At present, the market remains caught between potential long-term accumulation and ongoing short-term demand deterioration.
Why Isn’t Bitcoin Rising Despite Record Long-Term Holder Supply? — CryptoQuant’s “Market Without Buyers” via @cryptoquant_com(Report-#303)
For years, rising Long-Term Holder (LTH) supply has been viewed as a bullish signal. More long-term holders usually mean less selling pressure.
Today, Bitcoin’s LTH supply has reached a record 15.8 million BTC. At first glance, that looks extremely bullish.
However, CryptoQuant argues that the current increase may actually reflect a shortage of new buyers.
In a healthy bull market, coins sold by long-term holders are absorbed by new investors. But today, Bitcoin appears to be changing hands less frequently, suggesting weaker demand.
The data supports this view.
Whale holdings (1,000–10,000 BTC addresses) have stopped growing and are moving back toward negative year-over-year growth. Dolphin holdings (100–1,000 BTC addresses), which include ETF and corporate demand, have also slowed significantly since late 2025.
Meanwhile, part of the increase in LTH supply comes from older Coinbase-held coins simply aging into the long-term holder category rather than reflecting fresh demand.
At XWIN, we have been highlighting weakening ETF flows, negative Coinbase Premium readings, declining active addresses, and slowing on-chain demand for weeks.
The message is simple:
Bitcoin does not currently have a seller problem.
It has a buyer problem.
Until ETF inflows, whale accumulation, and network activity recover, the market is likely to remain in a demand-recovery phase rather than a full bull market.
https://t.co/RVs9YzZdTZ’t-Bitcoin-Rising-Despite-Record-Long-Term-Holder-Supply?-—-CryptoQuant’s-“Market-Without-Buyers”
📊【XWIN TREND INDEX | May 30, 2026】
Overall Score: 24 / 100
• 80–100 = Strong Uptrend
• 60–79 = Moderately Bullish
• 40–59 = Neutral / No Clear Direction
• 20–39 = Moderately Bearish
• 0–19 = Strong Downtrend
Current Outlook: Moderately Bearish
“BTC is attempting to stabilize above $73K, but continued ETF outflows and weak U.S. spot demand suggest that any rebound remains in the confirmation phase.”
────────────────────────────
Market Summary
• BTC is trading in the low-$73,000 range
• After briefly falling into the $72,000 area, BTC recovered above $73K
• The sharp selloff from yesterday has temporarily stabilized
• U.S. Spot Bitcoin ETFs continue to experience net outflows
• Institutional demand remains weak, led by large IBIT withdrawals
• A major short liquidation zone remains near $76,000
• Below $73,600, significant long liquidation clusters remain active
• Easing concerns around the Iran situation have supported a short-term recovery
────────────────────────────
On-Chain & Technical Trends
• Coinbase Premium remains in negative territory
• U.S. spot demand continues to weaken
• BTC inflows to Binance are increasing, indicating offshore absorption of supply
• Exchange inflows have risen over the past several days
• Funding Rates remain elevated, signaling long-position concentration
• IBCI remains in the Accumulation Zone, supporting a long-term accumulation thesis
• Increased movement from short-term holders suggests weaker hands are exiting
• The $73,000 level remains the most important near-term support
────────────────────────────
Sentiment
• Market sentiment remains tilted toward Fear
• Persistent ETF outflows continue to pressure investor confidence
• Weak Coinbase Premium readings indicate slowing U.S. institutional demand
• Historically, large ETF outflow periods have often preceded major rebounds
• Expectations surrounding the CLARITY Act remain constructive
• SEC Chairman Paul Atkins expressed confidence that the legislation will eventually pass
• JPMorgan CEO Jamie Dimon continues to oppose parts of the current proposal
• Sentiment reflects a mix of demand weakness and optimism surrounding regulatory clarity
────────────────────────────
U.S. Traditional Markets
• The S&P 500 remains near all-time highs
• The index has recorded its strongest multi-week advance since 2023
• Capital continues to flow into AI-related equities
• Corporate earnings, buybacks, and ETF inflows remain major drivers of stock performance
• Capital is favoring equities over digital assets in the current environment
• Oil prices have stabilized as geopolitical concerns ease
• Markets are increasingly focused on geopolitical developments rather than interest rates
• Continued progress in crypto market infrastructure and regulation remains a positive backdrop
────────────────────────────
Overall Assessment
Bitcoin has managed to hold above the critical $73,000 support area following yesterday’s sharp decline. However, ETF outflows, negative Coinbase Premium readings, and increasing exchange inflows suggest that spot demand remains weak and a sustainable recovery has not yet been confirmed.
On the positive side, the IBCI Accumulation Zone, strong long-term holder conviction, progress on the CLARITY Act, and continued institutional infrastructure development all support the longer-term bullish thesis.
Key indicators to watch today:
• Defense of the $73,000 support level
• Potential short squeeze above $76,000
• U.S. Spot Bitcoin ETF flows
• Coinbase Premium recovery
• Funding Rate and leverage conditions
Short-term outlook remains Moderately Bearish, but compared with yesterday’s score of 18/100, stabilization around key support levels justifies a modest improvement to 24/100.
Why Hold Bitcoin Anyway? — Rethinking Portfolio Construction in an Era of Strong Stocks and Weak BTC via @cryptoquant_com(Report-#302)
Many investors are asking the same question:
"If stocks are performing so well, why hold Bitcoin?"
The question is reasonable. U.S. stocks continue to benefit from strong earnings growth, especially from AI-related companies such as NVIDIA and Microsoft. Businesses generate profits, reinvest capital, and reward shareholders through buybacks and dividends.
Bitcoin is different. It produces no earnings or cash flow, and recent ETF outflows and weaker on-chain activity have pressured demand.
Yet many institutions and corporations continue to hold Bitcoin.
Why?
The answer is not short-term performance but portfolio construction.
Stocks depend on the success of companies and the stability of the existing financial system. Bitcoin operates under a different framework. Its supply is permanently capped at 21 million coins, making it one of the few assets with a mathematically fixed supply.
Unlike fiat currencies, which can be printed, or companies, which can issue new shares, Bitcoin's supply cannot be expanded when demand rises.
This scarcity is one reason many investors view Bitcoin as a form of digital gold.
Another factor is market size. Global crypto assets are worth only a fraction of the value of stocks, bonds, or gold. While that does not guarantee future growth, it suggests that adoption is still in its early stages compared with traditional asset classes.
Stocks represent ownership of productive businesses.
Bitcoin represents ownership of a scarce digital asset.
Therefore, the real question is not "Stocks or Bitcoin?"
It is "What combination of growth assets and scarce assets best fits your portfolio?"
Stocks may be more mature and stable today.
Bitcoin may offer greater long-term upside.
That is why many investors continue to hold both.
https://t.co/M6DnnJ8Xst—-Rethinking-Portfolio-Construction-in-an-Era-of-Strong-
📊【XWIN TREND INDEX | May 29, 2026】
Overall Score: 18 / 100
80–100 = Strong Uptrend
60–79 = Moderately Bullish
40–59 = Neutral / No Clear Direction
20–39 = Moderately Bearish
0–19 = Strong Downtrend
Market Direction: Strong Downtrend
"ETF outflows and weakening spot demand are accelerating. Long-term structural bullishness remains intact, but risk management is the priority in the short term."
──────────────────────────────
Market Summary
• BTC fell toward the $73,000 area, reaching its lowest level in six weeks
• Approximately $930 million in liquidations occurred across the market in the last 24 hours
• U.S. Spot Bitcoin ETFs recorded their 8th consecutive day of net outflows
• BlackRock's IBIT experienced its second-largest daily outflow on record, totaling roughly $528 million
• Coinbase Premium declined to approximately -0.21%
• Bitcoin market capitalization fell to around $1.49 trillion, dropping to 13th place among global assets
• FalconX confidentially filed for an IPO, signaling an accelerating wave of crypto-related listings
• Ongoing uncertainty surrounding U.S.-Iran tensions continues to pressure market sentiment
──────────────────────────────
On-Chain & Technical Trends
• Apparent Demand has fallen to its lowest level of the year
• Coinbase Premium has diverged sharply below its 3-month average
• Bitcoin Vector Risk Index has surged higher
• Binance inflows are increasing as offshore markets absorb selling pressure from U.S. investors
• Exchange BTC reserves remain near their lowest levels since 2019
• The Short-Term Holder Realized Price near $73,000 has become a key support level
• ETH whale holdings increased to 17.41 million ETH
• IBCI Daily is improving while price continues to lag, highlighting a growing demand-price divergence
──────────────────────────────
Sentiment
• Market sentiment has shifted back toward fear
• Kalshi traders are increasingly pricing in a potential move toward $52,000 later this year
• ETF outflows and persistent Coinbase selling pressure remain major bearish drivers
• Long-term holder supply remains near all-time highs
• Whale accumulation continues within the Ethereum market
• Retail liquidity appears to be rotating from crypto into equities
• Expectations for the CLARITY Act remain supportive over the longer term
• Many analysts still view the current environment as a demand correction rather than a systemic collapse
──────────────────────────────
U.S. Traditional Markets
• The S&P 500 closed at a new all-time high
• U.S. equity market capitalization increased by approximately $450 billion in a single day
• Capital concentration into AI-related stocks continues
• ETF inflows and corporate buybacks remain major drivers of equity strength
• Kalshi launched the American Power Index, a market-based political indicator
• Mastercard expanded its crypto and stablecoin payment initiatives in New York
• Treasury Secretary Bessent publicly called for passage of the CLARITY Act
• The U.S. continues shifting from a regulatory-first approach toward institutional adoption and integration of digital assets
──────────────────────────────
Overall Assessment
The Bitcoin market is currently facing three major headwinds simultaneously: ETF outflows, a deteriorating Coinbase Premium, and weakening spot demand. Institutional demand in the United States has softened significantly, making the defense of the $73,000 level more important than any immediate recovery toward $75,000.
At the same time, several long-term constructive signals remain intact, including declining exchange reserves, rising long-term holder supply, continued ETH whale accumulation, and progress toward regulatory clarity through the CLARITY Act.
Key areas to watch today:
• The $73,000 support zone
• U.S. Spot Bitcoin ETF flows
• Recovery in the Coinbase Premium
• Open Interest and Funding Rate positioning
• Geopolitical developments in the Middle East
The market currently reflects a rare divergence: a strong short-term bearish trend alongside an intact long-term structural bullish framework.
Why Are Stocks Rising While Bitcoin Weakens? — Understanding the Structural Difference Behind BTC’s Decline via @cryptoquant_com(Report-#301)
One of the most important themes in markets since May 2026 has been the divergence between rising stocks and weakening Bitcoin. While the S&P 500 and Japanese equities remain near highs, BTC has struggled, leaving many investors wondering why both “risk assets” are moving in opposite directions.
The answer is simple: stocks and Bitcoin are now driven by completely different engines.
Today’s equity rally is supported by strong AI-related earnings expectations, massive capital spending led by companies like NVIDIA, aggressive share buybacks from firms such as Apple, and continued ETF inflows. In other words, stocks are rising because investors can clearly see future profit growth.
Importantly, the rally is highly concentrated in mega-cap AI companies. A small number of firms now dominate index performance.
Bitcoin, however, has no earnings or cash flow. Its price depends heavily on new capital entering the market.
That demand is currently weakening.
Spot BTC ETFs saw billions of dollars in outflows during the second half of May, while on-chain data shows declining active addresses, lower transaction activity, and slowing network participation. CryptoQuant data particularly highlights that while the S&P 500 continues making highs, BTC active addresses have been trending downward since 2024.
This suggests that the issue is not only price weakness, but shrinking network participation itself.
In strong Bitcoin cycles, rising prices are usually accompanied by growing user activity. Today, however, Bitcoin increasingly resembles a market where “price remains, but participation fades.”
This is the key difference:
Stocks rise because companies generate profits.
Bitcoin rises when new participants and liquidity return.
At the same time, high real interest rates and a strong U.S. dollar continue to pressure liquidity-sensitive assets. Equities can absorb this pressure through earnings growth and buybacks. Bitcoin cannot.
As a result, capital is flowing toward “profit-growth assets” while leaving “liquidity-dependent assets.”
For BTC to recover strongly again, stock market strength alone will not be enough. What Bitcoin truly needs is the return of its own demand:
• ETF inflows
• Rising active addresses
• Stronger on-chain activity
• Coinbase Premium recovery
• A weaker dollar environment
The real question ahead is not whether stocks remain strong.
It is whether new demand returns to Bitcoin itself.
https://t.co/Vuu3ns8GiV—-Understanding-the-Structural-Difference-Behind-BTC’s-Decline
What CryptoQuant CEO Ki Young Ju’s Comments Reveal About the Bitcoin Market_Can “Bullish Bitcoin ETFs” and “Weak Altcoins” Coexist? via @cryptoquant_com (Report-#300)
CryptoQuant CEO Ki Young @ki_young_ju Ju recently stated:
“Crypto ETFs on TradFi were bullish. Stocks on crypto exchanges are bearish. If crypto natives stop buying crypto, who is left to buy?”
His comment highlights a major structural shift in the crypto market: the buyer base is changing.
Since the approval of U.S. spot Bitcoin ETFs in 2024, institutional capital has increasingly entered Bitcoin through brokerage and retirement accounts rather than crypto exchanges. ETF holdings have continued to rise while exchange BTC reserves decline, suggesting BTC is being absorbed into long-term institutional custody.
This means Bitcoin is no longer driven only by internal crypto liquidity. Wall Street, RIAs, pension-related capital, and large institutions are becoming increasingly important participants in BTC price formation.
At the same time, many altcoins remain weak. BTC dominance has stayed elevated, ETH/BTC has underperformed, and spot trading volume on centralized exchanges has generally declined since late 2025. On-chain data also suggests weaker aggressive buying activity and lower speculative appetite among crypto-native traders.
In other words:
“TradFi is buying Bitcoin,”
while
“crypto-native traders are not broadly buying altcoins.”
This divergence matters because Bitcoin now has a massive institutional pipeline through ETFs, while most altcoins still rely heavily on internal crypto market liquidity.
As a result, capital is concentrating into BTC and a small number of major assets rather than spreading across the broader altcoin market.
Ki Young Ju’s comments are therefore not simply bearish. They suggest the crypto market itself may be transitioning from a “crypto-native cycle” into a “TradFi-driven Bitcoin market.”
https://t.co/88HKfPGhK3’s-Comments-Reveal-About-the-Bitcoin-Market_Can-“Bullish-Bitcoin-ETFs”-and-“Weak-Altcoins”-Coexist?-
📊【XWIN TREND INDEX | May 28, 2026】
Overall Score: 28 / 100
・80–100 = Strong Uptrend
・60–79 = Moderately Bullish
・40–59 = Neutral / Sideways
・20–39 = Moderately Bearish
・0–19 = Strong Downtrend
Current Market Direction: “Moderately Bearish”
“While spot demand continues to weaken and geopolitical risks intensify, quiet accumulation by large players may still be progressing beneath the surface.”
―――――――――――――――――――
Market Summary
・BTC continues trading around the $75K range amid low-liquidity volatility
・Approximately $104 million in liquidations occurred within the past 4 hours
・BTC ETFs recorded continued outflows: -3,638 BTC daily and -7,339 BTC weekly
・ETH ETFs also remain weak, while SOL ETFs continue attracting inflows
・Coinbase Premium has fallen deeply back into negative territory
・Bitcoin Apparent Demand has dropped to one of the most negative levels on record
・Escalating rhetoric surrounding the Strait of Hormuz is reviving geopolitical concerns
・Meanwhile, tariff refund expectations in the U.S. are creating potential liquidity injection narratives
―――――――――――――――――――
On-Chain & Technical Trends
・Funding Rates remain negative, reflecting persistent short-heavy positioning
・Whale vs Retail Delta has turned negative again, suggesting cautious whale positioning
・BTC exchange reserves continue declining, maintaining long-term supply tightening dynamics
・30-day implied volatility has dropped to its lowest level in 9 months
・Monthly BTC demand growth has deteriorated to approximately -139,000 BTC
・BitMine now holds over 4% of total ETH supply, accelerating the corporate ETH accumulation race
・ADA whale holdings have reached their highest level since 2017
・Ondo’s tokenized stock TVL has surged to a new all-time high of $1.17 billion
―――――――――――――――――――
Sentiment
・Santiment data shows bearish expectations remain dominant
・The market is shifting toward a selective, defensive risk environment rather than broad bullishness
・Negative Coinbase Premium continues signaling weak U.S. spot demand
・At the same time, negative Funding Rates leave room for potential short squeezes
・XRP-related stablecoin ecosystems continue expanding rapidly
・ETH market structure increasingly reflects “retail capitulation vs whale accumulation”
・Crypto card payment volume has reached new all-time highs
・Market psychology appears less like “collapse” and more like a quiet structural transition phase
―――――――――――――――――――
U.S. Traditional Markets
・Goldman Sachs raised its year-end S&P 500 target to 8,000
・Capital concentration into AI-related equities continues intensifying
・AI, defense, and space infrastructure themes continue attracting major global capital
・Senator Elizabeth Warren raised concerns over AI-driven wealth concentration and taxation
・BIS will begin real-money settlement testing through Project Agorá
・Mastercard received approval for crypto and stablecoin payments in New York
・Debate surrounding the CLARITY Act and DeFi regulation is intensifying again
・Markets are increasingly pricing in both the “AI revolution” and “on-chain financial infrastructure” simultaneously
―――――――――――――――――――
Overall Assessment
The BTC market is once again showing signs of structural weakness in the short term, driven by ETF outflows, deteriorating Coinbase Premium, and declining spot demand. Combined with thin liquidity and elevated leverage, liquidation-driven volatility remains a major risk.
However, negative Funding Rates, declining exchange reserves, whale accumulation, and the expansion of on-chain financial infrastructure continue supporting a longer-term structural bullish narrative beneath the surface.
Today’s key focus areas are:
ETF flows, the defense of the $76K level, Coinbase Premium recovery, Funding Rate behavior, and geopolitical headlines.
📊【XWIN TREND INDEX | May 27, 2026】
Overall Score: 34 / 100
・80–100 = Strong Uptrend
・60–79 = Moderately Bullish
・40–59 = Neutral / Sideways
・20–39 = Moderately Bearish
・0–19 = Strong Downtrend
Current Bias: “Moderately Bearish.”
“Liquidity instability and geopolitical headlines continue to pressure the market, while extreme bearish positioning is simultaneously increasing rebound potential.”
―――――――――――――――――――
Market Summary
・BTC briefly fell below $76K, triggering over $210M in long liquidations
・Markets turned risk-off again as hopes for a US-Iran resolution weakened
・Following comments from Marco Rubio, US equities erased roughly $400B in market cap within 90 minutes
・Despite volatility, the S&P 500 remains near all-time highs
・Spot BTC ETFs have seen over $2B in outflows during the past two weeks
・Crypto markets continue to lose capital attention to the AI equity boom
・SpaceX secured a massive US Space Force contract, strengthening the “Space × AI × Defense” narrative
・The dominant theme remains: “short-term risk-off vs long-term institutionalization”
―――――――――――――――――――
On-Chain & Technical Trends
・Funding Rates remain deeply negative, signaling extreme short positioning across the market
・Despite this, BTC continues holding near the $77K zone, suggesting sell pressure may be getting absorbed
・IBCI Daily remains in the Accumulation Zone at 23.81
・BTC exchange reserves continue declining, reinforcing the long-term supply squeeze narrative
・Thin liquidity and liquidation-driven volatility remain dominant, especially on Binance
・ETH whales continue building large long positions while retail sentiment weakens
・BitMine added another 112K ETH, accelerating corporate ETH accumulation trends
・BTC Price Z-Score MA200d still shows a bullish divergence, but reclaiming the “0” level remains critical
―――――――――――――――――――
Sentiment
・Santiment data shows a sharp rise in bearish market expectations over the past 10 days
・The market is becoming increasingly one-sided bearish, which may strengthen contrarian rebound potential
・Fear remains elevated, but short squeeze expectations are also growing
・BTC implied volatility remains historically low, warning of a possible large move ahead
・XRP’s 30-day MVRV has fallen to its lowest level since 2020, suggesting capitulation conditions
・ETH market structure increasingly reflects “retail panic vs whale accumulation”
・LINK whale wallets continue reaching new all-time highs
・Market psychology is shifting from “full bullishness” toward “cautious accumulation during fear”
―――――――――――――――――――
US Traditional Markets
・AI-related equities continue attracting concentrated global capital flows
・NVIDIA alone now accounts for roughly 8% of the S&P 500
・Taiwan’s equity market became the world’s 5th largest, driven by TSMC and AI demand
・Concerns around US debt sustainability and the dollar system continue to grow gradually
・Long-term demand for gold, BTC, and real assets remains intact
・Kevin Warsh’s “AI as a disinflationary force” thesis remains an important macro theme
・Markets remain highly sensitive ahead of upcoming US PCE and GDP data
・Global capital concentration into AI, defense, semiconductor, and space infrastructure continues accelerating
―――――――――――――――――――
Overall Assessment
The BTC market is once again entering a liquidity-driven and liquidation-sensitive environment, pressured by ETF outflows, geopolitical uncertainty, and fragile market depth. However, long-term accumulation signals are simultaneously strengthening through negative funding, declining exchange reserves, and continued IBCI accumulation-zone readings.
Rather than a “full collapse,” the current environment may resemble a “fear-driven whale accumulation phase.”
Key focus points today include:
BTC’s ability to defend the $76K zone, ETF flow stabilization, funding dynamics, continued ETH whale positioning, and upcoming US PCE/GDP releases.
Why Tom Lee Is Betting on Ethereum Instead of Bitcoin via @cryptoquant_com(Report-#299)
A quiet structural shift may be unfolding inside the Ethereum market.
Tom Lee, one of Wall Street’s best-known crypto bulls and co-founder of Fundstrat, has recently intensified his Ethereum strategy through BitMine Immersion Technologies (BMNR). The company reportedly added another 111,942 ETH, bringing its holdings close to 5.4 million ETH — around 4.47% of Ethereum’s total circulating supply.
Lee is not treating Ethereum as just another altcoin. Instead, he increasingly views ETH as digital financial infrastructure.
Ethereum already dominates stablecoin settlement, tokenization, Layer-2 activity, and parts of the emerging AI-driven blockchain economy. While ETH price action has remained relatively weak, network usage and infrastructure adoption continue expanding.
Lee has even suggested a long-term ETH valuation scenario reaching $62,500 by 2030. His thesis relies partly on historical ETH/BTC ratio reversion and a broader belief that Bitcoin may eventually reach $250,000.
At the same time, the Ethereum Foundation itself is evolving. Vitalik Buterin recently stated that the EF should not be viewed as the “center” of Ethereum, but merely one node within a broader ecosystem. The foundation also appears increasingly focused on minimizing ETH sales and concentrating resources on censorship resistance, privacy, security, and open-source infrastructure.
On-chain metrics support this broader structural narrative.
Ethereum exchange reserves have been steadily declining since 2022, meaning less ETH is immediately available for sale. Meanwhile, ETH staking participation has continued rising, with more than 30% of supply now locked in staking systems.
In other words, Ethereum may be quietly transitioning from a speculative asset into a long-term yield-bearing financial infrastructure layer.
Tom Lee may not simply be betting on ETH price appreciation.
He may be betting on Ethereum becoming part of the future architecture of global finance.
https://t.co/KtESKYwbfT