$BTC
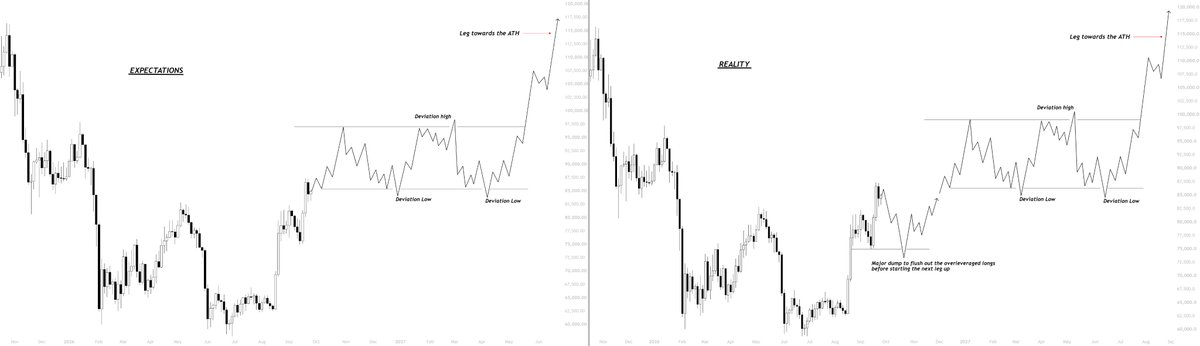
Price pumped above 83k and people are now targeting 100k without any correction,
Entire CT is expecting us to directly form the massive accumulation range and then start the leg towards the ATH,
But once again, nothing ever goes as the majority plans in these markets,
And the reality is ofcourse gonna be very different, especially with all this fomo that we are seeing around the local top.
I am expecting price to first flush out the overleverage/fomo longs until 75k,
Then get the next leg up to 95-100k and form the massive accumulation range there before going to ATH.
Overall, my bias is still bearish until we get the flush to 75k.
Called the May top and shorted it publicly.
Called the bottom for July 1st, then the final low on Aug 3rd, longed both publicly.
Called the $60k to $86–87k breakout and closed with perfect timing.
Local top is in, BTC tags $79k first before going higher.⌛️
All public.
bitcoin:native
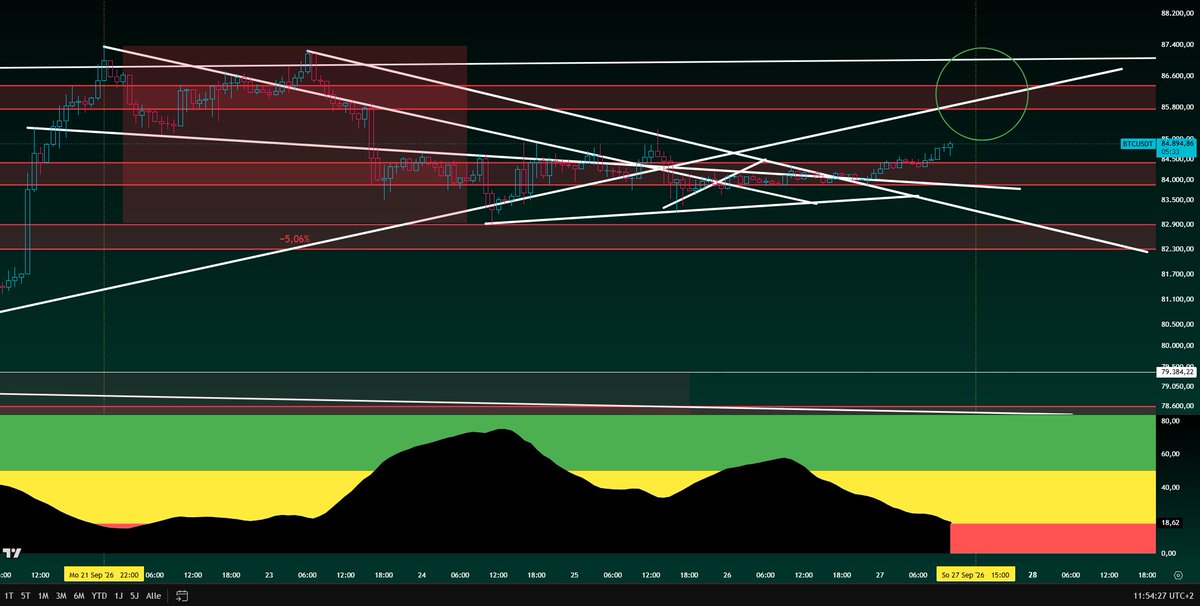
The black bar sliding into the red zone on the 4H timeframe, something that does not happen very often, is a signal that Bitcoin has to correct shortly afterwards.
On the 4H timeframe the signal is strongest when the black bar slips into the red overheated area. (LTF ONLY)
There is also a signal on the 4H when the black bar touches the green area, though it is not as strong as the red-zone signal on that timeframe.
In that case you can assume Bitcoin moves a few percent higher, likely 2–3%. So it is not off the table that Bitcoin could test the 85–86k area again.
I will increase my short positions in this price range, in case that actually happens.
The reading that a black bar touching the green zone is bullish is strongest and most reliable on the 12H and higher timeframes.
bitcoin:native
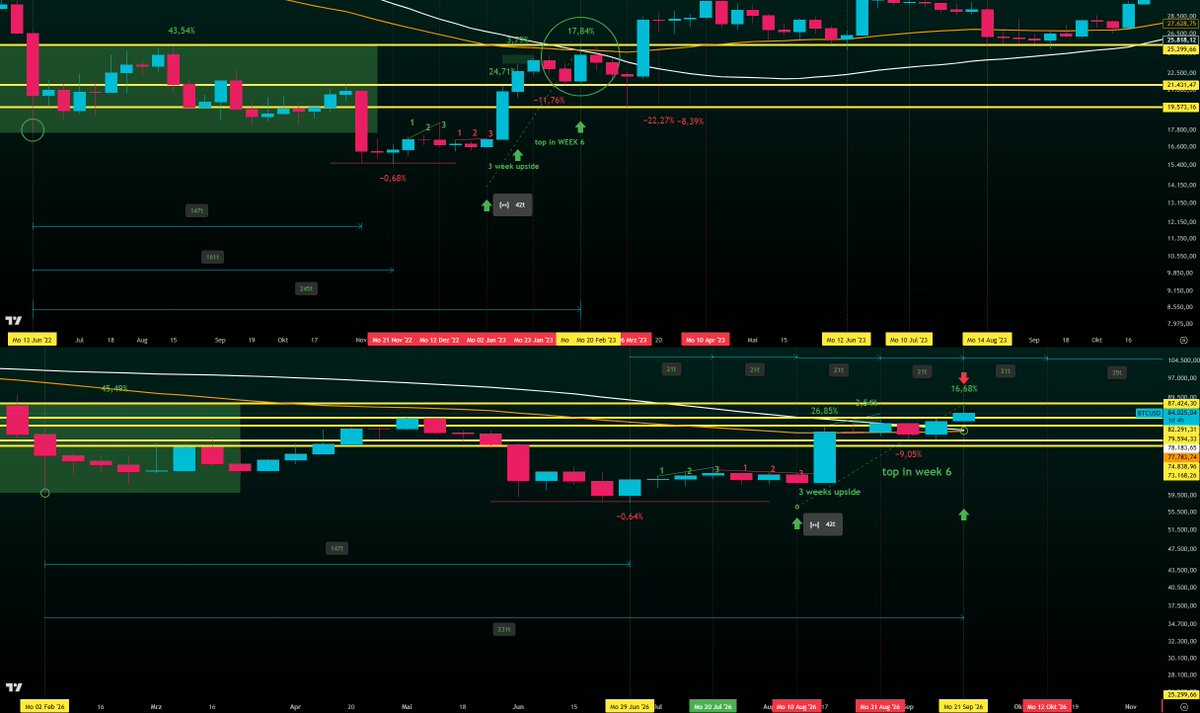
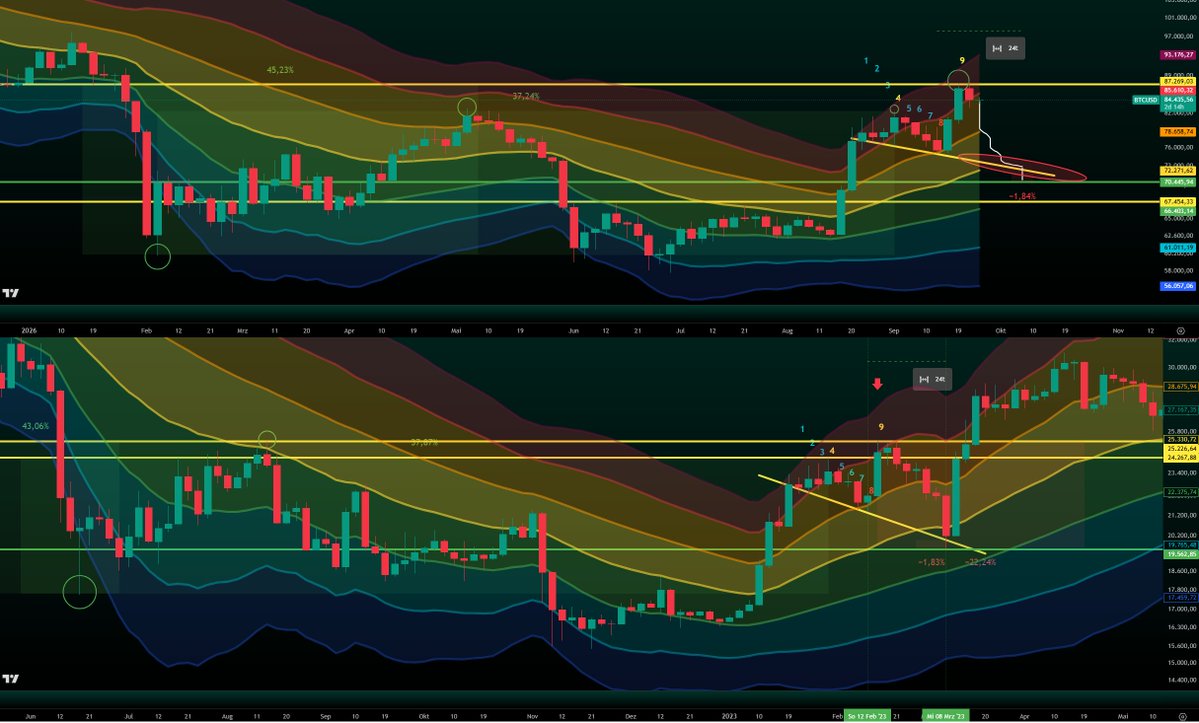
Let’s briefly look back at what actually happened back then, before the breakout was visible, as in the August thread.
In 2023, the final bottom formed 147 to 161 days after the wick outside the blue TEM zone.
The 161 days are explained by COVID, the FTX crash, and a two-week delay with a price difference of less than 1%. What matters is the time interval itself.
It took 245 days to reach the top.
The move from the wick outside the blue TEM zone to the top was +43.5%.
From the last low, Bitcoin pumped for three weeks, then moved sideways for three weeks, and after that consolidation gained more than +24% within one week.
The impulse ended after exactly three weeks with the first sign of weakness and a pullback of -11%.
The highest high formed in week six.
After that, price dropped -22%.
From the end of the three-week sideways phase to the peak, it took 42 days.
In 2026, the final bottom formed 147 days after the wick outside the blue TEM zone.
It took 231 days to reach the top, without the two-week delay from back then.
The move from the wick outside the blue TEM zone to the top is +45.5%.
Here as well, Bitcoin pumped for three weeks from the last low, then moved sideways for three weeks, and after that consolidation gained more than +24% within one week.
After exactly three weeks came the first sign of weakness and a pullback of -9%.
The highest high formed again in week six and therefore lines up with the current week.
From the end of the three-week sideways phase to the peak, it again took 42 days.
A final upside impulse is possible and cannot be ruled out.
If the structure repeats 1:1, the local top is already in.
The key levels are the 50-week EMA/SMA .
If Bitcoin finds support there, the path toward $100,000 remains open!
If the pattern repeats 1:1, Bitcoin would likely sit around $78–79k next week, then pump into $82/83k.
What matters is whether this range holds.
The pattern is too precise to dismiss as coincidence.
bitcoin:native
In 2023, the crossover occurred in week 6, the same week Bitcoin formed its highest high.
This week, week 6, we are seeing the exact same scenario.
From the last low, Bitcoin pumped for three weeks, then moved sideways for three weeks, and after that consolidation gained more than +24% within one week.
From the end of the three-week sideways phase to the peak, it took 42 days.
The impulse ended after exactly three weeks with the first sign of weakness and a pullback of -11%.
The highest high formed in week six. After that, price dropped -22%.
Here as well, Bitcoin pumped for three weeks from the last low, then moved sideways for three weeks, and after that consolidation gained more than +24% within one week.
From the end of the three-week sideways phase to the peak, it again took 42 days.
After exactly three weeks came the first sign of weakness and a pullback of -9%.
The highest high formed again in week six and therefore lines up with the current week.
$BTC
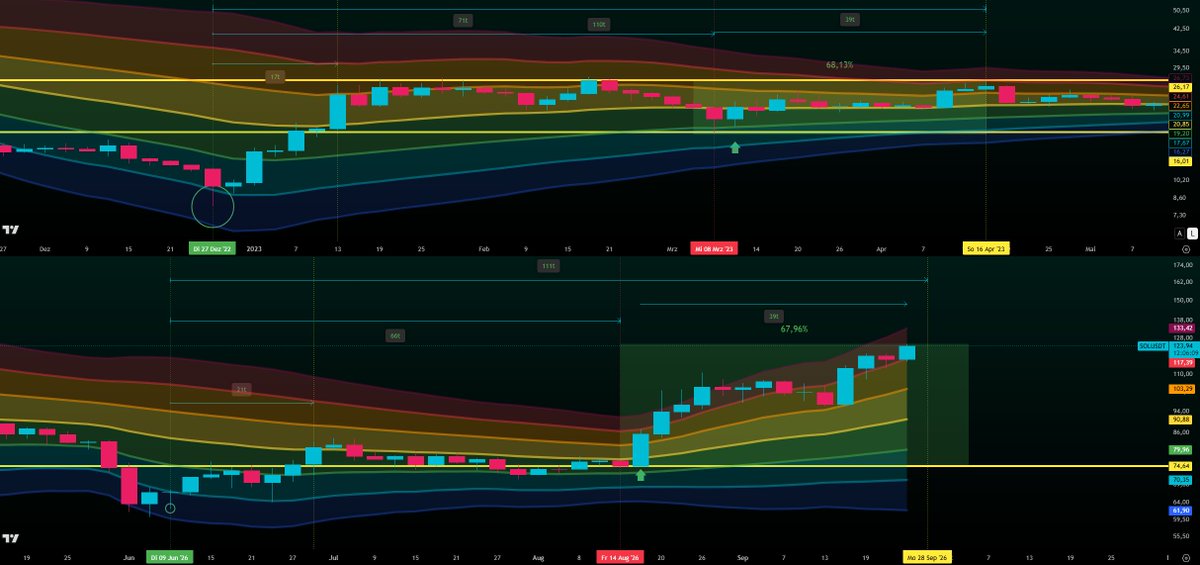
Measured from the last candle in the blue TEM zone, Solana needed 17 days back then until it first touched the yellow zone.
After that it found its last local bottom 71 days later. From the last candle in the green TEM zone it then took 39 days to the top, and that was roughly 68%.
We’re seeing the exact same setup in 2026.
Candle in the blue TEM, 21 days later the first touch of the yellow zone.
After 66/69 days came the local bottom and from the last green TEM candle we’re up around 68% again.
All in all it’s 110–111 days from the last relevant TEM zone to the top.
Deviations of about 3 days are completely normal on the 3D timeframe.
solana:So11111111111111111111111111111111111111112
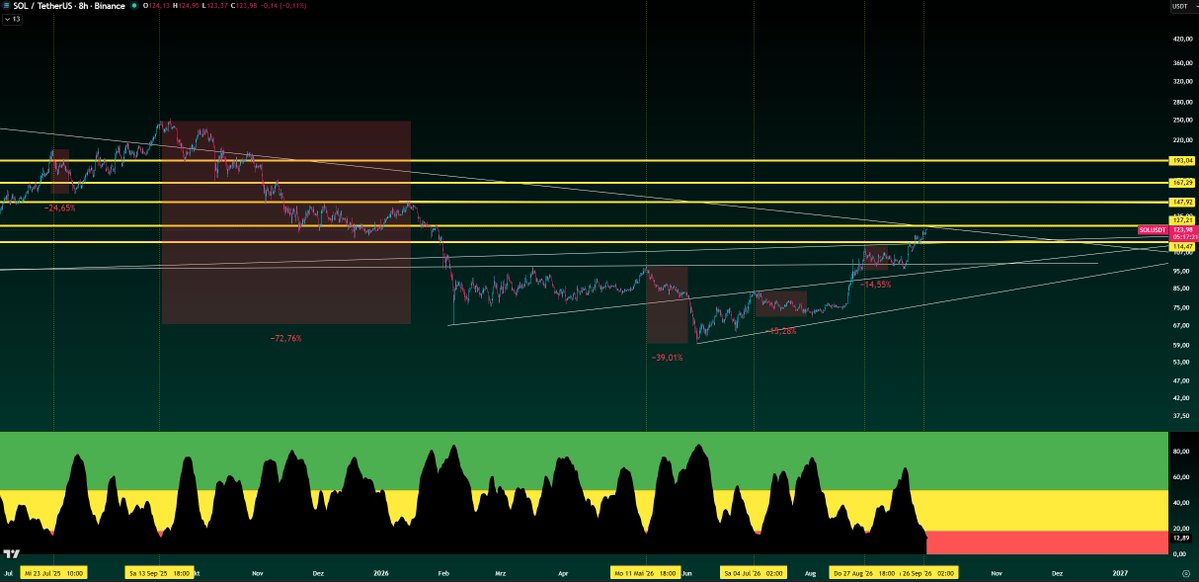
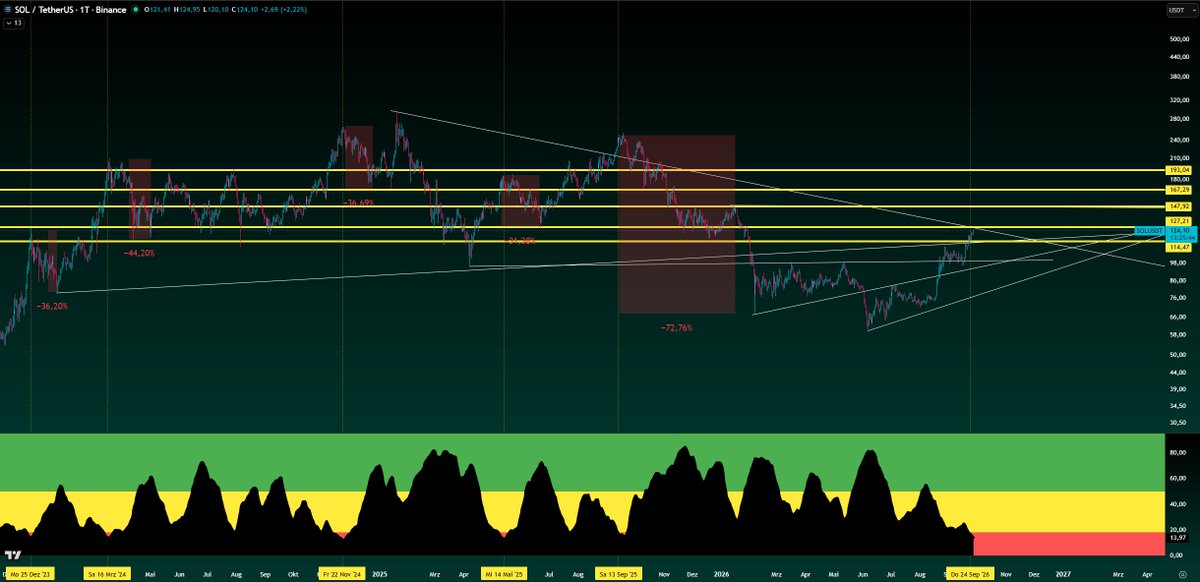
SOL entered the overheated zone on the higher timeframe, a sign that SOL is about to see a huge correction.
For me, 124$–130$ is the short zone with 3x leverage.
" We’ve either dropped right around the moment the black bar entered the red zone, or we’ve been stuck in the overheated zone for multiple days, which causes the black bar on higher timeframes to slide into the red area as well. "
solana:So11111111111111111111111111111111111111112
If you have a plan, stick to it.
Valhalla or hell.⌛️
"
If the pattern repeats 1:1, Bitcoin would likely sit around $78–79k next week, then pump into $82/83k.
Key level to watch is the 50 weekly SMA (currently $78.2k). If BTC finds support there, the path toward $100k stays open.
If Bitcoin rejects at the previous May high, I think the 50 weekly EMA will be the next big test for Bitcoin (currently $76,500). "
bitcoin:native
Nailed. 🔨
Don’t end up as exit liquidity.
Today you’re gonna see the final pump, before Bitcoin dumps at the start of next week.
See you next week. ⌛️
bitcoin:native
Good morning ☕️
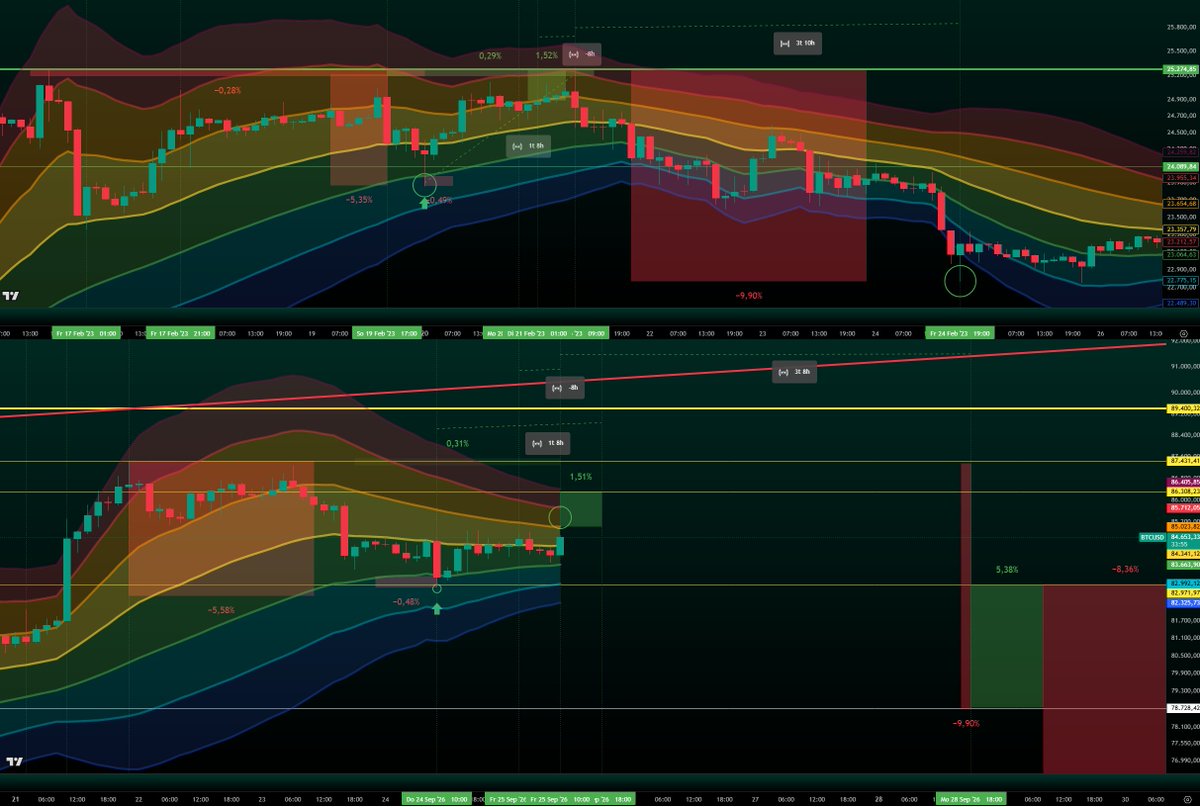
After Bitcoin printed the wick below the green TEM zone, I said we could grind sideways toward $85–87k from there. ✅
In 2023, 8 hours before the peak, BTC touched the dark orange zone and printed the high 8 hours later.
If the pattern repeats 1:1, measured from the dark yellow box, the high could be $86,300.
I expect today’s move to be the last and final pump, until the daily close. ⌛️
There is also a chance that $87,330 was the top. 🚨
What I’m expecting after the last pump?
If the pattern repeats 1:1, Bitcoin would likely sit around $78–79k next week, then pump into $82/83k.
Key level to watch is the 50 weekly SMA (currently $78.2k).
If BTC finds support there, the path toward $100k stays open.
If Bitcoin rejects at the previous May high, I think the 50 weekly EMA will be the next big test for Bitcoin (currently $76,500).
If Bitcoin reclaims the $86,000–$87,300 zone, I will open a short position.
If Bitcoin drops toward $78,000-$79,000, I will open a long position and rebuild my swing long down to $70,500, with a max target of $67,500.
This is a high-timeframe (1W) pattern! Delays or deviations may occur on lower timeframes than 1W.
bitcoin:native
Good morning ☕️
As I said, there is a chance that Bitcoin goes below the green TEM zone, exactly like it did in 2023, before pumping back to the previous highs.
Bitcoin printed a wick below the green zone today.
Bitcoin could go sideways toward 85–87k from today, but i doesnt mean to play out like that on the LTF.
There is also a chance that $87,330 was the top. 🚨
This is a high-timeframe (1W) pattern!
Delays or deviations may occur on lower timeframes than 1W.
If Bitcoin reclaims the $86,800–$87,300 zone, I will open a short position.
If Bitcoin drops toward $79,800, I will open a long position and rebuild my swing long from $79,800 down to $70,500, with a max target of $67,500.
Next week should turn bearish.
Bullish sentiment will break, and the same bears that flipped bullish will turn bearish again. ⌛️
What I expect over the next two weeks:
Scenario 1:
From Sep 28 to Oct 7, a dump to $79k, hold $79k.
From October into November, road to $99k–$106k.
Scenario 2:
Dump to $79k, 5% bounce, then dump back to $70.5k into Oct 12.
After that, pump toward mid $90k's by November.
It doesn't necessarily mean it has to happen again!