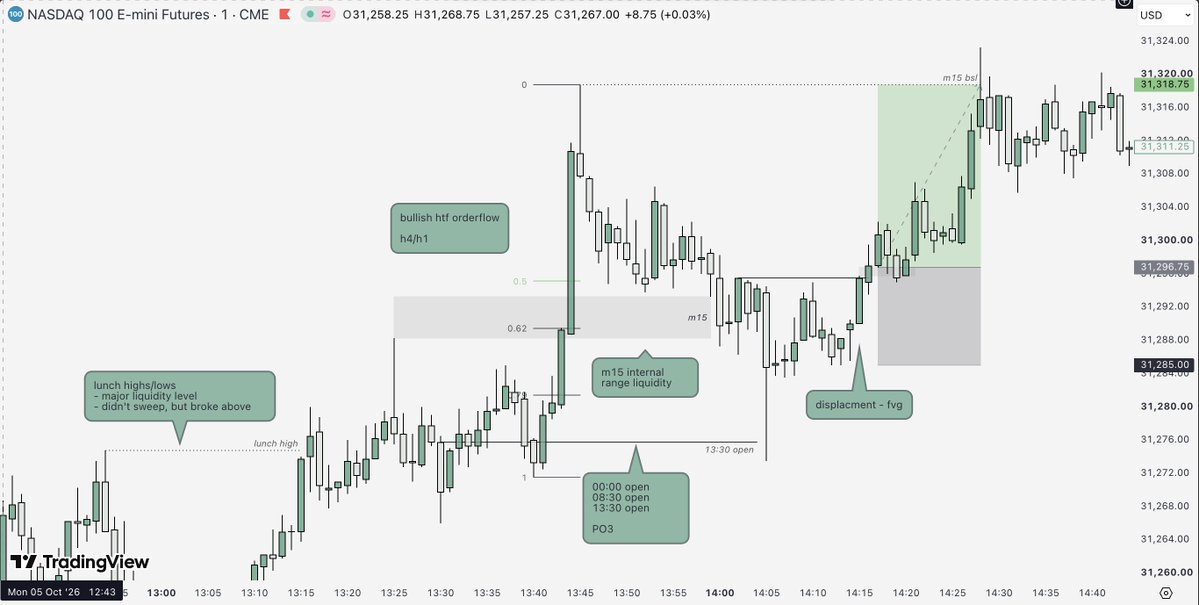
my simple $NQ afternoon model
example from today’s PM session:
1. establish HTF bias (daily / 4H / 1H)
2. mark major liquidity levels, especially lunch highs/lows
3. mark the PM session open
4. bullish → ideally see price trade below the open
bearish → ideally see price trade above the open
5. mark nearby HTF levels / PD arrays
6. watch how price reacts at those levels
7. wait for MSS + displacement before looking for an entry
bias gives me direction.
liquidity gives me a destination.
price action gives me the entry.
@I_Am_The_ICT interesting how price can reach one key level before moving towards the next. the order in which those levels get taken is worth studying.
GBPUSD | weekly outlook
bullish HTF bias, with PWH (~1.3370) and the weekly FVG above as potential upside draws.
but i’m watching for a possible short-term move lower first.
price has already taken monday’s high. if we see bearish confirmation, a retracement towards the relative equal lows around 1.3300 and the daily FVG below (1.3280–1.3300) could offer an intraday short opportunity.
from there, i’ll be watching for bullish confirmation and a potential continuation higher towards PWH and the weekly FVG.
of course, price could skip the retracement entirely and continue straight higher.
one more thing worth noticing 👀
monday’s low sits around 1.3300, while the weekly FVG above is near 1.3400.
both psychological round-number areas.
not a reason to trade them on their own, but interesting when they line up with the levels we’re already watching.
anticipating, not predicting.
#GBPUSD
monday is usually more about building a picture of the week for me.
where’s the weekly liquidity?
what’s the daily chart showing?
where could price be drawing towards?
i’d rather have a clear idea of what i’m looking for before dropping to the lower timeframes.
@SJosephBurns a liquidity sweep at a HTF key level, followed by displacement. i’d rather wait for price to show its hand than try to guess the exact bottom.
funny how you can spend hours waiting for the perfect setup.
finally get your entry.
then spend the next 10 minutes convincing yourself to close it early because of one candle going against you 😂
your trading journal shouldn’t only contain the trades you took.
what about the setups that never triggered?
the ones that looked perfect but never gave you an entry?
those are worth reviewing too.
sometimes understanding why you didn’t get a trade is just as useful as studying the ones you took.
a liquidity sweep isn’t automatically a reversal.
price taking out a previous high or low is only one piece of information.
what happens after the sweep matters more.
does price reject the level and displace away?
or does it accept prices beyond it and continue?
the sweep gets your attention. the reaction gives you context.
you don’t need a chart full of indicators to understand where price might be heading.
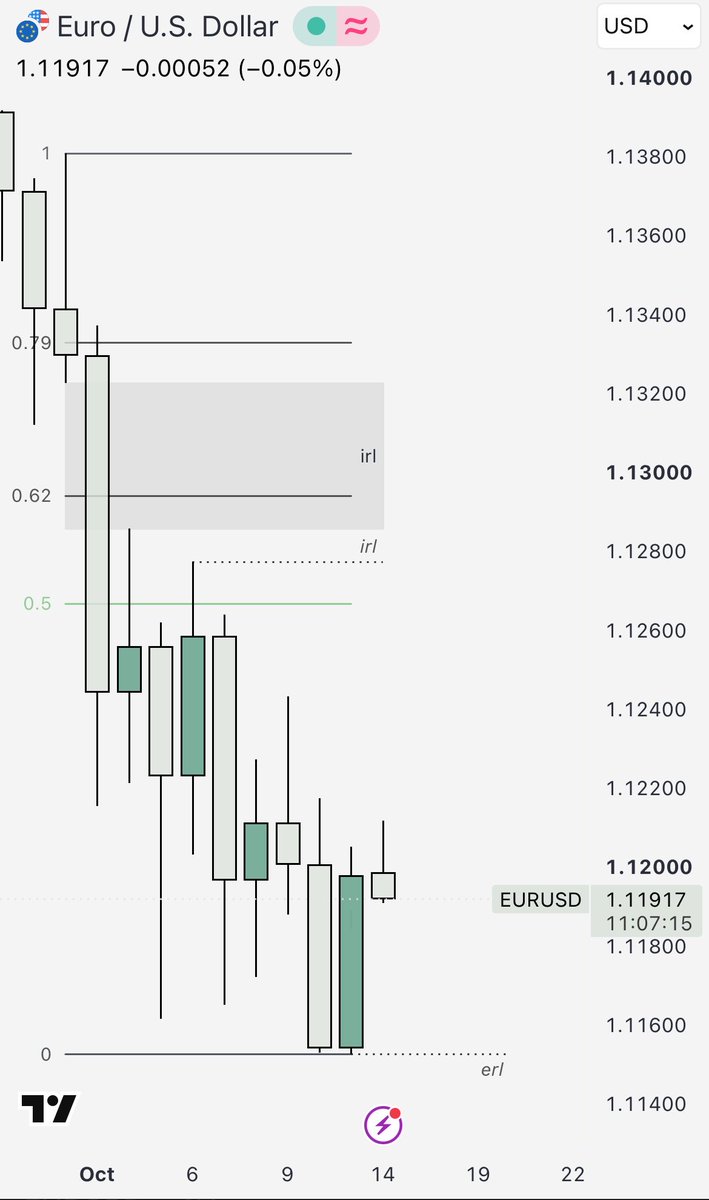
start with a dealing range.
ERL = liquidity above the range high or below the range low.
IRL = areas within the range, including fair value gaps (FVGs).
and that’s something traders sometimes overlook.
IRL isn’t just internal swing points. an imbalance can also be a draw on liquidity.
sometimes a box and a few key levels are enough to build a framework for bias.