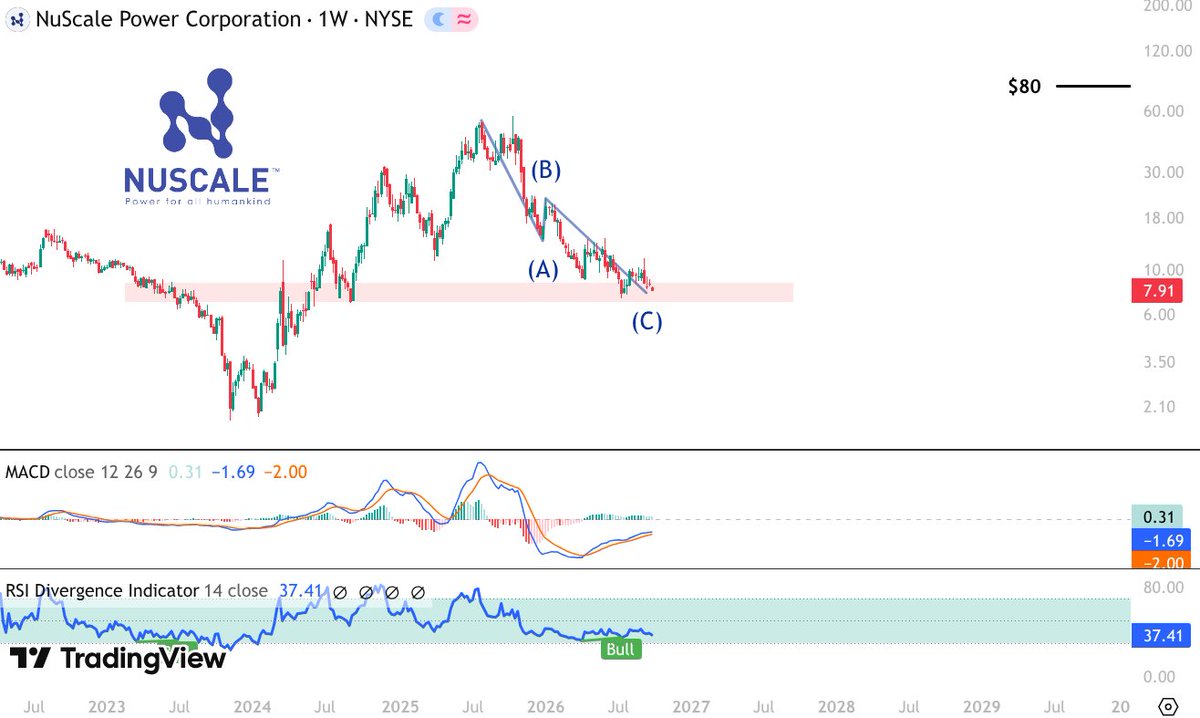
$SMR was a $50 stock now trading at $7.90
10x potential.
Nuclear stocks forming a base. ABC correction again.
Look below for angry comments.
My 2030 PT: $80
$SOFI vs $NU - 7 Images 7 Metrics
Which is the better business and longterm opportunity? 🧵 👇
👉 $SOFI with a current marktcap. of $23.62B or $NU with $73.57B?
$STRL KEY READ-THROUGHS FROM STERLING INFRASTRUCTURE Q2 2026 EARNINGS CALL
Sterling Infrastructure’s Q2 2026 earnings call provides a powerful confirmation that the physical buildout supporting hyperscale computing, data centers, semiconductor manufacturing, and other mission-critical infrastructure remains supply-constrained rather than demand-constrained. The most important cross-market signal is not simply Sterling’s 192% E-Infrastructure revenue growth or the more than $7bn of signed backlog, unsigned awards, and future-phase opportunities. The more differentiated conclusion is that project demand is now exceeding the industry’s available supply of electricians, project managers, regional operating teams, and heavy equipment. This is structurally positive for scaled specialty contractors, electrical and thermal-management equipment manufacturers, regulated utilities, grid contractors, earthmoving-equipment suppliers, and construction-material producers. It is simultaneously negative for near-term contractor revenue conversion, labor costs, acquisition discipline, capital intensity, and free-cash-flow quality. The call also highlights a widening divergence between private mission-critical construction and traditional public highway or residential construction: capital and resources are migrating aggressively toward data centers and advanced manufacturing, while residential activity remains weak and low-bid highway work is being deliberately abandoned. Sterling did not identify its hyperscale, semiconductor, EV-manufacturing, equipment, materials, or utility counterparties. Company-level implications below therefore represent sector read-throughs and public-market proxies rather than assertions of direct customer or supplier relationships.
MISSION-CRITICAL ELECTRICAL AND MECHANICAL CONTRACTORS
SCALE, EXECUTION CREDENTIALS AND REPEAT-PHASE AWARDS ARE CREATING AN INCUMBENCY MOAT IN MISSION-CRITICAL CONSTRUCTION (READ-THROUGH 1)
AFFECTED COMPANIES: Sterling Infrastructure, Inc. (STRL: US); EMCOR Group, Inc. (EME: US); Comfort Systems USA, Inc. (FIX: US); Quanta Services, Inc. (PWR: US).
DIRECTIONAL IMPACT AND MAGNITUDE: Positive, high for Sterling; positive, moderate-to-high for EMCOR and Comfort Systems; positive, moderate for Quanta Services.
CATALYST CLASSIFICATION: Near-term trading catalyst through bookings, backlog and margin performance; longer-duration fundamental shift through customer incumbency and multiyear campus programs.
CALL SUPPORT: Sterling’s E-Infrastructure revenue increased 192%, CEC electrical revenue increased 140%, mission-critical projects represented more than 92% of E-Infrastructure signed backlog, and CEC’s combined backlog reached approximately $2.4bn. CEC is receiving awards for 2nd buildings and later phases at campuses where it is already operating. Sterling initially expected to be working on approximately 1 integrated site-development and electrical project by this point, but it is already active on approximately 3-4. Management stated that most future phases are negotiated directly rather than competitively rebid and summarized the competitive dynamic as: “Once we plant our flag, we are there. We’re not leaving.” Management also reported no material influx of large competitors capable of executing the largest projects.
TRANSMISSION MECHANISM: The initial project award is becoming an entry ticket into a much larger stream of future work rather than an isolated contract. Successful execution on the first building or first site-development phase improves the probability of receiving subsequent buildings, adjacent acreage, electrical packages, and later campus infrastructure. Direct negotiation of later phases reduces rebidding risk, lowers customer-acquisition costs, preserves field mobilization, and allows contractors to monetize accumulated site knowledge. Sterling indicated that later phases generally carry better margins because equipment, workflows, technology, and local operating knowledge improve after the initial phase.
The read-through is strongest for scaled specialty contractors with established mission-critical references, regional labor depth, prefabrication capabilities, and the balance sheet required to mobilize large projects. EMCOR and Comfort Systems are the closest listed specialty-contracting analogs because both compete on technical execution, electrical or mechanical capability, and the ability to deliver large, schedule-sensitive projects. Quanta’s benefit is more indirect but still material because hyperscale campuses require extensive utility interconnection, substation, transmission, communications, and power-infrastructure work in addition to building-level construction.
The competitive structure appears increasingly favorable to incumbents. Sterling continues to encounter small local competitors on initial projects, but management indicated that competition diminishes after the first successful job and that there has been no influx of major new entrants on the largest projects. This suggests that scale alone is insufficient; safety history, project-management depth, customer trust, equipment availability, and the ability to meet aggressive schedules constitute meaningful barriers to entry. The result should be durable pricing discipline and a larger proportion of negotiated work for established operators.
The principal caveat is that Sterling’s site-development margins and integrated delivery model should not be extrapolated mechanically to every peer. Sterling can alter earthmoving methods, equipment size, workflow, and vertical integration to generate margins that are structurally higher than conventional electrical contracting. Nevertheless, the broader signal is highly positive: companies with recognized mission-critical execution capabilities should continue gaining wallet share, receiving repeat phases, and earning returns above undifferentiated construction-industry averages.
ELECTRICIAN AND PROJECT-MANAGER SCARCITY IS A NEAR-TERM NEGATIVE FOR VOLUME CONVERSION DESPITE LONGER-TERM PRICING POWER (READ-THROUGH 2)
AFFECTED COMPANIES: Sterling Infrastructure, Inc. (STRL: US); EMCOR Group, Inc. (EME: US); Comfort Systems USA, Inc. (FIX: US); Quanta Services, Inc. (PWR: US).
DIRECTIONAL IMPACT AND MAGNITUDE: Negative, moderate-to-high for near-term revenue conversion and execution costs; positive, moderate over the longer term for companies capable of recruiting, training and retaining scarce labor.
CATALYST CLASSIFICATION: Near-term trading catalyst through labor availability, wage inflation, project starts and margin conversion; longer-duration fundamental shift through skilled-labor scarcity and barriers to entry.
CALL SUPPORT: Sterling expected it would take approximately 1 year to fill CEC’s available capacity, but that capacity was filled in approximately 90 days. Management stated: “If we had 1,000 or 2,000 more electricians, we’d be growing it even faster.” Customer demand for integrated site and electrical projects already exceeds CEC’s available capacity. Sterling also reported that site-development capacity is becoming tight “for the first time,” particularly as teams are stretched from Atlanta into eastern Texas and from Utah into western Texas. Management further disclosed that the absence of a union electrical operation prevented Sterling from taking electrical scope on a Northeast semiconductor project.
TRANSMISSION MECHANISM: Backlog and customer demand can no longer be translated into revenue using historical conversion assumptions without incorporating labor and regional capacity. The primary limitation has shifted from winning projects to staffing and executing them. This raises the probability that project starts are deferred, opportunities are rejected, or scopes are shared among multiple contractors even when customer demand remains exceptionally strong.
The immediate financial pressures include higher recruiting expense, training costs, wage inflation, overtime, travel and housing costs for geographically displaced crews, onboarding inefficiency, and the need to carry supervisory personnel ahead of revenue. Rapid hiring can also reduce average workforce experience and pressure productivity, rework, safety performance, and project controls. These effects can prevent incremental revenue from converting at historical margins even when contractual pricing is stable.
The union issue is an important competitive and geographic signal. Sterling explicitly indicated that a union electrical capability would have enabled participation in a New York semiconductor project. In union-intensive jurisdictions, contractors with established local labor relationships and the ability to mobilize union electricians possess a larger addressable market than contractors attempting to import a nonunion operating model. The transcript does not identify which contractor received the electrical scope, so no direct beneficiary can be attributed. However, the comment supports a relative advantage for scaled electrical contractors with flexible regional labor models.
Longer term, labor scarcity is favorable for pricing and competitive concentration. Sterling reported that customers attempted to introduce less favorable electrical contract terms, but Sterling refused them and had not observed a fundamental change in pricing or contractual conditions. Contractors with sufficient labor capacity can remain selective, reject unattractive terms, and prioritize projects with repeat-phase potential. Prefabrication, modular assembly, training academies, apprenticeship programs, and standardized project processes should therefore become increasingly important sources of relative margin performance.
The investment implication is that strong demand should not automatically be modeled as unconstrained revenue growth. For Sterling, EMCOR, Comfort Systems, and Quanta, headcount, skilled-trade availability, labor productivity, safety indicators, and project-management capacity are now more important leading indicators than the nominal size of the opportunity pipeline. Companies that demonstrate simultaneous labor growth and stable productivity should earn a scarcity premium. Companies that report strong backlog but weak conversion or rising execution costs should experience estimate and valuation pressure.
CAPACITY-DRIVEN M&A WILL INCREASE CONSOLIDATION BUT MAY REDUCE THE QUALITY OF INCREMENTAL GROWTH (READ-THROUGH 3)
AFFECTED COMPANIES: Sterling Infrastructure, Inc. (STRL: US); APi Group Corporation (APG: US); EMCOR Group, Inc. (EME: US); Comfort Systems USA, Inc. (FIX: US); Quanta Services, Inc. (PWR: US).
DIRECTIONAL IMPACT AND MAGNITUDE: Negative, moderate for acquisition returns and near-term earnings quality; positive, moderate for scarce regional contractors and skilled-labor platforms that become acquisition targets.
CATALYST CLASSIFICATION: Near-term trading catalyst through acquisition announcements, purchase multiples and financing; longer-duration fundamental shift through specialty-contractor consolidation.
CALL SUPPORT: Sterling expanded its revolving facility to $1.5bn and explicitly linked the additional liquidity to organic growth and acquisitions. Management stated that Sterling is “going to need to add more acquisitions for capacity” and that future deals will be required not only for strategic services or geographic entry, but also for “pure capacity add.” Management is considering smaller regional contractors in Texas, New Mexico, Oklahoma and surrounding markets because few large-scale targets are available. The strongest statement was that Sterling could add “2 or 3 more CECs to the Texas market” if suitable opportunities emerged. Sterling also reported seeing more high-quality acquisition targets than 1 year earlier.
TRANSMISSION MECHANISM: The acquisition rationale is shifting from optional strategic expansion to operational necessity. When skilled labor, project managers, equipment, and local leadership cannot be developed rapidly enough internally, acquisitions become the fastest method of obtaining executable capacity. That increases the strategic value of regional electrical and site-development contractors even when their standalone financial performance is less attractive than that of the acquiring company.
The likely consequence is higher transaction multiples for companies with scarce electricians, proven project managers, mission-critical customer references, or operations in Texas and the Southeast. Buyers are no longer purchasing only revenue and EBITDA; they are purchasing the ability to execute work that would otherwise be declined. This can justify strategic premiums but also reduces prospective returns and increases the risk that revenue growth is purchased at margins below the acquirer’s existing portfolio.
Sterling’s own call illustrates the margin risk. Mature site-development operations were producing adjusted operating margins in the upper-20% range, while CEC was producing approximately 12% and Stone Ridge was described as a mid-teens margin business. Acquisitions can be highly accretive to absolute earnings while initially diluting consolidated margins. The critical variables become purchase price, revenue retention, labor retention, customer cross-selling, integration costs, capital expenditure requirements, and the time required to improve acquired margins.
The consolidation read-through extends to APi Group, EMCOR, Comfort Systems, and Quanta, all of which operate in fragmented specialty-contracting markets where local labor and customer relationships are important. The risk is not that these companies lack access to capital. The risk is that a competitive market for scarce contractor capacity causes acquisition multiples to rise faster than achievable synergies.
The accounting and cash-flow implications are also negative at the margin. A more acquisition-dependent growth model generally produces greater intangible amortization, stock compensation, transaction expense, earn-outs, goodwill, and integration spending. Adjusted EBITDA and adjusted EPS can continue growing rapidly while GAAP earnings and free-cash-flow conversion become less clean. Investors are therefore likely to place greater weight on organic growth, acquired-margin progression, cash returns on invested capital, and post-acquisition labor retention.
The longer-term industry implication is favorable for consolidation economics but less favorable for undiscriminating acquirers. Companies with repeatable integration systems and strict return thresholds should strengthen their competitive position. Companies that treat acquisition capacity as a substitute for organic operating discipline risk paying peak-cycle prices for labor and equipment that may prove difficult to integrate.
LUMPY HYPERSCALE AWARDS CREATE A NEAR-TERM BACKLOG AND MULTIPLE RISK EVEN WHEN DEMAND IS UNCHANGED (READ-THROUGH 4)
AFFECTED COMPANIES: Sterling Infrastructure, Inc. (STRL: US); Comfort Systems USA, Inc. (FIX: US); EMCOR Group, Inc. (EME: US); Quanta Services, Inc. (PWR: US).
DIRECTIONAL IMPACT AND MAGNITUDE: Negative, high near term for Sterling; negative, low-to-moderate as a sentiment read-through for other high-multiple infrastructure contractors; neutral to positive longer term if awards convert in Q4 2026 and early 2027.
CATALYST CLASSIFICATION: Primarily a near-term trading catalyst.
CALL SUPPORT: Sterling delivered Q2 signed book-to-burn of 1.4x and combined book-to-burn of 1.3x excluding Stone Ridge, even during a record revenue quarter. Nevertheless, management warned that softer Q3 awards and strong Q3 revenue burn “could result in a sequential backlog decline in the third quarter.” Management characterized the expected decline as “award timing, not a change in demand” and said stronger award activity is expected in Q4 2026 and Q1 2027.
TRANSMISSION MECHANISM: Publicly traded infrastructure contractors are increasingly valued on backlog growth, book-to-burn, and multiyear demand visibility rather than only on current-period earnings. A sequential backlog decline can therefore trigger estimate reductions and multiple compression even when management has advance visibility into later awards. The market may treat a falling backlog as evidence that data-center demand is peaking, customers are slowing capital commitments, or contractor share is weakening.
Sterling’s warning indicates that hyperscale project awards remain highly concentrated and lumpy. A quarter containing 3-4 large awards can produce exceptional order growth, while a quarter containing 1 or no major awards can create an apparent slowdown. This makes quarterly book-to-burn less informative in isolation and increases the importance of examining unsigned awards, future phases, customer planning activity, and the timing of known bid packages.
The near-term risk is greatest for Sterling because management has explicitly established the expectation of a Q3 decline. Even if the result is consistent with guidance, the absolute backlog number could create negative headlines and systematic pressure on the shares. The broader read-through for Comfort Systems, EMCOR, and Quanta is primarily one of sector sentiment: investors may interpret weak quarterly awards at one contractor as an industry slowdown even when the weakness reflects customer timing.
The longer-duration implication depends entirely on subsequent conversion. A Q3 backlog decline followed by strong Q4 and early-2027 awards would validate management’s explanation and could create a favorable estimate-revision setup. A decline followed by another weak award quarter would be materially more concerning because the explanation would shift from timing toward demand, capacity, competition, or customer-budget risk.
The most relevant indicators are Q3 signed and combined book-to-burn, conversion of unsigned awards into contracts, changes in future-phase opportunities, and the size of Q4 awards. The market should distinguish revenue burn caused by strong project execution from backlog contraction caused by insufficient demand. Sterling’s Q2 evidence supports the former interpretation, but the Q4 conversion burden remains significant.
HYPERSCALE COMPUTING AND DATA-CENTER OPERATORS
HYPERSCALE CAMPUS PROGRAMS ARE BECOMING LONGER-DURATION, LARGER AND MORE CAPITAL-INTENSIVE (READ-THROUGH 5)
AFFECTED COMPANIES: Representative public hyperscale cohort, not confirmed Sterling customers: Microsoft Corporation (MSFT: US); https://t.co/SpqvHNUxpK, Inc. (AMZN: US); Alphabet Inc. (GOOGL: US); Meta Platforms, Inc. (META: US); Oracle Corporation (ORCL: US).
DIRECTIONAL IMPACT AND MAGNITUDE: Positive, high for long-term computing-capacity and cloud-revenue potential; negative, moderate for near-term free cash flow, depreciation, and capital efficiency.
CATALYST CLASSIFICATION: Near-term trading catalyst through capital-expenditure and free-cash-flow guidance; longer-duration fundamental shift through multiyear campus development.
CALL SUPPORT: Management said data-center customer activity is “stronger than ever,” with projects becoming “larger, lasting longer, and expanding into more markets.” Existing projects are expanding beyond their original scope. Management described examples in which customers plan 5 buildings on the first 300 acres, another 5 buildings on an adjacent 300 acres, and then purchase an additional 600 acres contiguous with an existing site. Some projects may keep Sterling on site for “5 to 8 to 12 years.” Management further stated that the work coming from Sterling’s “top hyperscalers” requires the company to add capacity materially faster, although no customers were identified.
TRANSMISSION MECHANISM: The call supports a multiyear infrastructure cycle rather than a short-duration construction surge. The purchase of adjacent acreage before initial campuses are completed suggests that large computing customers are planning clusters of buildings, power infrastructure, roads, utilities, and electrical systems well beyond currently contracted phases. This reduces the probability of an abrupt industrywide capital-expenditure cliff, because a material portion of future construction is embedded in phased campus plans rather than isolated annual decisions.
The positive strategic implication is that hyperscalers are securing the physical capacity required to expand cloud computing, AI training, AI inference, data storage, and related services. Larger campuses can improve network density and operating scale once energized. Continued infrastructure investment also reduces the risk that long-term computing demand is constrained by insufficient data-center capacity.
The negative financial implication is that expenditure occurs well before full revenue utilization. Land acquisition, site preparation, substations, transmission interconnection, electrical installation, cooling, and building construction can precede customer revenue by several years. Projects lasting 5-12 years imply a longer period of elevated capital intensity and a larger future depreciation base. Free cash flow may therefore remain under pressure even when reported revenue and operating income continue growing.
The physical-capacity bottleneck also creates execution risk. Sterling’s demand exceeds available electricians and site-development capacity, suggesting that hyperscaler capital plans cannot be executed solely by increasing budgets. Skilled labor, project managers, equipment, grid interconnections, power supply, and local permitting can constrain the activation date of new capacity. This creates a possible divergence between reported capital expenditure and usable computing capacity.
The company-specific implication cannot be determined because Sterling did not disclose customer identities. The listed companies are representative sector proxies rather than confirmed counterparties. The high-conviction sector conclusion is that the physical buildout is durable, but the equity impact is mixed: infrastructure duration supports long-term cloud and AI capacity while reinforcing near-term capital-expenditure, depreciation, and free-cash-flow burdens.
@mehusan זלזול במרואיינים,
זה הקטע הלא פתור,
אומר לך את זה מישהו שהיום מראיין,
והתראיין לתפקידים בכירים,
עד שזה לא יכאב לחברות בכיס,
הן ימשיכו להתייחס לזה כנטל ומשהו שנדחק לסוף רשימת המשימות של כל בעל תפקיד…
HONEYWELL $HON JUST REPORTED EARNINGS
EPS of $4.52 missing expectations of $4.81🔴
Revenue of $9.7B beating expectations of $9.5B🟢
Honeywell slightly raised 🟢 its fiscal year 2026 guidance for EPS while slightly lowering 🔴 its FY26 guidance for revenue
$MU $SNDK $SKHY $DRAM Memory/storage are weak again pre, however, SKHY is green. It will be interesting to see how the day unfolds. Nothing has invalidated the GAI infrastructure trade in the past five days; if anything, the release of Kimi 3 has confirmed it. Most of the names I regularly discuss will reach all-time highs again and then some. It's hard to predict how long it will take, and it will happen. Invest accordingly and avoid putting yourself in a position of potential forced liquidation, even if buying at current levels. Stock prices could still continue lower.
$MELI GMV Growth is quite impressive.
Since 2012, GMV has grown by 1,139%, a CAGR of 21%!
In Q1 2026, GMV grew by an impressive 42% Y/Y to $18.9B, the fastest growth rate in many years.
What GMV $MELI will have in 2040?
- 10% CAGR = $272B
- 15% CAGR = $529B
- 20% CAGR = $1T
JUST IN: $NBIS is investing £1.7 billion to expand its UK footprint with three new $NVDA infrastructure deployments, accelerating its growth across Europe.
🟡 $BRUN : $472M Mira Murati contract, target hiked to $45. The institutional read -> bullish, but underwritten.
The signal: that Thinking Machines deal is 36-month take-or-pay (paid regardless of usage). Backlog up ~10x in two quarters, ARR guided past $400M, customers prepaying the buildout, cash flow positive. High-quality revenue for an early neocloud. ✅
The catch: the 85.6% gross margin excludes colo rent and GPU depreciation add them back and Q1 was roughly breakeven. It’s a lease-financed bet on B300 residual values and one frontier lab honoring its contract. Plus a ~37% share overhang unlocking as early as June.
What I’m watching: GPU depreciation and customer concentration -> the two numbers that matter more than the backlog. This is $CRWV risk in miniature, without the scale to absorb a misstep. The supply unlock is a near-term overhang; the structural question is whether residual values and counterparties hold.
Real asymmetry, real fragility. Both true at once. 👀
$WSE - the fintech behind cheap international money transfers.
🔴 -12% 👀 Buying opportunity? 👇
Today's ~12% plunge stems from news of a Belgian prosecutor investigation into potential anti-money laundering (AML) compliance issues. Belgian authorities are probing whether Wise Europe accounts handled ~€500 million in suspicious transactions linked to fraud, corruption, and drug trafficking across Europe.
Key Context on the Drop 👇
Wise confirmed it's cooperating and responding to queries (routine for such firms) but noted no specific findings yet and that the probe (opened last year) is nearing completion.
The €500M figure is tiny compared to Wise's scale: ~$243 billion in cross-border volume last year for millions of customers.
Similar regulatory scrutiny is common in fintech/banking; resolution could be a non-event or lead to fines/remediation, but it's not existential.
The stock has been volatile post its Nasdaq debut in May 2026. It hit highs near 16-17.47 but pulled back amid broader market dynamics and this news.
Fundamentals look solid 👇
• Business: Strong moat in low-cost cross-border payments (disrupting banks). High customer growth, expanding "Wise Platform" for businesses, and good unit economics.
• Financials (recent): Revenue growth in the 20-30%+ range historically, ~22% profit margins, solid cash flow, low debt. EPS (TTM) ~0.50, P/E ~25-26x.
• Growth: Analysts project continued expansion in international remittances and platform services. Long-term runway is attractive as global money movement digitizes.
Valuation: Current price trades at a discount to analyst targets of ~16-17.50 (25%+ upside).
Risks to Consider 👇
• Regulatory/execution: AML issues could lead to fines, higher compliance costs, or reputational hits. Fintechs face ongoing scrutiny.
• Competition: From banks, Revolut, PayPal, stablecoins, etc.
• Valuation sensitivity: Growth stock, so misses on margins or slowdowns could pressure it further.
• Market sentiment: Post-Nasdaq volatility and any broader fintech weakness.
👉 Bottom line: For investors with a 1-3+ year horizon who believe in Wise's core model, today's panic sell-off creates an attractive entry point near multi-month lows, especially if the Belgian probe resolves without major penalties. It's not risk-free (do your due diligence, consider position size).
$NSRX is shaping up well. Price is sliding into a key accumulation pocket as Wave 2 matures. A solid reversal here could ignite a strong Wave 3 leg.
Keeping it on watch and planning for a potential entry this week.
@TheFlowShark
$MPWR $ADI $STM $TXN $NVTS $ON EXECUTIVE OVERVIEW
The source material is best understood as an NVIDIA MGX 800 VDC power distribution board ecosystem display rather than a GPU, accelerator, or motherboard exhibit. The wall shows 11 named supplier groups participating in 800 VDC rack power delivery: Analog Devices, Delta, Infineon, Innoscience, Megmeet, Monolithic Power Systems, Navitas, onsemi, Renesas, STMicroelectronics, and Texas Instruments. The visible board set spans 800 V hot-swap protection and DC/DC conversion from 800 V to 50 V, 12 V, and 6 V, indicating that the industry is not converging on 1 immediate downstream rail but is instead preparing for a phased, multi-topology transition. NVIDIA frames 800 VDC as a response to the limitations of legacy 54 V rack-level distribution, with the stated objectives of reducing current, copper usage, cable bulk, conversion stages, energy loss, and compute-space power-delivery volume. (NVIDIA)
The investment significance is that rack power has become a primary scaling constraint in AI infrastructure, not a secondary component category. The display is a physical manifestation of a platform-level architectural shift: power delivery is being pulled into the same ecosystem-control model as GPUs, networking, cooling, and rack mechanics. NVIDIA has stated that 800 VDC infrastructure is intended to support 1 MW IT racks and beyond starting in 2027, and that full-scale production of 800 VDC data centers is expected to coincide with Kyber rack-scale systems. (NVIDIA Developer) This points to a design-win cycle that is occurring well ahead of revenue recognition, with qualification, safety, reliability, and standards decisions likely to drive relative winners before reported financial contribution becomes visible.
The display should not be interpreted as evidence that any 1 supplier has a protected monopoly socket. It argues the opposite. Multiple vendors are shown at each level of the power tree, including hotswap, 50 V conversion, 12 V conversion, and 6 V conversion. NVIDIA appears to be deliberately cultivating a broad, multi-sourced electrical ecosystem to avoid vendor concentration and accelerate availability of qualified designs. This is bullish for the overall AI power-delivery TAM, but it is more nuanced for individual equities: early validation can expand revenue optionality, while eventual open reference designs and multi-sourcing can compress scarcity premiums.
TECHNICAL READ-THROUGH
The architectural migration is driven by basic power physics. At 1 MW, an 800 V bus carries roughly 1,250 A before conversion losses. The same 1 MW at 54 V would require roughly 18,519 A, and at 48 V roughly 20,833 A. For a constant conductor resistance, I²R loss at 54 V is approximately 219x higher than at 800 V, and at 48 V approximately 278x higher than at 800 V. Real-world systems resize conductors, segment bus paths, and introduce converter losses, so the realized savings are not equal to the pure physics ratio. However, the direction and magnitude of the design pressure are decisive: low-voltage rack distribution becomes increasingly unattractive as racks move from 100 kW-class systems toward hundreds of kilowatts and ultimately 1 MW-class racks. NVIDIA quantifies the benefit of switching from 415 VAC to 800 VDC distribution as 85% more power transmitted through the same conductor size, 45% lower copper requirements, and up to 5% improvement in end-to-end efficiency versus current 54 V systems. (NVIDIA Developer)
The image captures the likely transition architecture from current data center power distribution to native high-voltage DC. Today’s data center power chain generally involves medium-voltage utility input, step-down to low-voltage AC, UPS conditioning, AC distribution through PDUs and busways, rack-level AC/DC conversion into a 48 V or 54 V bus, and further conversion near compute trays and processors. NVIDIA’s 800 VDC vision centralizes AC/DC conversion at the facility level, distributes 800 VDC through the data hall, and shifts the critical conversion work to high-density DC/DC converters closer to the compute load. NVIDIA has described the Kyber-era MGX evolution as distributing high voltage directly to each compute node, where a high-ratio 64:1 LLC converter steps down to 12 VDC adjacent to the GPU; NVIDIA also states that this 1-stage conversion is more efficient and occupies 26% less area than traditional multi-stage approaches. (NVIDIA Developer)
The visible rails on the display are especially important. 800 V-to-50 V is the least disruptive path because it preserves compatibility with the broad 48 V/54 V ecosystem and existing downstream voltage regulator designs. 800 V-to-12 V is a more aggressive topology that reduces intermediate conversion stages while still feeding a familiar voltage domain. 800 V-to-6 V is the most forward-looking path because it moves the bus voltage closer to the GPU core regulator input and can remove another conversion layer, but it also creates very high current density at the board level. STMicroelectronics explicitly states that 50 V, 12 V, and 6 V intermediate DC buses will coexist in AI data centers depending on rack density, GPU configuration, server form factor, and cooling strategy. (ST News) That is consistent with the display’s structure: this is not a 1-rail standardization event; it is a portfolio of voltage-transition options.
The 6 V path should be viewed as high strategic optionality but not a guaranteed universal endpoint. Moving from 12 V to 6 V doubles current for the same power. A 20 kW load at 12 V requires roughly 1,667 A; the same 20 kW at 6 V requires roughly 3,333 A. That increases the importance of converter proximity to the accelerator, low-inductance packaging, busbar design, connector performance, thermal extraction, transient response, and fault isolation. The tradeoff is that 6 V can reduce conversion losses and improve voltage-regulator-stage efficiency when placed close enough to the load. Texas Instruments’ announced NVIDIA-aligned architecture uses only 2 conversion stages from 800 V to GPU core power: an 800 V-to-6 V isolated bus converter followed by a 6 V-to-<1 V multiphase buck converter, with the 800 V-to-6 V converter specified at 97.6% peak efficiency and more than 2,000 W/in³ power density. (Texas Instruments) Navitas separately disclosed an 800 V-to-6 V GaN-based board targeting 96.5% peak efficiency at full load, 1 MHz switching, and 2,100 W/in³ power density. (Navitas Semiconductor)
SOURCE MATERIAL OBSERVATIONS
The display’s supplier mapping is itself the core data. Analog Devices appears in 800 V hot-swap and 800 V-to-6 V. Delta appears in 800 V hot-swap plus 800 V-to-50 V and 800 V hot-swap plus 800 V-to-12 V. Infineon appears across 800 V hot-swap, 800 V-to-12 V, 800 V-to-50 V, and 800 V-to-6 V. Innoscience appears in 800 V-to-50 V. Megmeet appears in 800 V hot-swap plus 800 V-to-50 V, 800 V hot-swap plus 800 V-to-12 V, and a smaller 800 V-to-12 V implementation. Monolithic Power Systems appears in 800 V hot-swap plus 800 V-to-50 V, 800 V hot-swap plus 800 V-to-12 V, and 800 V-to-6 V. Navitas appears in 800 V-to-6 V. onsemi appears in 800 V-to-12 V. Renesas appears in 800 V-to-50 V and 800 V-to-12 V. STMicroelectronics appears in 800 V-to-50 V, 800 V-to-12 V, and 800 V-to-6 V. Texas Instruments appears in 800 V hot-swap, 800 V-to-12 V, and 800 V-to-6 V.
The repeated presence of “hot-swap” labels is a key technical signal. High-voltage DC rack systems require safe insertion, removal, fault isolation, inrush-current management, arc mitigation, telemetry, and fast protection. At 800 VDC, hot-swap is not an ancillary control function; it is a core availability and serviceability requirement. Analog Devices emphasizes rack-level hot-swap protection, high-voltage conversion, digital control, telemetry, and scalable modules for 800 VDC AI infrastructure. (Analog Devices) Infineon describes the move to centralized 800 V HVDC as enabling power conversion directly at the GPU within the server board and highlights the need for silicon, SiC, and GaN expertise from grid to core. (Infineon) The presence of many hot-swap boards suggests that protection, monitoring, and controllability may be among the highest-value analog sockets in the architecture because failure at this layer can compromise rack uptime regardless of converter efficiency.
The board-form-factor differences are also informative. Several 800 V-to-6 V examples appear as long, low-profile boards, consistent with a need for low-height, near-load integration. Several hotswap/50 V and hotswap/12 V examples appear larger and more heavily thermally managed, consistent with rack- or tray-level power conversion where heat dissipation and isolation dominate mechanical design. The display does not expose part numbers, power ratings, qualification status, or BOM composition, so exact revenue content cannot be inferred. However, the mix of small control boards, larger conversion modules, and long high-current boards indicates that the opportunity spans controllers, power stages, wide-bandgap devices, magnetics, isolation, sensors, firmware, packaging, busbars, connectors, and thermal interfaces.
SUPPLIER AND COMPETITIVE IMPLICATIONS
Analog Devices and Texas Instruments are positioned most clearly around analog control, protection, telemetry, and broad system-level power management. That is attractive because 800 VDC adoption increases the value of precision sensing, isolation, hot-swap control, fault detection, and digital telemetry. The challenge is that these companies are large, diversified analog franchises, so even meaningful early AI power growth may be diluted at the consolidated revenue level. TI’s disclosure of a complete 800 VDC solution, including hot-swap, 800 V-to-6 V, and 6 V-to-<1 V conversion, indicates a credible attempt to own more of the end-to-end reference design rather than only supplying discrete control ICs. (Texas Instruments)
Infineon, STMicroelectronics, onsemi, and Renesas appear to be competing from the position of broad power semiconductor platforms. Their advantage is breadth across silicon, SiC, GaN, drivers, controllers, MOSFETs, protection, and automotive- or industrial-grade reliability processes. onsemi states that its portfolio addresses high-voltage AC/DC conversion, power supply units, 800 VDC distribution, and core power delivery, using silicon and SiC technologies with monitoring and control. (onsemi) Renesas highlights GaN FETs for faster switching, lower energy losses, thermal management, and up to 98% efficiency in LLC DCX-based DC/DC converters. (Renesas Electronics) This creates a credible multi-vendor field rather than a clear 1-company semiconductor bottleneck.
STMicroelectronics is notable because its public positioning aligns closely with the rails displayed in the source material. ST states that its 12 V and 6 V architectures complement an existing 800 V-to-50 V solution and that its portfolio addresses 50 V, 12 V, and 6 V power distribution inside gigawatt-scale compute infrastructure. ST also frames the 6 V path as a means to reduce conversion stages, move the bus closer to the GPU, reduce copper usage, minimize resistive losses, and improve transient performance. (ST News) That is highly aligned with the visible board set and supports the conclusion that multiple rails will remain in play through the transition.
Navitas and Innoscience represent higher-beta GaN exposure. Their strategic relevance increases if the industry shifts toward direct 800 V-to-6 V or ultra-high-frequency conversion stages that strongly favor GaN switching speed, power density, and lower switching loss. Navitas explicitly positions its 800 V-to-6 V board as eliminating the traditional 48 V intermediate bus converter stage, reducing conversion losses, freeing board space, and improving end-to-end efficiency. (Navitas Semiconductor) Innoscience claims full-link GaN coverage from 800 V input to GPU terminal conversion, spanning 15 V to 1,200 V devices, and argues that high-frequency GaN can shrink magnetics and improve power density. (InnoScience) The counterbalance is that high-beta GaN names face higher execution risk, qualification risk, reliability burden, and potential margin erosion if the ecosystem standardizes around multi-sourced reference designs.
Delta and Megmeet represent the system-level and power-shelf layer. This layer may capture larger dollar content per rack than individual IC sockets, but typically with different margin structure, heavier manufacturing requirements, and more integration responsibility. Delta’s public disclosures are particularly relevant: it states that its 800 VDC grid-to-chip solutions include solid-state transformer conversion from medium-voltage AC to an 800 VDC bus, HVDC/DC power distribution boards enabling 800 V-to-12 V output at up to 98.5% efficiency, and 1.1 MW in-row power delivery to bridge legacy infrastructure with forward-looking rack designs. (Delta Americas) This underscores that the investment opportunity is not confined to semiconductor vendors; power shelves, in-row power, busway, cooling, and facility electrical equipment may capture significant economics.
Monolithic Power Systems is strategically visible because the display shows it across 50 V, 12 V, 6 V, and hotswap-associated designs. That breadth supports its relevance to AI power architecture, but the display also weakens any simplistic view that MPS alone controls the NVIDIA AI power transition. The read-through is positive for TAM and validation, but mixed for moat if customers can qualify several suppliers across the same voltage rails. The key financial question is not whether MPS participates, but whether it sustains differentiated efficiency, integration, reliability, and customer qualification fast enough to defend premium gross margin as the ecosystem broadens.
ARCHITECTURE AND TAM IMPLICATIONS
The primary TAM driver is power density per rack, not just data center square footage or server count. When rack power moves from 100 kW-class levels toward 500 kW and 1 MW, the power-delivery content per rack scales dramatically. Each rack requires protection, isolation, conversion, telemetry, connectors, busbars, liquid-cooled or airflow-managed thermal paths, and facility integration. NVIDIA’s own discussion of legacy 54 V limitations highlights space constraints, copper overload, and inefficient conversions as racks exceed 200 kW, including a reference to 1 MW rack requirements. (NVIDIA Developer) This suggests that the AI power stack could become a larger attach-rate opportunity per GPU cluster even if accelerator ASPs eventually normalize.
The economic value of efficiency is nontrivial at 1 MW-class density. A 5% power-efficiency improvement at a 1 MW rack equates to 50 kW of continuous avoided power draw. Over 8,760 hours, that is 438 MWh per rack-year. At $0.10 per kWh, the avoided electricity cost is approximately $43,800 per rack-year before demand charges, cooling leverage, PUE effects, downtime benefits, and capex offsets. At $0.15 per kWh, it is approximately $65,700 per rack-year. Across 1,000 1 MW racks, the same simple power-only math is $43.8 million to $65.7 million per year. This is why modest-looking efficiency percentages can justify material capex in hyperscale AI factories. NVIDIA cites up to 5% end-to-end power-efficiency improvement and up to 30% TCO reduction from gains in efficiency, reliability, and system architecture. (NVIDIA Developer)
The transition also shifts value from server-level PSUs toward rack-, row-, and facility-level power conversion. This has 2 consequences. 1st, the power supply chain becomes more strategic and may be designed into AI clusters earlier, alongside GPU, networking, and liquid cooling decisions. 2nd, brownfield adoption is likely to be uneven. Some data centers may adopt in-row AC-to-800 V conversion to support 800 V racks without immediately rebuilding the entire electrical backbone. Others may move toward deeper facility-level DC distribution over time. NVIDIA’s ecosystem note states that the transition to fully realized 800 VDC architecture will occur in phases to give the industry time to adapt and the component ecosystem to mature. (NVIDIA Developer)
RISK ASSESSMENT
The most important caveat is that a booth display is not the same as a high-volume qualified production socket. The source material shows demonstrator boards and supplier positioning, not final BOM awards, pricing, volume commitments, reliability data, customer-specific qualification status, or service-life test results. For investment purposes, the distinction is critical. The image supports the existence of broad design activity; it does not prove revenue timing, share allocation, or gross margin durability.
Safety and reliability remain gating factors. 800 VDC fault interruption is harder than lower-voltage DC or AC systems because high-energy DC arcs do not benefit from natural AC zero crossings. The system must handle inrush current, short-circuit current, connector touch safety, hot insertion, fault containment, telemetry, service workflows, and technician training. NVIDIA has acknowledged that facility-level VDC introduces challenges in safety, standards, workforce training, capex, opex, and deployment. (NVIDIA Developer) The prominence of hot-swap boards in the display should therefore be interpreted as a sign that protection and serviceability are central to commercialization, not peripheral features.
Standards risk is also material. NVIDIA is pushing 800 VDC, but broad adoption requires interoperability across voltage ranges, connectors, rack mechanics, safety practices, power shelves, facility equipment, and monitoring systems. NVIDIA specifically points to Open Compute Project participation as important for interoperability, cost reduction, voltage-range alignment, connector interfaces, and safety practices. (NVIDIA Developer) A fragmented standards environment would slow deployment, increase qualification costs, and reduce near-term volume visibility for component suppliers.
There is also a topology risk. The display includes 50 V, 12 V, and 6 V because no single rail is universally optimal across all rack densities, GPU generations, cooling designs, and server form factors. 50 V protects compatibility and may dominate transitional systems. 12 V reduces stages while preserving a more familiar power domain. 6 V maximizes proximity and conversion-stage reduction but creates extreme current-delivery requirements. The coexistence of these rails is positive for broad supplier opportunity, but it complicates forecasts because a supplier’s revenue content depends heavily on which rail is adopted in which platform generation.
COMPETITIVE CONCLUSION
The display is structurally bullish for AI infrastructure power content and for the strategic relevance of analog, power semiconductor, power module, and rack-power suppliers. It is not a clean single-name endorsement. The supplier count and rail diversity imply that NVIDIA is creating a competitive ecosystem with deliberate redundancy. In that framework, the most advantaged suppliers will likely be those able to deliver validated high-voltage protection, high-efficiency isolated conversion, wide-bandgap devices, thermal/mechanical integration, telemetry, manufacturability, and long-life reliability at scale.
The strongest near-term investment read-through is that power delivery is becoming an AI platform-enabling category with earlier design-cycle visibility than traditional commodity power. The more cautious read-through is that many of the visible boards could be engineering demonstrations rather than production awards, and that open ecosystem development may limit sustained excess returns for any 1 supplier. The best risk-adjusted exposure is likely to favor companies that can monetize multiple layers of the stack across hot-swap, controllers, GaN/SiC power stages, modules, telemetry, and system integration, rather than companies dependent on a single conversion rail or a single demonstrator board.
BOTTOM LINE
The source material shows a tangible acceleration of the 800 VDC AI power ecosystem. Its core message is that megawatt-class AI racks require a new power architecture, and that NVIDIA is actively organizing a broad supplier base to make that architecture production-ready. The technical direction is clear: higher voltage distribution, fewer conversion stages, lower copper intensity, more telemetry, more hot-swap intelligence, higher power density, and closer conversion to the GPU. The investment conclusion is positive for the AI power-delivery value chain as a whole, but individual stock selection should be driven by evidence of production qualification, attach rate per rack, rail-specific adoption, reliability track record, and margin defensibility rather than by display presence alone.
$MOD (Bloomberg) -- Modine forecast adjusted Ebitda for 2027 of $650 million to $680 million.
2027 YEAR FORECAST
Sees adjusted Ebitda $650 million to $680 million, estimate $658 million (Bloomberg Consensus)
FOURTH QUARTER RESULTS
Adjusted EPS $1.71, estimate $1.55
EPS $1.36
Net sales $954.4 million, estimate $920.8 million
Adjusted Ebitda $146.1 million, estimate $143.9 million
COMMENTARY AND CONTEXT
Reports Sees Fy27 Net Sales Growth Between 20% & 35%
"We anticipate another strong year for our Data Centers business, supported by our strong customer relationships and significant order book."
$RACE und Jaguar vs. Mercedes-Benz - Wer hat da von wem kopiert? 🤣
Mercedes-Benz $MBG.DE Vision Iconic Elektro-Coupé, erstmals im Oktober 2025 vorgestellt, erinnert mich wie der Jaguar an das #Batmobil 🦇