Building My Career in Data | Day 17
📊 Excel: Power Query Editor for cleaning, transforming data & creating new columns
🗄️ SQL: Learned Window Functions and Cohort Analysis
🧠 Feature Engineering: Label Encoding & Ordinal Encoding.
#DataAnalytics#SQL#Excel#MachineLearning
Building My Career in Data | Day 16
📊 Excel: Power Query basics & importing data from different sources
🗄️ SQL: Dynamic Date Filtering
🧠 Feature Engineering: One-Hot Encoding for converting categorical data into numerical values.
#DataAnalytics#Excel#SQL#MachineLearning
Built My Career in Data | Day 15
📊 Excel: Analysis ToolPak & Data Tables
🗄️ SQL: TO_CHAR() & DATETRUNC() for working with dates
🧠 Feature Engineering: Detecting and handling outliers using box plots and the five-number summary.
#DataAnalytics#SQL#Excel#MachineLearning
Building My Career in Data | Day 14
Today's focus was one of Excel's most powerful features.
📊EXCEL :-
- Learned Pivot Tables,
- Pivot Charts
- Advanced Pivot Table techniques like grouping and hierarchies.
#Excel#DataAnalytics
Building My Career in Data | Day 13
This data jobs salary dashboard was created to help job seekers investigate salaries for their desired jobs and ensure they are being adequately compensated.
#Excel#DataAnalytics#BuildInPublic
𝗗𝗮𝘀𝗵𝗯𝗼𝗮𝗿𝗱
Building My Career in Data | Day 12
📊 Excel: Tables, conditional formatting & collaboration
📈 Power BI: Charts, custom visuals & tooltips
🗄️ SQL: Continued solving SQL problems to strengthen query skills.
#DataAnalytics#PowerBI#SQL#Excel
Building My Career in Data | Day 11
📊 Excel: Histogram, Box Plot & Sparklines
📈 Power BI: Basic visualizations & custom themes
🗄️ SQL: Practiced queries on SQL Practice & HackerRank
🧠 FE: Learned SMOTE for handling imbalanced datasets.
#DataAnalytics#PowerBI#SQL#Excel
Building My Career in Data | Day 10
📊 Excel: Charts & visualizations
🗄️ SQL: Pivoting with statistical aggregations, segmentation & local Contoso setup
📈 Power BI: Calendar tables and why they matter in time-based analysis.
#DataAnalytics#PowerBI#SQL#Excel
Building My Career in Data | Day 9
📊 Excel: Text & Date-Time functions
🗄️ SQL: Pivoting data using CASE with aggregations
🧠 Feature Engineering: Handling missing values using mean, median, mode & random sampling.
#DataAnalytics#SQL#Excel#MachineLearning
Building My Career in Data | Day 8
📈 Power BI: DAX basics (Measures, Calculated Columns, SUM, COUNT, IF & Quick Measures)
📊 Excel: Lookup functions
🗄️ SQL: Set up Google Colab, explored Jupyter Notebooks & the Contoso database.
#DataAnalytics#PowerBI#SQL#Excel
Building My Career in Data | Day 6 & 7
Built and published my first SQL data analytics project!
Analyzed a data science job postings dataset, documented the project with a README, and uploaded it to GitHub.
https://t.co/BAlGoxEHjG
#SQL#DataAnalytics#BuildInPublic
Building My Career in Data | Day 5
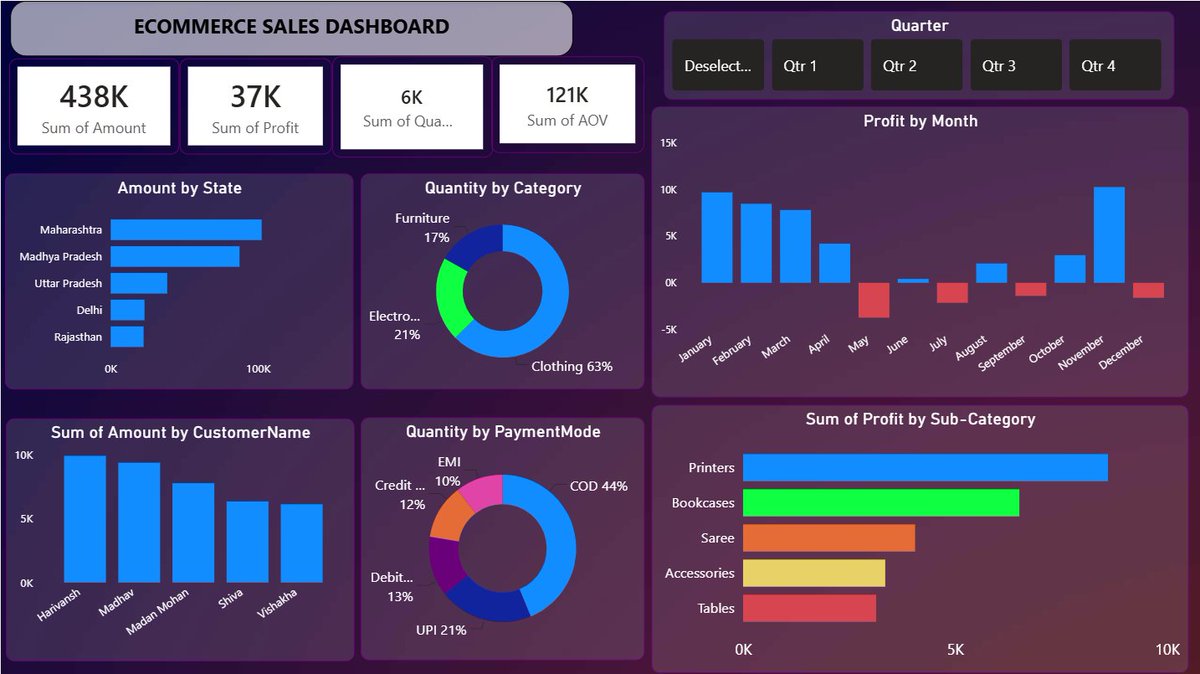
Built my first Power BI dashboard today!
Also learned SQL (CTEs, Subqueries & UNION) and Excel arrays & SUMPRODUCT.
One dashboard down. Many more to build.
#PowerBI#DataAnalytics#SQL#Excel
Building My Career in Data | Day 4
📊 Excel: Math & statistical functions
🗄️ SQL: Date functions, CASE expressions & database loading
📈 Power BI: Star schema, fact vs dimension tables, relationships & basic DAX.
#PowerBI#DataAnalytics#SQL#Excel
Today's focus was turning raw data into usable data.
Excel: IF, IFS, AND, OR, COUNT, AVERAGE
SQL & Power BI - Learning how clean data leads to better decisions.
Building My Career in Data | Day 3
📊 Excel: Formulas, functions & logical functions
🗄️ SQL: data types & table creation.
📈 Power BI: Data import, cleaning, transformations, Pivot/Unpivot, custom & conditional columns.
#DataAnalytics#PowerBI#SQL#Excel