Why I am NEUTRAL on $TSLA ahead of SpaceX IPO
🐂 On one hand, SpaceX put Elon’s empire on the highlight reel again, which could attract investors to buy TSLA.
🐻 On the other hand, I am worried that those who buy SpaceX shares may dump their TSLA shares in advance to fund the purchase.
🤔 The price technicals are pretty neutral here.
✅ It sits above the 200-day MA and within the upward price channel, BUT
💤 The last three sets of rallies did not appear convincing in strength.
Do you see a clear path either way?
🎖️ What does an X Subscription include?
📈 Monday to Thursday
Subscribers may submit one chart request per day.
Each request receives my direct analysis via the subscriber-only channel and will not be shared publicly on the same day.
📽️ Friday
Exclusive Market Update Video covering:
• Macro
• Equity indices
• Crypto
• Commodities
• Megacap stocks
💰 Pricing
This is a highly personalised service with limited capacity.
Seats are currently capped at 20 subscribers unless my capacity expands
$PLTR could be set for a RALLY.
After a Head & Shoulders breakdown in Aug-Jan, PLTR could be flipping the playbook and forming an inverse Head & Shoulders here.
The key resistance line around the 200-day MA is a key level to watch.
Above it, and we are confirming the path to a new ATH.
(1/5)
Problem at Robinhood $HOOD
A dramatic slowdown due to the crypto winter, as crypto transaction revenue fell by half.
While prediction markets are making waves, it can be just as cyclical and dependent on world events.
The latest drawdown was in clear 5-waves, i.e. the bearish trend is dominant.
We could still see a short-term bounce (a corrective B-wave rebound).
But unless we get a massive crypto market rally this summer, HOOD risks falling further after hitting the 200-day MA.
Cybersecurity is becoming a must-own sector.
In the age of agentic AI, the attack surface is expanding rapidly.
More endpoints. More automation. More sophisticated threats.
Security is no longer optional. It’s core infrastructure.
Against that backdrop, $ZS stands out.
25% growth, trading at a discount to peers like $PANW and $FTNT.
The multiple has compressed.
The demand profile hasn’t.
In a structurally growing sector, it starts to look attractive.
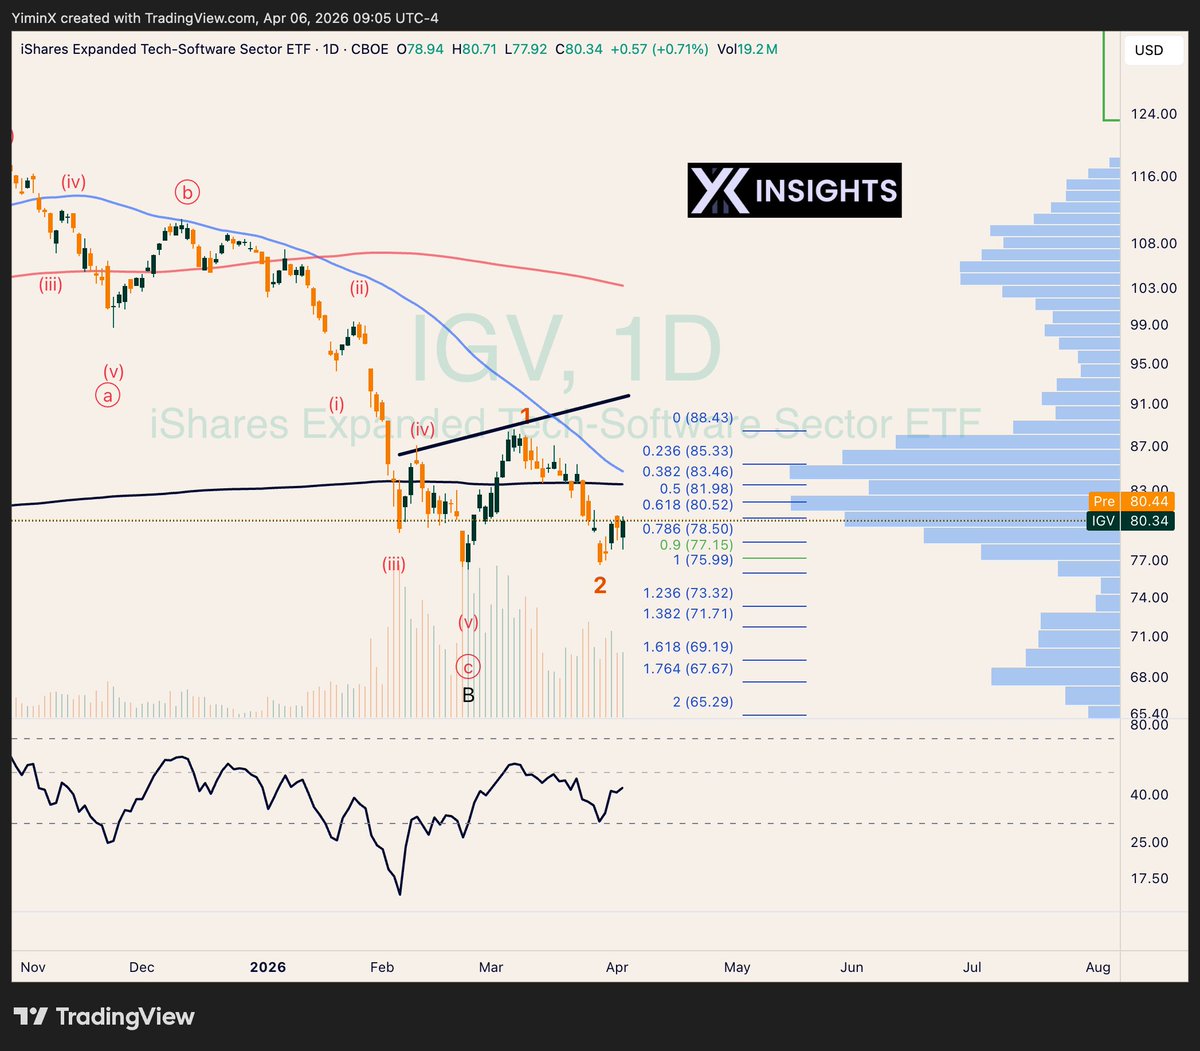
Is software quietly forming a base?
$IGV has held above its February low despite the broader selloff, with heavy volume clustering near recent lows suggesting potential accumulation.
Flows tell a similar story. While equities saw consistent outflows over the past week and month, IGV stands out with net inflows over the past 1 month.
Early signs of relative strength beneath the surface.
$ETH follows a power law trend. Just like Bitcoin.
If the model holds:
⚖️ Fair value today: $3,300
💰 +1 standard deviation: $8,000
🚀 +2 standard deviations: $20,000
This is the same framework that's tracked $BTC within its corridor for 14 years.
Where do you think $ETH lands by the end of 2027?
If $ETH follows the power law too, the fair value today is $3300.
+1 standard deviation puts the Ethereum price at $8k.
+2 standard deviations at $20k.
$SPY the S&P 500 ripped 2% to $661 today on the Iran news.
Here's what happened under the hood:
Before the rally, dealers were short gamma (net -$204bn), meaning they had to buy into strength to hedge. That amplified the move higher, a classic fuel for explosive rallies.
The rally pushed SPY through $652.50, the "zero gamma" level. Above that, dealer hedging actually slows price action rather than accelerating it. So the explosive phase is likely done.
SPY is now sitting between max pain at $656 and a massive call wall at $670. That $670 level has huge open interest and acts like a magnet. It means price often gravitates toward these strikes into expiration.
Meanwhile, implied volatility collapsed. It was trading at 29.6% while realised vol over the last 20 days was only 12.9%. Classic event premium getting crushed once the event resolves.
TLDR: negative gamma + event-driven fear created the perfect setup for a face-ripping rally. Now we're in positive gamma territory with $670 as the next target.
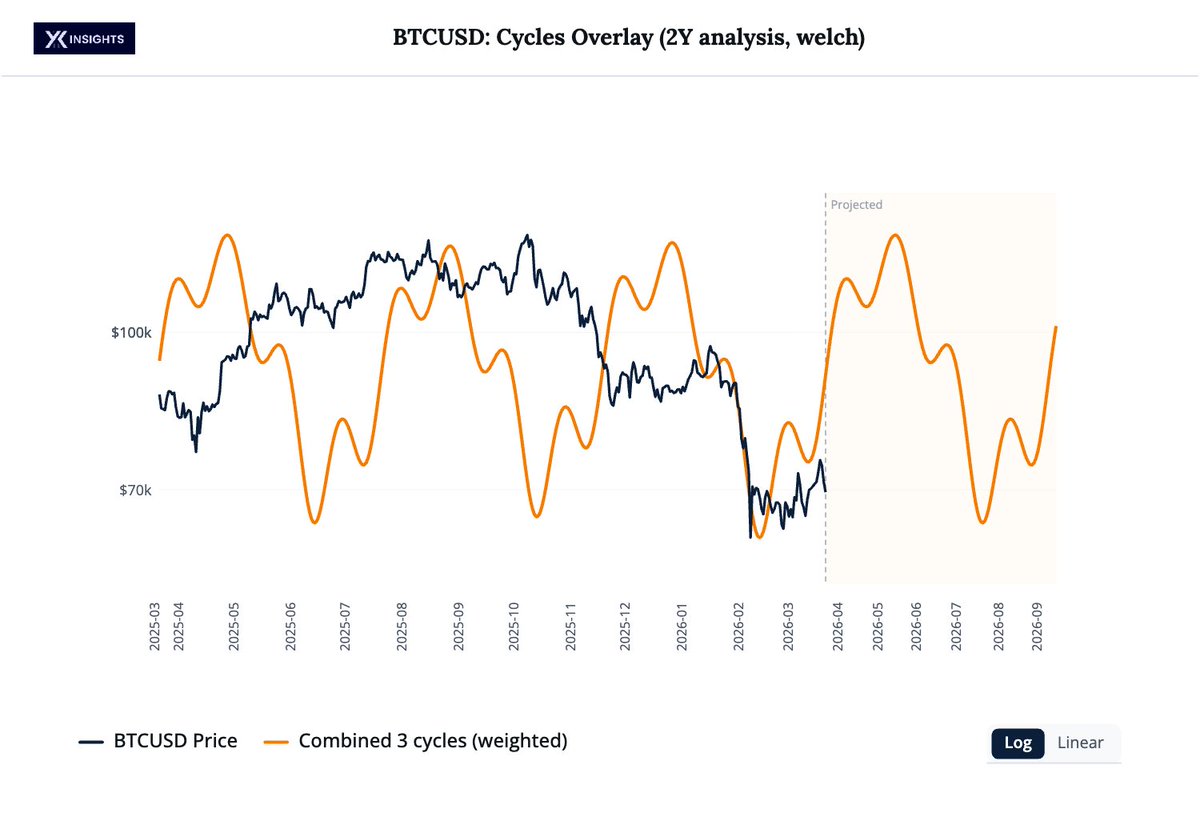
$BTC Bitcoin is starting to line up with its 2-year cycle again.
The recent low came right where the composite cycle bottomed.
Since then, the price has begun to turn higher alongside the model.
If this holds, the next phase points to a steady grind up into mid-year.
The path won’t be straight, but the direction is clear.
Cycles don’t predict headlines. They frame the move before it becomes obvious
$MSTR is quietly doing something important here.
During the selloff, it declined broadly in line with $BTC, not worse.
That tells you downside convexity has largely been worked off.
When Bitcoin stabilises and rebounds, this sets up a regime where MSTR can lead on the way back up.
BTC looks “hesitant”, but the cycle is not over.
The price action has actually been constructive after the November flush.
I believe one more high this year is still the roadmap.
Early recovery phases reward patience. Hesitation here is accumulation, not distribution.
$BTC Bitcoin's historical peaks had coincided with the Copper/ Gold peaks.
We haven't had a new peak in Copper/ Gold since Nov 2021.
Bitcoin hasn't peaked this cycle yet.
My Machine-Learning Signals on X cover:
$SPY, $QQQ, $TLT, $BTC $ETH, $GLD, $ETH
Since their individual model launches, we have enjoyed:
🟢 Returns: +30.9% (equal allocation, time weighted)
🟢 Sharpe: 2.3
🟢 Max Drawdown: -5.2%
Buy & Hold in the same periods:
🔴 Returns: +25%
🔴 Sharpe: 1.5
😱 Max Drawdown: -15%
You can subscribe via my profile today 👇
I will be covering a lot of market-related content here on:
$TSLA
$BTC / $MSTR
$ETH / $BMNR
$ASTS / $RKLB
$IREN
$NBIS
$ONDS
$XRP
$COIN / HOOD
🔔 Follow to get them on your timeline.
$BMNR is executing a very deliberate strategy.
Accumulating close to 5% of the $ETH supply while selectively investing in high-conviction moonshots is not spray-and-pray.
It’s a balance sheet construction.
BULL CASE: This setup allows BMNR to ride the ETH cycle while asymmetrically expanding mNAV during the next bull run.