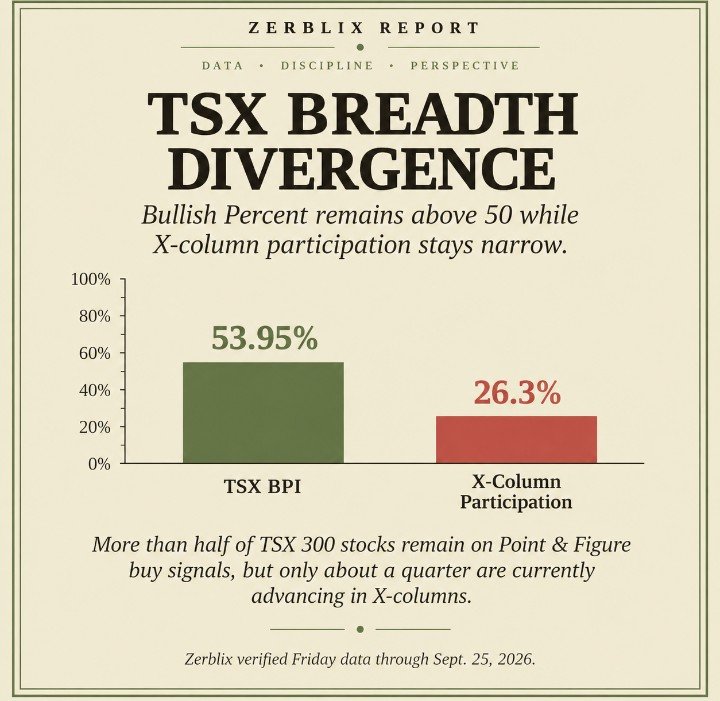
At the Sept. 25 Friday close, the TSX 300 Bullish Percent Index stood at 53.95%, while X-column participation was just 26.3%.
More than half the #index remains on P&F buy signals, but only about a quarter is currently advancing in X-columns.
That gap points to narrow current participation beneath a still-positive buy-signal backdrop.
$EWC #TSX
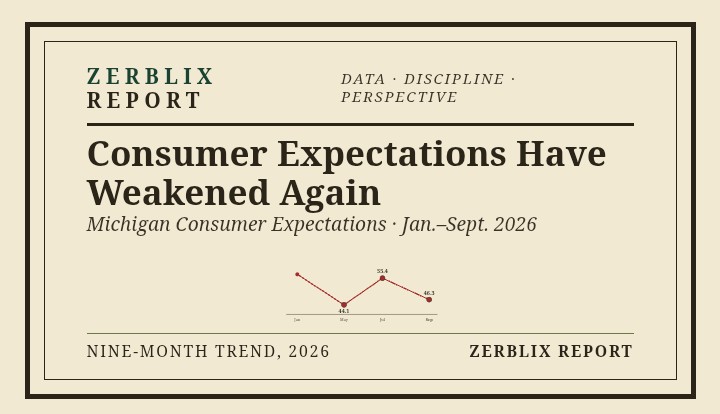
Consumer expectations have weakened again.
Michigan Consumer Expectations fell to 44.1 in May, recovered to 55.4 in July, and slipped back to 46.3 in September.
Much of the summer rebound has now been retraced. The recovery in household expectations has not held.
Source: University of Michigan Surveys of Consumers.
#ConsumerSentiment #Markets #Macro
Transport breadth is washed out — now the reversal matters.
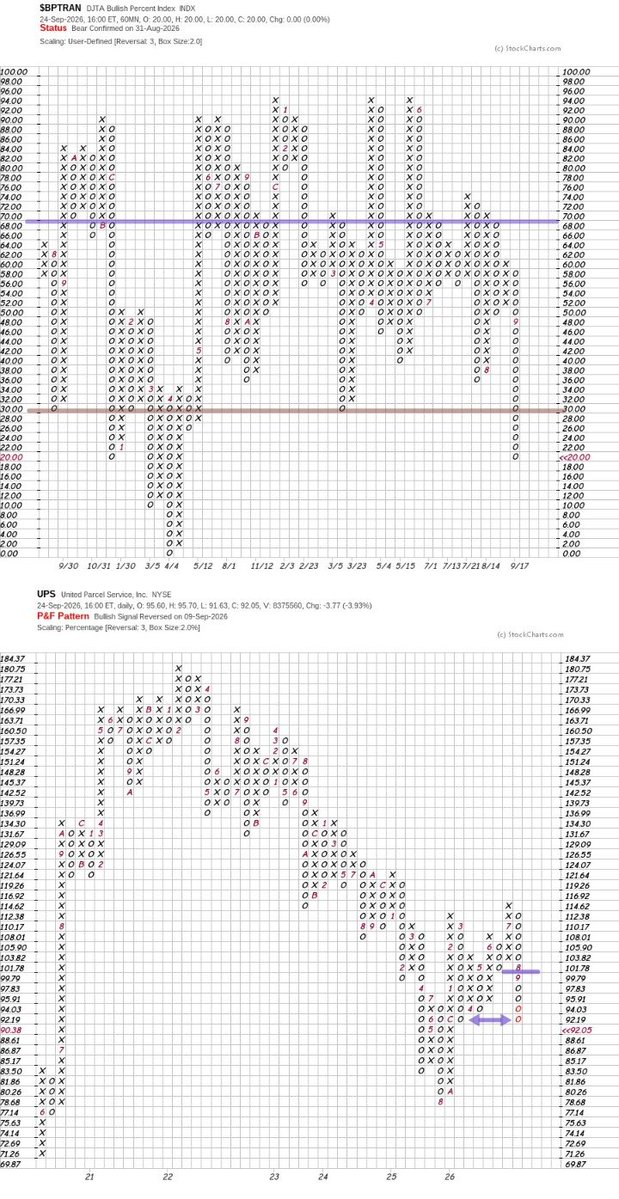
$BPTRAN is Bear Confirmed at 20%, with the Bullish Percent Index in O’s below the 30% lower breadth zone. At this level, the condition is deeply compressed; the next meaningful evidence is whether breadth can reverse back into X’s.
$UPS is showing the same supply-side pressure. Its Bullish Signal Reversed pattern has carried the current O-column back to the prior O-column low near 92.19. That support is being tested, not yet decisively broken.
A lower O would add bearish confirmation. A reversal into X’s would show demand returning.
$BPTRAN is washed out. UPS is testing P&F support. The next useful information should come from the reversal — or the failure to produce one.
Gold Miners breadth is testing an important area.
The Gold Miners Bullish Percent Index ($BPGDM) is at 54.05. Breadth was near 66% earlier in September before falling sharply to 52.05 at the Sept. 18 Official Friday benchmark.
The recovery since then has been modest and has not reversed the current P&F column of O’s, so the indicator remains in a Bull Correction.
GDX, meanwhile, continues to hold near the upper portion of its multi-year range.
That leaves an important internal contrast:
Price remains firm while participation has weakened.
The 70% and 30% levels help frame the condition. Above 70, bullish participation is broad. Below 30, participation has become heavily compressed. At 54, Gold Miners breadth is between those extremes — weakened, but not washed out.
Similar mid-range reversals appeared in late 2025 and early 2026, making the current 50–55% area worth watching, but not something to treat as established support.
With this chart set to a user-defined 2-point box size and 3-box reversal, $BPGDM would need a 6-point advance from the current area to reverse back into X’s, placing the first reversal near 60.
That would be the first evidence that demand is broadening again.
If breadth instead breaks below 50 while GDX remains firm, the divergence would become more significant.
$GDX is holding. #Breadth is correcting. The next P&F reversal should tell us whether participation is rebuilding or whether supply is continuing to spread beneath the surface.
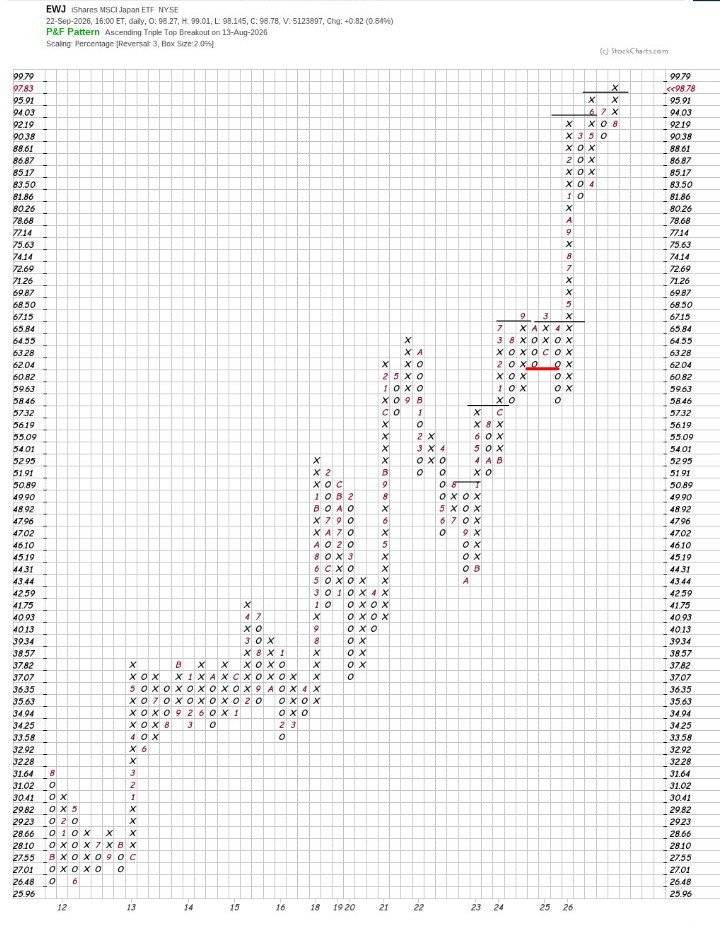
Japan’s $EWJ presses near record levels.
• 2% close-only / 3-box P&F.
• Since 2023: six bullish breaks, one bearish break.
• Aug. 13: ascending triple top—three X-columns with successively higher highs.
Demand regained control after the setback. Follow-through matters.
#jaoan #ETF #pointfigure
Nasdaq 100 ($NDX): testing summer highs.
• 2% box / 3-box reversal P&F.
• Chart markers: 6 = June; 9 = September.
• Latest X-column has returned to prior highs.
• A new X above those highs would confirm the breakout.
Resistance remains the immediate test.
Broader context. Nasdaq 100 registered the largest improvement among the five core universes. Canada’s TSX 300 also strengthened, moving from −17.2 to −9.9.
Pressure remained substantially more negative in the S&P 500, S&P 400 and S&P 600. Mid-cap pressure weakened slightly.
Nasdaq100 #QQQ #SPX #TSX
$HUT is developing a triple top with higher bottoms.
The repeated tests of resistance show that supply is still present near the prior ceiling, but the higher intervening lows indicate that sellers have been less successful in forcing price back to earlier support levels.
A print at 99.79 would complete the triple-top breakout and provide the next bullish signal. Follow-through toward 110–112 would strengthen the repair.
A decline below 78.68 would weaken the higher-bottom structure and reduce the bullish implication.
15 years of Q4 relative seasonality.
$XLI outperformed $SPY in 11 of 15 Novembers. $VGK did the same in 11 of 15 Decembers.
But historical tendency and current leadership aren't necessarily aligned.
Current RS through Sept. 18 provides the second part of the picture.
Seasonality defines the tendency. Relative strength looks for confirmation.
#Seasonality #RelativeStrength #ETFs
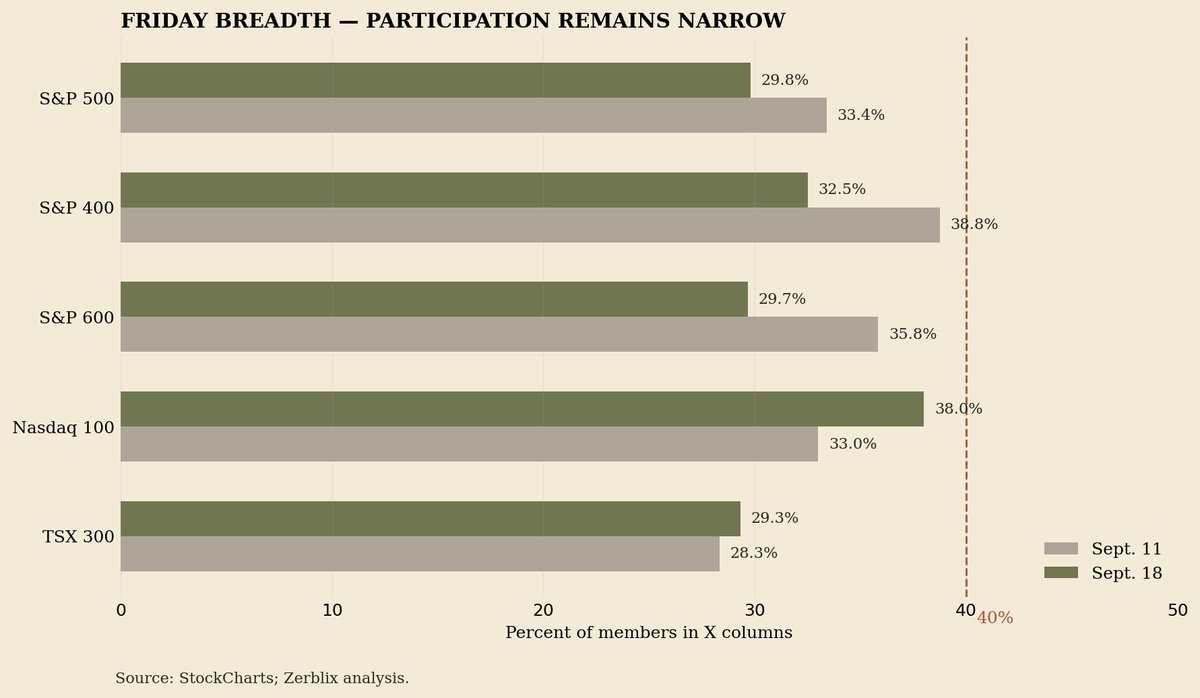
Friday breadth remains narrow.
P&F X-column participation:
S&P 500 29.8%
S&P 400 32.5%
S&P 600 29.7%
Nasdaq 100 38.0%
TSX 300 29.3%
Across all five universes, X-column participation remains below 40%. Demand is present, but participation is not broad. A broader advance should pull more stocks into X columns.
#pointandfigure #breadth
Source: StockCharts; Zerblix analysis.
Midday P&F:
$RSP has completed a 3-box reversal into O’s, while $SPY remains in its X-column.
Supply is appearing first in the equal-weight S&P 500, suggesting broader participation is under more pressure than the cap-weighted index alone shows.
Early warning only. Daily-close confirmation still matters.
Midday breadth check: price is rebounding, but participation is still uneven.
S&P 500: +0.9%
Equal-weight S&P 500: +0.4%
Demand has improved, but the cap-weighted index is still leading the repair.
#SP500#MarketBreadth#PointAndFigure
P&F structure — Sept. 15
A 63-name Triple Bottom Breakdown scan shows deeper downside structure concentrated in
#Industrials, Consumer Discretionary and Financials.
Industrials + Consumer Discretionary account for nearly half the scan.
Energy was a clear exception, with very little representation.
New supply slowed Tuesday, but established bearish structure remains concentrated in economically sensitive groups. Repair is selective, not broad.
#pointandfigure
Source: StockCharts; Zerblix analysis.
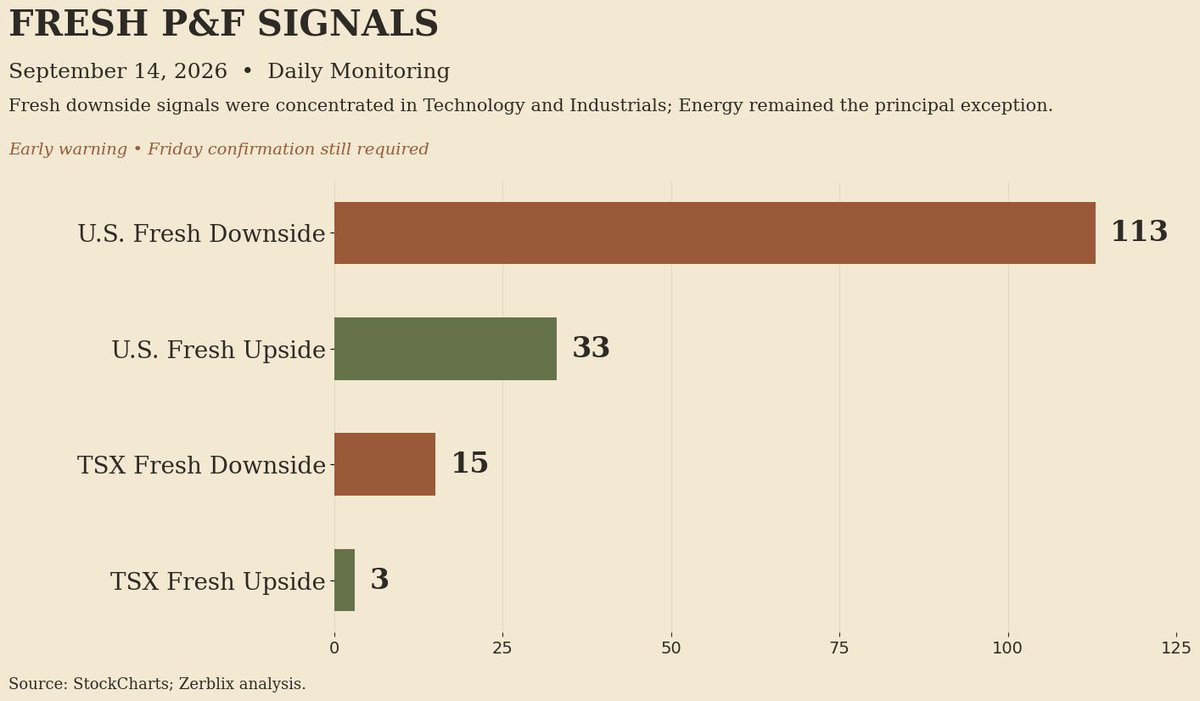
Zerblix Daily Monitoring — Sept. 14
Fresh P&F downside signals numbered 113 versus 33 upside signals across the U.S. universes.
A downside signal develops when price penetrates a previous support level, indicating that supply has overcome demand at that level.
Most of the new weakness appeared in #Technology and #Industrials, with semiconductors prominent. #Energy remained comparatively strong.
For now, the evidence points to market separation rather than uniform weakness.