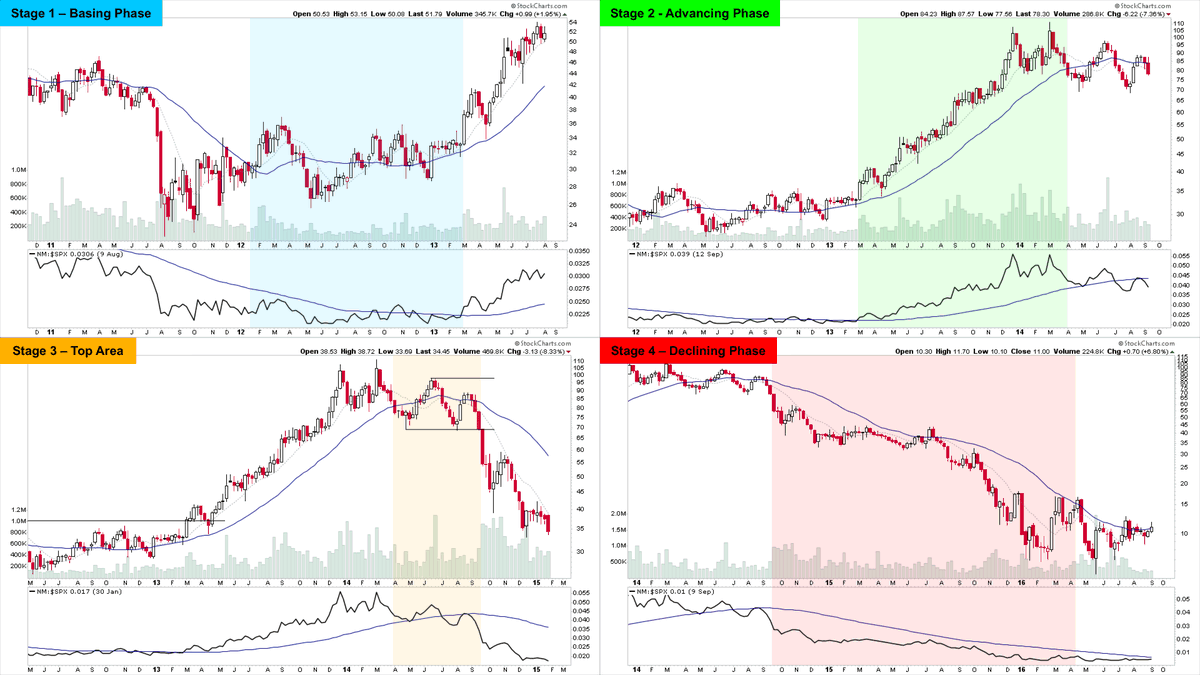
Stage Analysis – The Four Stages
******************************
Thread:
Examples of each of the Four Stages to help you learn Stan Weinstein's Stage Analysis method.
Also will help you understand what I'm referring to in my posts
#stanweinstein#stageanalysis#stocks#study
@BoyWumbo I do the majority of buying for position trades in late Stage 1 / early Stage 2. So initial buys are usually always in a developing base before the breakout.
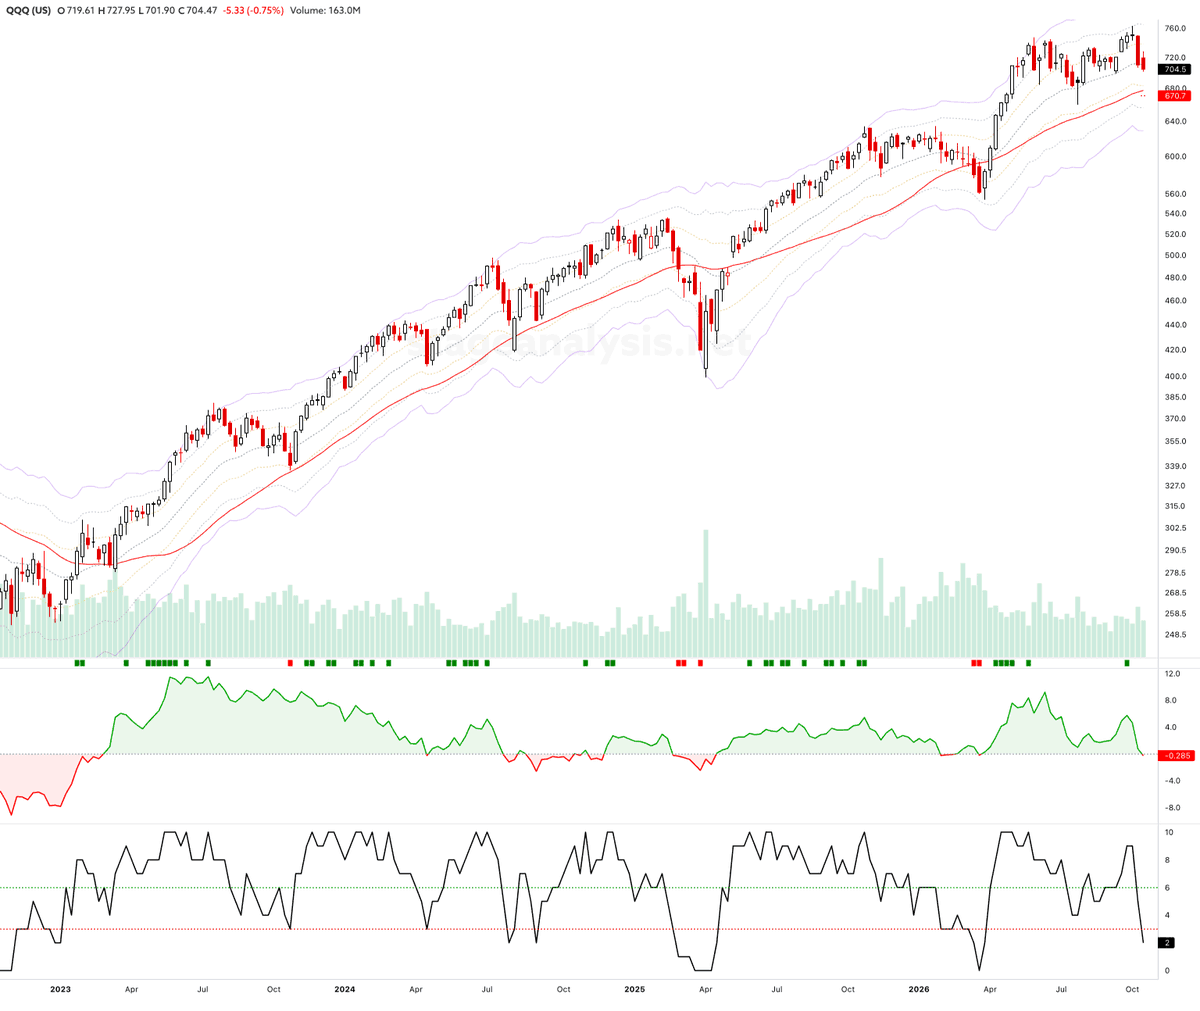
Have sold out $NVDA as well into todays small bounce to raise a bit of cash. As lots of the Semi's that were leaders are now late Stage 3 / early Stage 4. So NVDA was an outlier in the group. Still have a position in NVDA though, as it makes up around 12% of the QQQ.
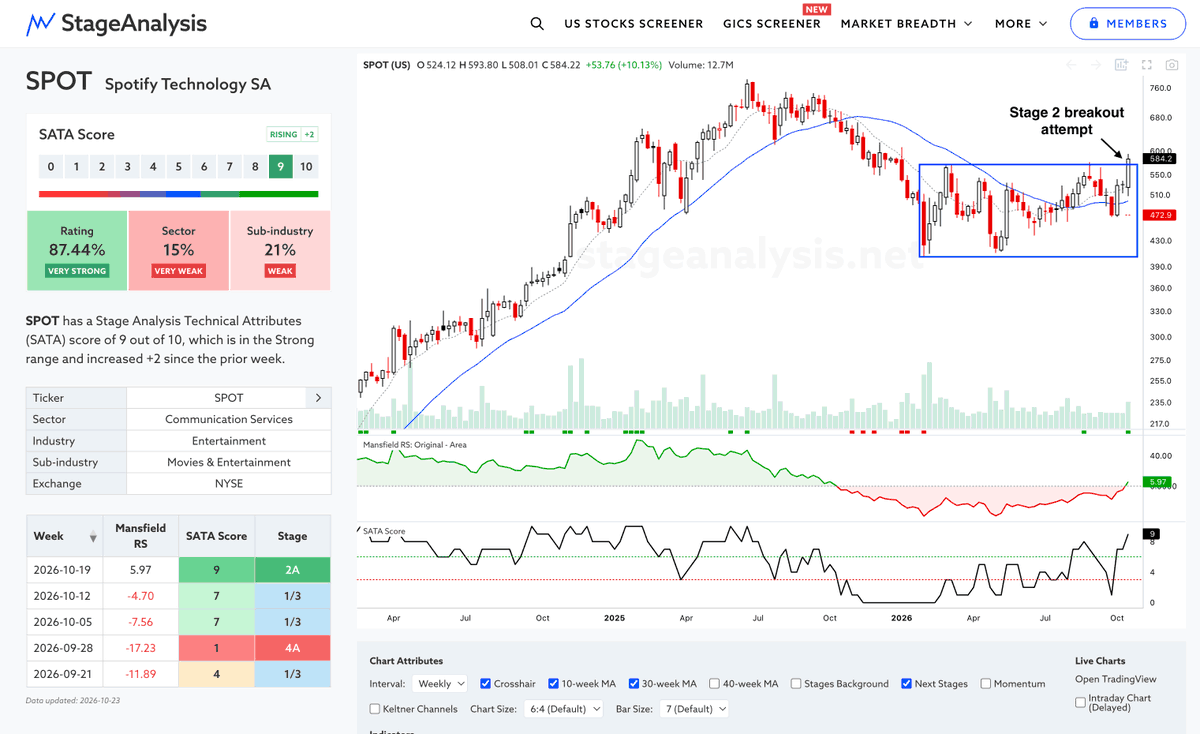
Weekend Video Part 1: Watchlist $SPOT, $CRWD, $AZN (10mins)
▪️Login for full length video (60mins) discussing all the data for the Stage Analysis method (made famous in Stan Weinstein's classic book)
https://t.co/qv6wZEpm29
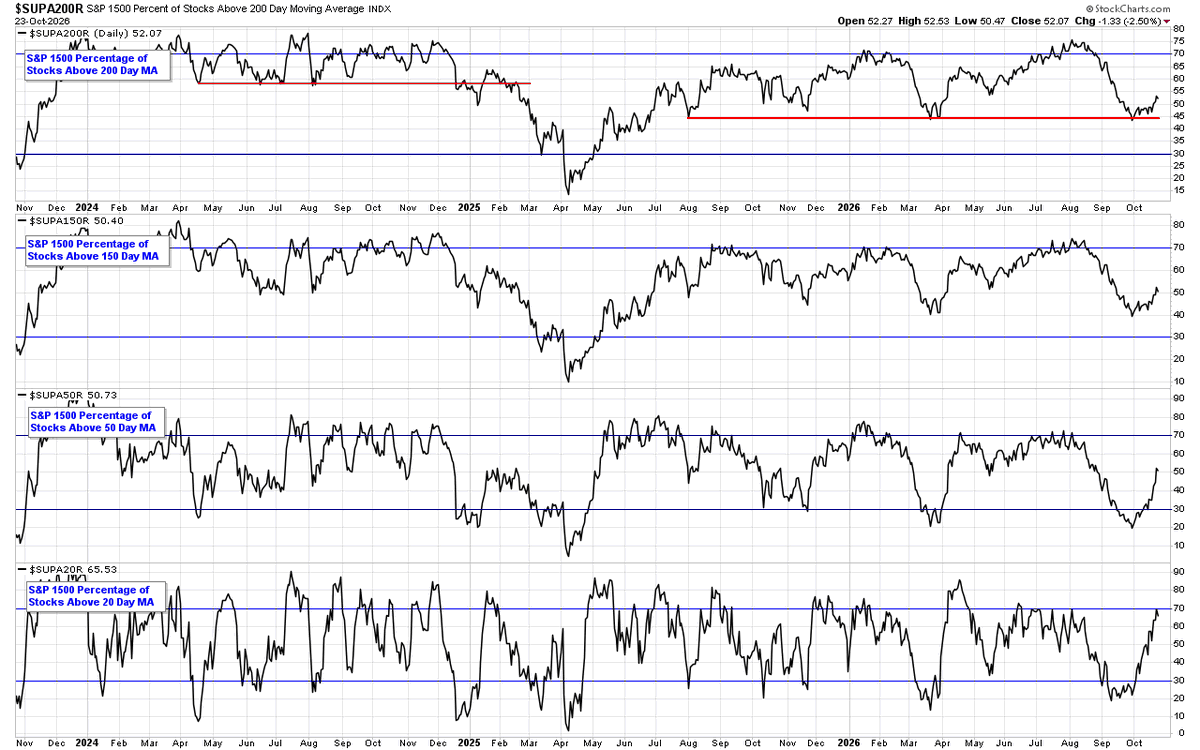
Market Breadth: S&P Composite 1500 Moving Average Breadth
▪️52.07% > 200 day MA (Long-term)
▪️50.40% > 150 day MA (Medium-term)
▪️50.73% > 50 day MA (Short-term)
▪️65.53% > 20 day MA (Very Short-term)
Combined Average: 54.68% (Neutral)
New Blog Post: US Stocks Watchlist
There are 19 stocks highlighted from the weekends US stocks watchlist scans – $SPOT, $CRWD, $AZN
https://t.co/Y9UIR7pf9r
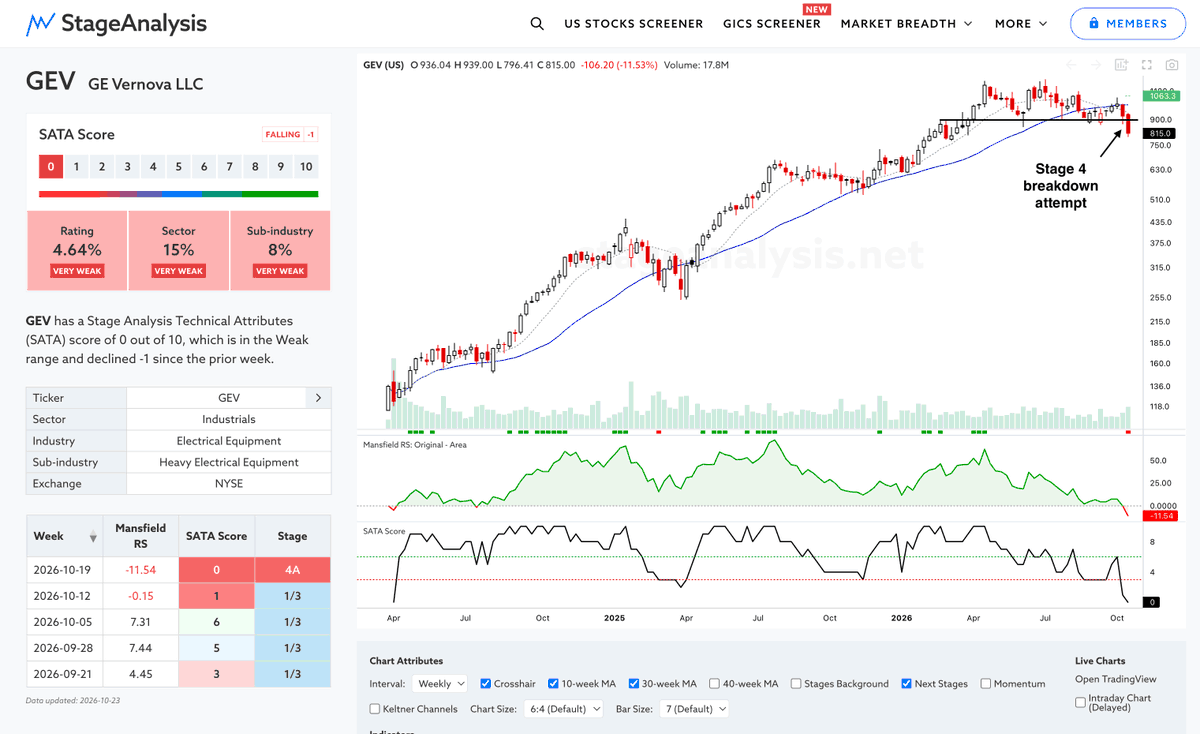
@K_Stockalper Sure, its still an "attempt" to breakdown as I said in the post. Not suggesting anyone does anything here as its already -10.63% below the Stage 4A point. Just highlighting a major stock attempting to breakdown
Momentum Changed to Positive vs Negative split for the week:
211 stocks turned weekly momentum positive and 94 turned it negative, more than 2 to 1, in a week when every major index closed below its 10-week MA. The gainers are mostly in uptrends and bases, led by regional banks, software and health care. The losers are mostly confirming existing downtrends in metals, aerospace, autos and travel.
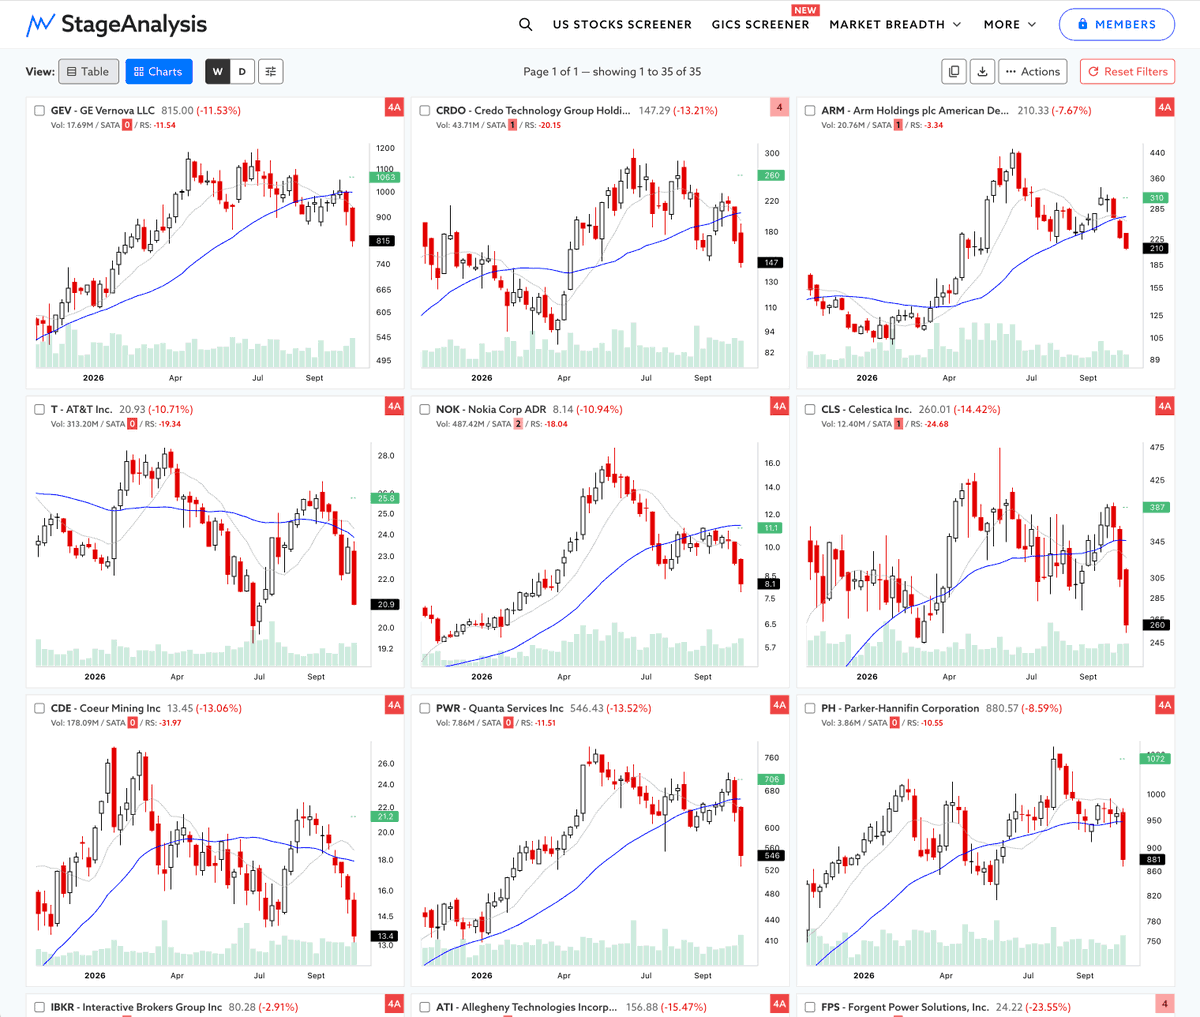
Stage 2 Breakouts vs Stage 4 Breakdowns split this week:
41 names broke out into Stage 2 and 43 broke down into Stage 4, and both sides cleared average volume at the same rate. What differs is what moved: Software and IT services on the positive side, and Machinery, Metals and the AI power build-out on the negative side.
Scan for stocks that meet the Stage Analysis criteria on https://t.co/G9jNKP2mli – a dedicated platform for the Stage Analysis method with unique tools and features that will save you time in your daily/weekly research.
New Blog Post: Market Breadth: Percentage of Stocks Above their 50 Day, 150 Day & 200 Day Moving Averages Combined
▪️36.19% (+3.30% 1wk)
Status: Neutral Environment
https://t.co/eRF1OksDKk