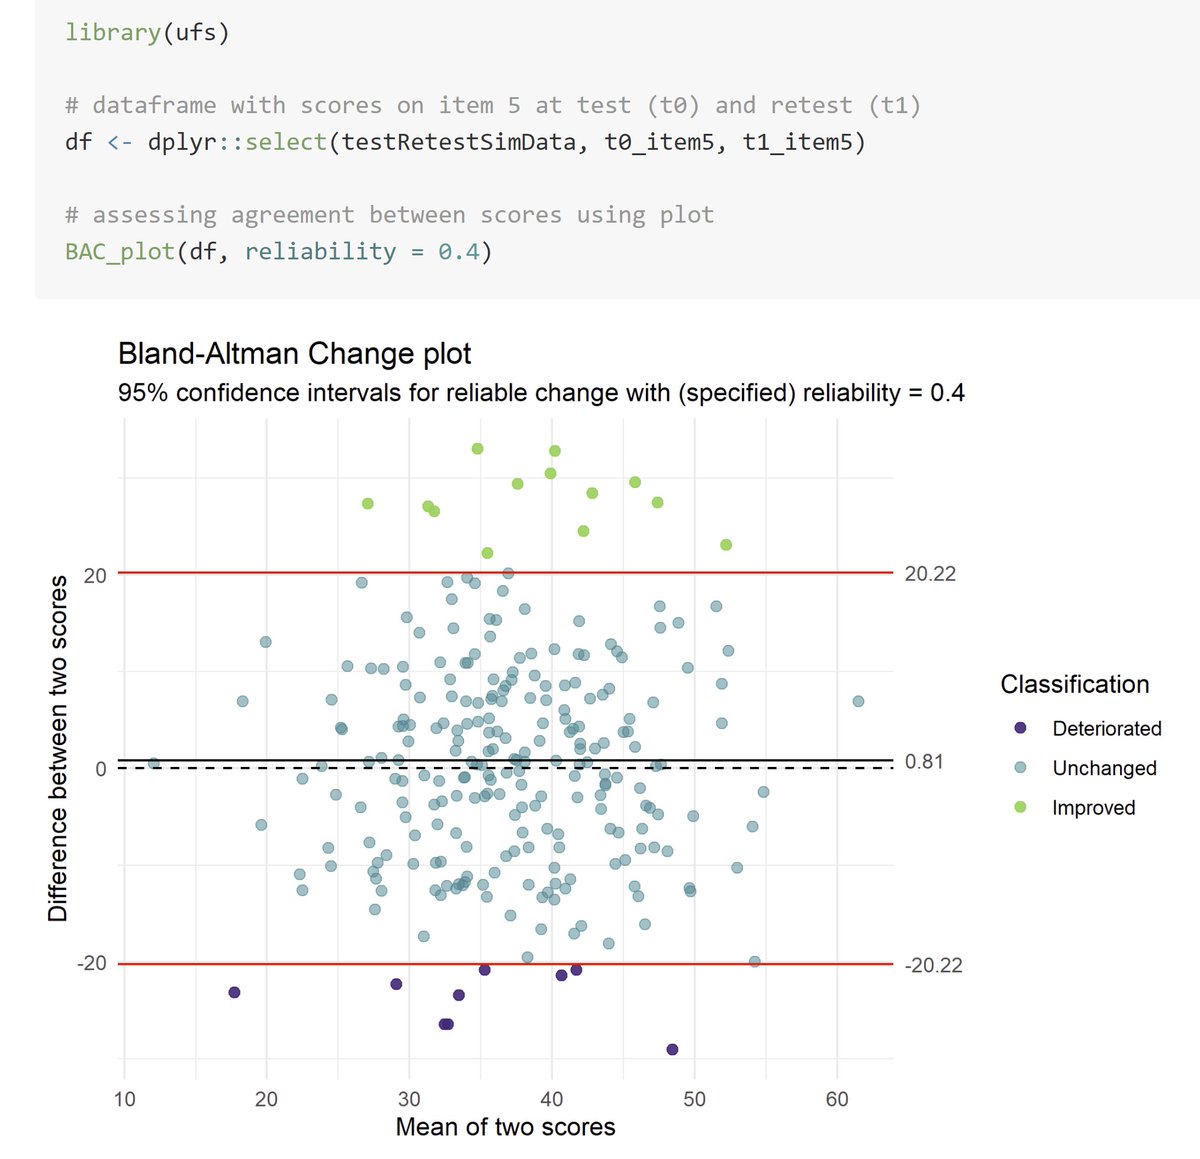
A Bland-Altman plot helps visually assess agreement between scores of any kind (psychological questionnaires, chemical assays, etc.).
The {BAC_plot} function from {ufs} 📦 easily creates them with elegant defaults! 🍎🍏
https://t.co/zl7vSzwe26
#rstats#DataScience
Sometimes you not only wish to create a visualization with {ggplot2} 📦, but also to add additional filters to it.
The {with_*} function family from {ggfx} 📦 provides a rich collection of such filters! 💅
https://t.co/ekCrUTvFHV
#rstats#DataScience
Looking for a new look for your R charts? The "feather" package provides color palettes based on the plumage of Australian birds https://t.co/CmvboHleJk #rstats
Tidy Modeling with R, a book on using the tidymodels package for statistical analysis by @topepos and @juliasilge, available online at https://t.co/qH7bA8tpR8 #rstats