Enjoyed attending the Black River Watershed Conference this week & learning more about the work being done across the Tug Hill region. Thanks to the organizers for the opportunity to deliver the keynote on communicating climate change & the impacts already being felt across NY.
According to #ClimateCentral's @ZLabe, "Climate change is shifting the timing of spring across the United States."
Missed out on our latest Monthly Climate Briefing?
🎥Watch on YouTube: https://t.co/2pExsls4sd📚Read the recap: https://t.co/VsjYmgyLEW
Continuing to expand my list of climate data indicators for the United States. What additional suggestions do you have?
Check it out at https://t.co/6tLExjBil8. As always, the graphics are free to use and share (click on each one to download in high-resolution).
A lot of the United States is dealing with drought at the same time extreme rainstorms are becoming more common.
The two trends are connected:
Warmer temperatures are causing heavier downpours, while also drying out the land faster between storms.
https://t.co/r1LttzXoxT
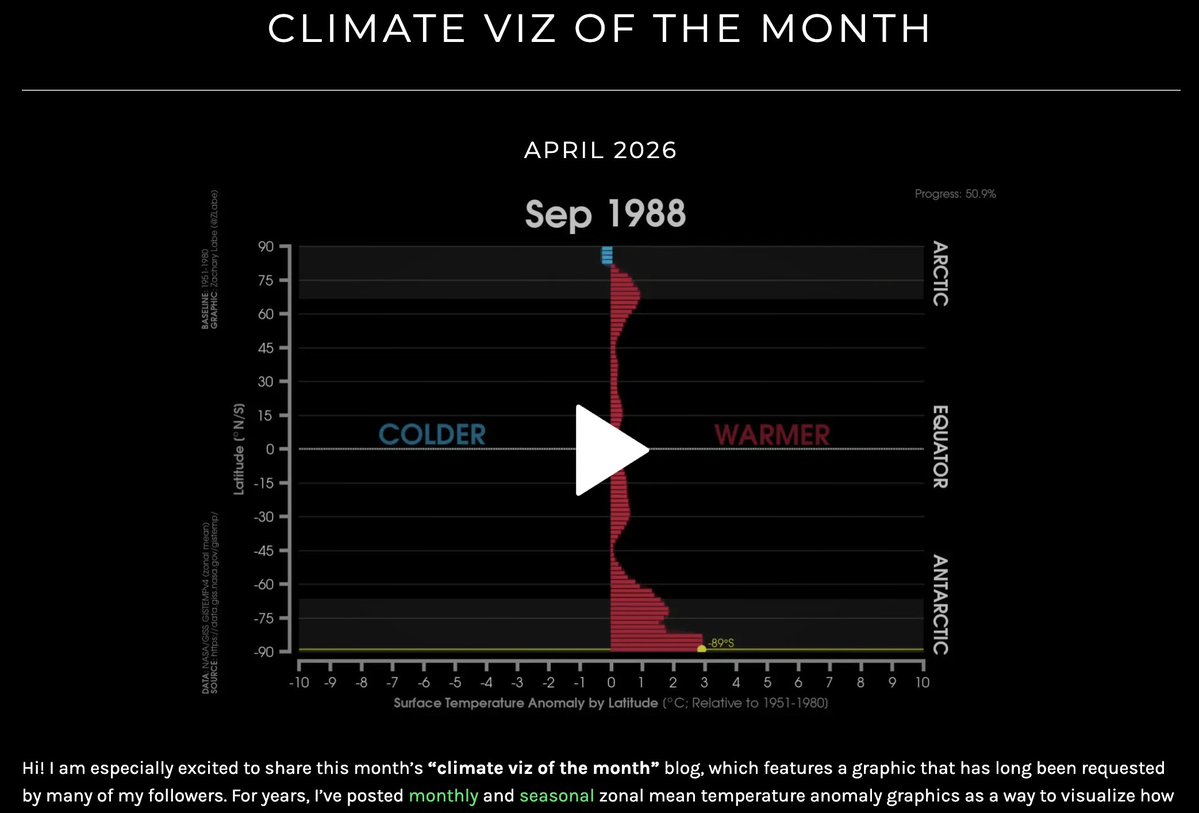
I swear I really do listen to all of your comments (good & bad), and this new blog features a data viz many of you requested. In my latest entry, I share an animation of temperature departures by latitude for every month from 1950 to 2025.
Check it out! https://t.co/4QzBhL1jQc
The video player here includes options to slow down or speed up the animation, pause, enlarge the display, and download it. Hopefully this makes it easier to explore compared to my traditional GIF-style animation.
We have a new book chapter out: https://t.co/1EXOys241L. Here, we overview how extreme event attribution assessments & improved decadal prediction can support resilience planning & decision-making around climate risks.
If you are interested in it, don't hesitate to reach out 🙂
Slowly but surely, I am adding more metrics for monitoring the Relative Oceanic Niño Index (RONI) on my climate indicators page (monthly): https://t.co/53ZaRhYqC0. It could be quite a year for El Niño 😬
"As spring arrives 10 days earlier on average than four decades ago, growers pay the price with total crop losses." via @farmdaily at https://t.co/cZLIrfxOGc
In case you missed our latest climate science briefing, check out the recording from today: https://t.co/SjOqulyedv
After overviewing the latest global statistics, we did a deep dive on the newest data around drought conditions and the growing likelihood of a strong El Niño.
I just added a new graphical timeline of our rapidly changing planet (through 2025)...
This high-resolution visualization is now permanently featured at the very bottom of my climate change indicators webpage.
➡️ Check it out here: https://t.co/53ZaRhYqC0