🚨INSANE🚨
1. $IREN JUST HAD A CUSTOMER AGREE TO FUND 90% OF THE GPU CAPEX
2. SIGNED A SHORT-TERM DEAL AT $40M PER MW
I believe it’s Anthropic (No other option)
🤯🤯🤯
I’ve been long $IREN since $5.30, and the call back then was pretty simple: if AI kept scaling, grid-connected power would go up in value. That played out, and I went quiet while it ran.
I’m back because the stock now looks more disconnected from the business than at any point since I bought it.
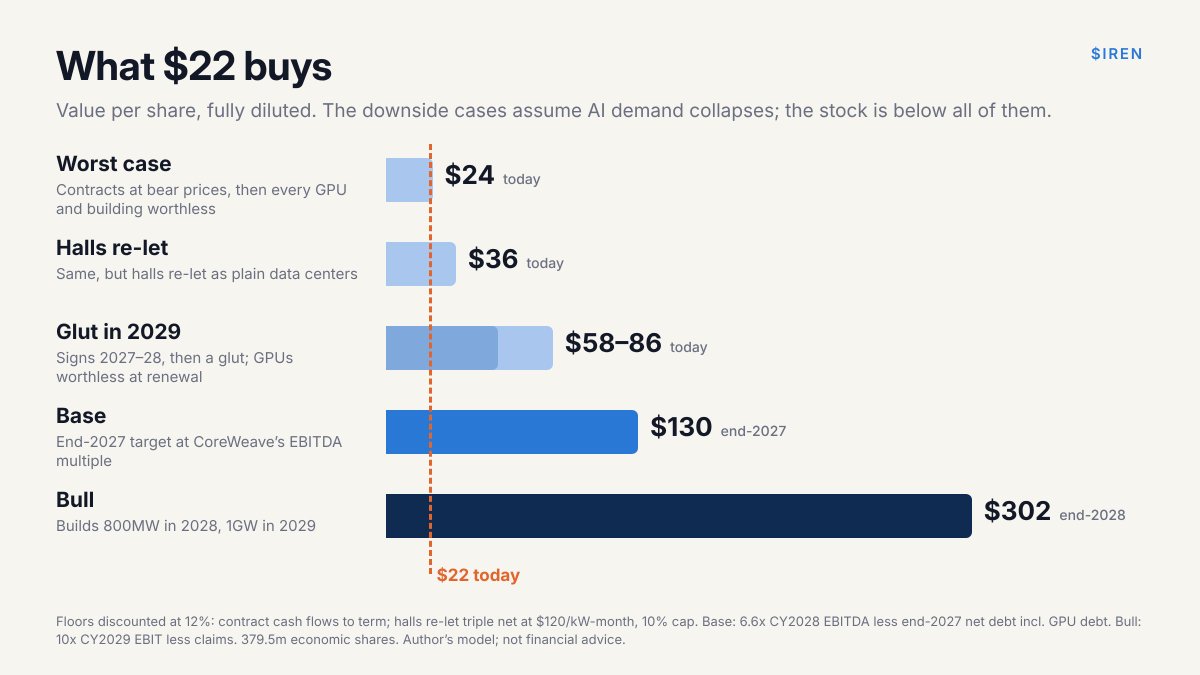
At $22 we're at an ~$8.4bn market cap and ~$19bn of EV once you include YE 2026 GPU debt: about 6.3x exit-2026 run-rate EBITDA, and ~2.3x 2028 EBITDA, including the debt needed to fund the buildout.
If the 2027 capacity signs even at bear-case prices, about 20% below today’s, it trades roughly at what its contracts are worth, even if every GPU and every building is worthless the day those contracts end. And it owns roughly 2.3GW of energized capacity at a time when the biggest buyers in the world are saying they can’t get enough.
My floor works out around $24–36 and my base case for end-2027 is around $130 🧵
$IREN: H2 Final Update from IR to Large Share Holder
Today, a group of very large shareholders held a call with IREN’s investor relations to get to the bottom of the H2 rumors.
1. H1 will be billing continuously from August 13th onwards. H1 was delivered according to original contract and specs. Any changes made will not interrupt billing.
2. H2 will be delivered in weeks.
3. H3-H4 will be delivered by late December 2026.
From what I can see, this more or less calms the rumors around H2. H1 revenue will be steady and strong, up ton45 day delay from roughly mid Oct for H2, and H3 minimal delays and H4 by late December. H1-4 all will be handed over to MSFT in 2026.
I was not part of call as these very large holders are mid 8 digits, 9 digits, and mid 9 digits measured in dollar value of IREN shares but I do talk to some of them.
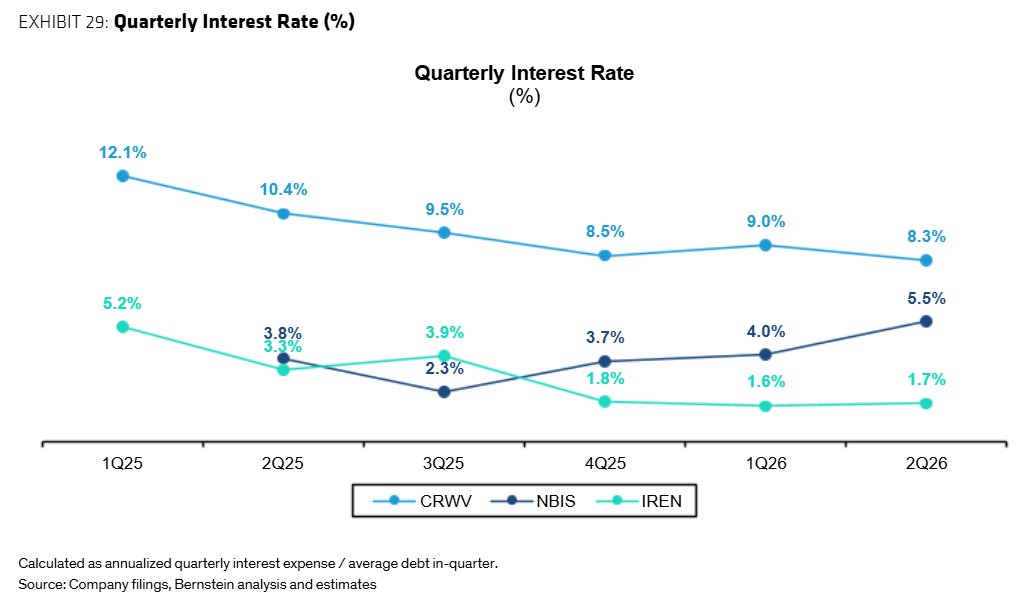
The neocloud trade is starting to become more about who can finance that demand cheapest:
• $CRWV is paying 8.3% on ~$35B of debt which is why interest expense is heading toward ~$900M a quarter even with demand still strong.
• $NBIS has seen its rate rise from 2.3% to 5.5% in three quarters but customers are still prepaying a large portion of CapEx which keeps the funding model way cleaner than CoreWeave’s.
• $IREN sits at the other extreme at just 1.7% partly because more of its funding comes through converts where cost shows up as dilution instead of interest but also lenders are still giving much cheaper capital to energized power and interconnects than to GPU-heavy balance sheets.
Thats why cost of capital is becoming almost as important as demand because all three can grow while financing determines who keeps more of the upside.
Beautiful daily & weekly closes on $IREN. I feel like we’re close to another major run-up in the stock.
$IREN is simply too undervalued for it not to violently re-rate eventually. 📈
🚨 THE FINAL $OPEN BULL THESIS
THE GREAT $OPEN DISLOCATION
When price, ownership and fundamentals stop telling the same story.
I’ve rarely seen this many conflicting forces building inside one stock at the same time.
Forget the daily candles. Look at the math underneath $OPEN.
1/ INSTITUTIONS
Q1 institutional shares: ~455.6M
Q2: ~567.8M
+112.2M shares in ONE quarter.
+24.6% QoQ.
Ownership: 49.1% → 58.8%.
228 institutions increased positions vs 83 that reduced.
Largest additions:
BlackRock +54.3M
State Street +15.8M
Geode +12.6M
Morgan Stanley +12.4M
Sixth Street +10.3M
Top 5 alone: ~105.4M shares — ~94% of net Q2 institutional accumulation.
2/ SHORT INTEREST
Mar 31: 123.4M
Jun 30: 182.6M
Aug 31: 208.1M
+84.7M shares since March.
+68.7%.
Q2 institutional net accumulation alone equals ~54% of the ENTIRE current short position.
The top-5 institutional additions equal ~51%.
BlackRock’s increase alone equals ~26%.
That does NOT mean those shares are locked.
But it shows the scale of the two opposing forces.
3/ THE EXIT DOOR
Days-to-cover:
Mar 31: 3.63
Aug 31: 6.68
+84%.
At ~31.2M average daily volume:
25% short covering ≈52M shares ≈1.7 trading days of average volume.
50% ≈104M shares ≈3.3 days.
The short book got larger while the relative exit door got smaller.
4/ SUPPLY
Opendoor then retired 45.3M shares at $3.49, spending $158M.
That’s ~5% of shares outstanding.
45.3M shares = ~22% of current reported short interest.
Institutional Q2 accumulation + company retirement:
112.2M + 45.3M = 157.5M shares.
That is ~76% of current short interest IN SCALE.
Not “locked float.”
Not a squeeze guarantee.
But an enormous number relative to the short book.
5/ PRICE DISLOCATION
Russell 3000 inclusion day:
171.7M shares traded.
Close: $4.37.
Company buyback:
$3.49/share.
Using $2.56 as the reference price:
$3.49 = +36%
$4.37 = +71%
These are NOT price targets.
They simply show how far the equity has fallen below two recent, observable capital-flow reference points.
6/ THE BUSINESS
And this is not happening while operations are collapsing.
Q2:
Revenue +23% QoQ
Contribution Profit +59%
Contribution Margin +140 bps QoQ
Homes purchased +77% QoQ / +149% YoY
6,908 acquisition contracts on only $5M of marketing spend.
Operations expense per acquisition close:
$8.4K → $5.0K → $3.0K.
Homes listed >120 days:
Opendoor: 9%
Market: 27%.
Even after the August slowdown, management still guided to:
Revenue +10–15% YoY
Contribution Profit +70–75%
Contribution Margin 3.2–3.5%
7/ THE EQUATION
Institutional ownership ↑
Share count ↓
Short interest ↑
Days-to-cover ↑
Operating efficiency ↑
Price ↓↓
THAT is the divergence.
A falling stock is NOT automatically bullish.
But when price moves in the opposite direction from ownership, supply and operating variables, you get ASYMMETRY.
The next Q3 13Fs matter enormously.
If institutions materially sold, the thesis weakens.
But if ownership stayed near ~59% — or increased again — while 208M shares remain short and the company has reduced supply?
Then this setup becomes much harder to dismiss as “just another falling stock.”
That’s what I’m watching.
Not the candles.
The equation underneath them.
$OPEN @nejatian@rabois@ericjackson@mikealfred@MrAlwaysRugged@mudirshin@MrNeverSell@GMN_watch@urbnsteezus@chuckd1234567@theopendoorguy #ARMY
A few people asked over the weekend what the calls to slow the pace of frontier AI mean for the buildout. Some thoughts:
Even if models never improved from here, just rolling out what they can already do would take more compute than the world can build for years. The debate about how fast AI should be allowed to improve is a fair one to have. It's about future generations of models.
Existing demand is the part I think people are misreading. Anthropic CEO Dario Amodei said in May they'd planned for 10x growth and were running at an 80x pace in the first quarter, and that's why they've had trouble supplying compute. OpenAI president Greg Brockman said in July they'll be in a compute shortage no matter what, and are choosing which products to scale. Google says it's processing 7x the tokens it did a year ago. Hundreds of millions of people use these models today, and most of them use a small part of what the models can already do. And every time more compute comes online, usage steps up again: limits come off for people already using it, customers who were turned away get on, and new use cases show up that weren't in anyone's plan.
Now supply. The constraint is HBM, the memory that sits inside every major AI chip. Three companies make it and all three are sold out this year. A new memory plant takes years to build. TrendForce has HBM shipments growing 50-60% next year. NVIDIA, the biggest buyer of it, expects its revenue to grow about 70% next year and calls that outlook 'supply-constrained', noting its customers' forecasts point closer to 100%. On our own bottom-up work, the memory constraint lands in about the same place as NVIDIA's growth number.
Then the chips need a building with power connected, which takes longer again. Goldmans reckons only about half the US capacity scheduled over the next two years will actually be built on time.
The risk to demand continues to seem heavily weighted to the upside. The risk to supply continues to seem weighted toward less capacity getting built, not more.
$OPEN - I think they made the right move: taking the hit, recycling the capital and avoid repeating past mistakes.
They can now acquire inventory cheaper and, when the market improves, achieve stronger margins.
I bought more $OPEN yesterday.
This is not financial advice.
@mudirshin@nejatian I’ve spent 20 years as senior executive at large companies across several countries, I’ve met many CEOs. In my view, @nejatian is one of the very few with the ability and capability to lead $OPEN to success in such a complex industry and challenging environment.
NFA
@moninvestor $IREN Indeed, even if inference demand grows well below $DELL’s forecast, it makes sense to maximise contract economics today, even with shorter 1-3 year terms. If AI infra demand continues to outpace supply, MW pricing could be higher when those contracts come up for renewal
@AlexfromBabylon I completely agree. The key is to maximise the economics of the agreement ($/MW, prepayment,…) while securing the right contract duration.
A few people have Thursday's numbers tangled, so let me untangle them.
The majority of the $684m loss is the cost of retiring Bitcoin miners as we convert those sites to AI Cloud. Non-cash. The cloud business underneath ran ~87% gross margins (ex D&A).
Every megawatt that comes off mining goes back on at multiples of the revenue. Recent 3-year AI Cloud contracts are at >$20m per MW (IT), more than double late last year.
And the $25-30bn of forecasted FY27 capex isn't an equity number. Customer prepayments can cover about half the GPU capex. Lenders can fund most of the rest. We raised ~$19bn over the last twelve months and only ~$3bn of it was equity. We haven't borrowed a dollar against the data centers yet either.
$4bn of ARR is contracted, with three sites commissioning between now and year end to bring it online. And that's the 2026 story. The real ramp is 2027, when Sweetwater and the next wave of capacity come into play.
It's delivery time.
4/4 A key catalyst could be the disclosure of the customer identity and economics behind the new multi-year agreement with a “Leading Frontier AI Lab.”
This is not financial advice. Do your own research.
$IREN 1/4 After a detailed analysis of IREN’s FY26 results (CY Q2 2026), I believe the unit economics of its latest contracts have improved significantly, with revenue exceeding $20M per MW of IT capacity.
3/4 Combined with IREN’s full-stack strategy and the first tangible evidence of real-world execution — including Microsoft’s acceptance of Horizon 1 — I believe these developments have uniquely positioned $IREN for a potential re-rating over the coming months.