This was one of the highest volatility days in recent crypto history.
Was I long the BTC breakout?
No.
Did I catch the HYPE news?
No.
But do I have a tactical pool of capital that’s ready to deploy with a clear plan if a new trend forms?
Also no.
“Mate, how do you actually use Volume profile or AMT when looking at a chart? Anything more I can learn?"
Ok guys, let's drop the whole framework with the hope that you may find interesting ideas to apply to your journey/trading. (❗️Brutal value below❗️)
Disclaimer: As always, everyone has a different style and the goal is not copying someone else's strategy but building a process that provides statistical advantage over time (after backtesting).
What works for me might not work for you depending on timeframe, goals and availability.
(Quite long post, if you're lazy skip it (but don't expect results/improvments)
🔸 1st step -> Understanding what Volume Profile actually represents.
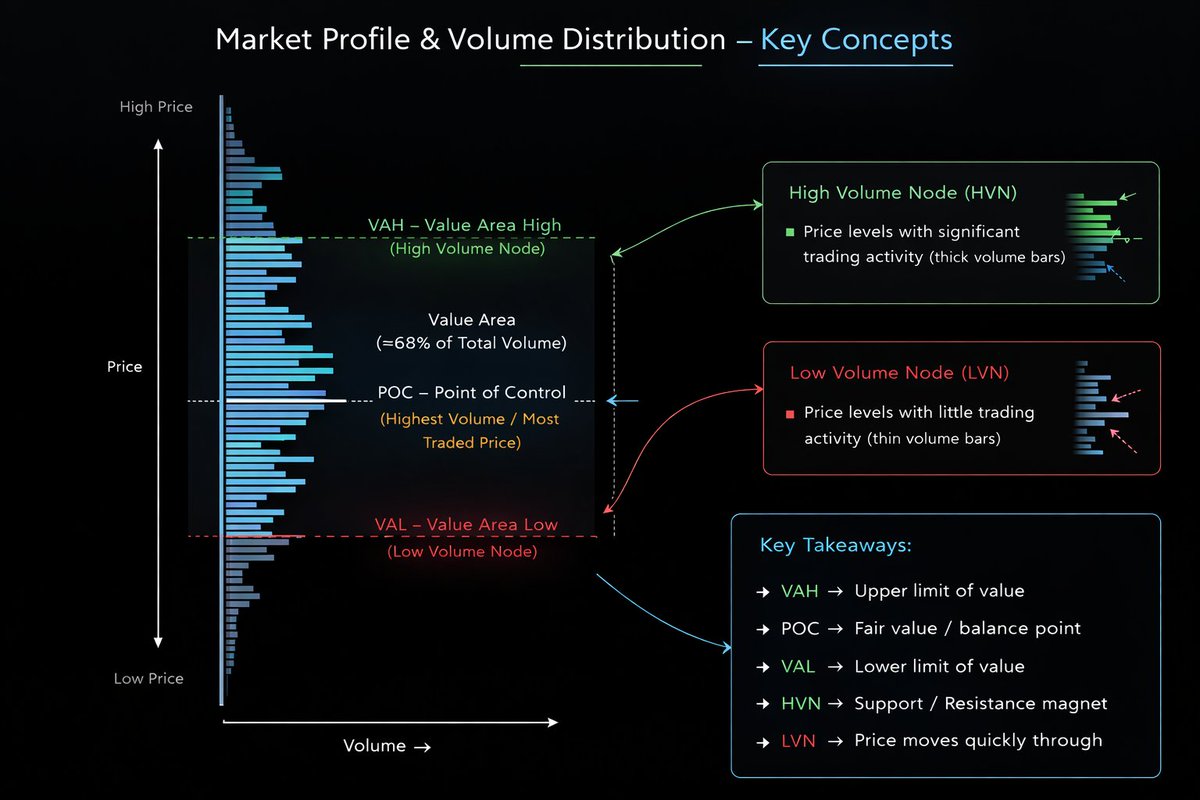
Volume Profile is simply the distribution of traded volume across price levels, not across time like traditional volume bars.
This allows you to see where the market actually accepted value and where it rejected it.
From a basic perspective, there are 3 important elements:
• POC (Point of Control) → the price with the most traded volume
• Value Area (VA) → where roughly 68/70% of the trading activity occurred (divided into VAH and VAL)
• High Volume Nodes (HVNs) → areas of acceptance
• Low Volume Nodes (LVNs) → areas of rejection or inefficiency
HVNs act like magnets for price because they represent equilibrium where buyers and sellers previously agreed on value.
I like to think, instead, about LVNs as "highways" where price tends to move quickly due to the lack of prior transactions.
Already here you can start understanding why the market often accelerates through certain areas and slows down around others.
🔸2nd step -> Auction Market Theory
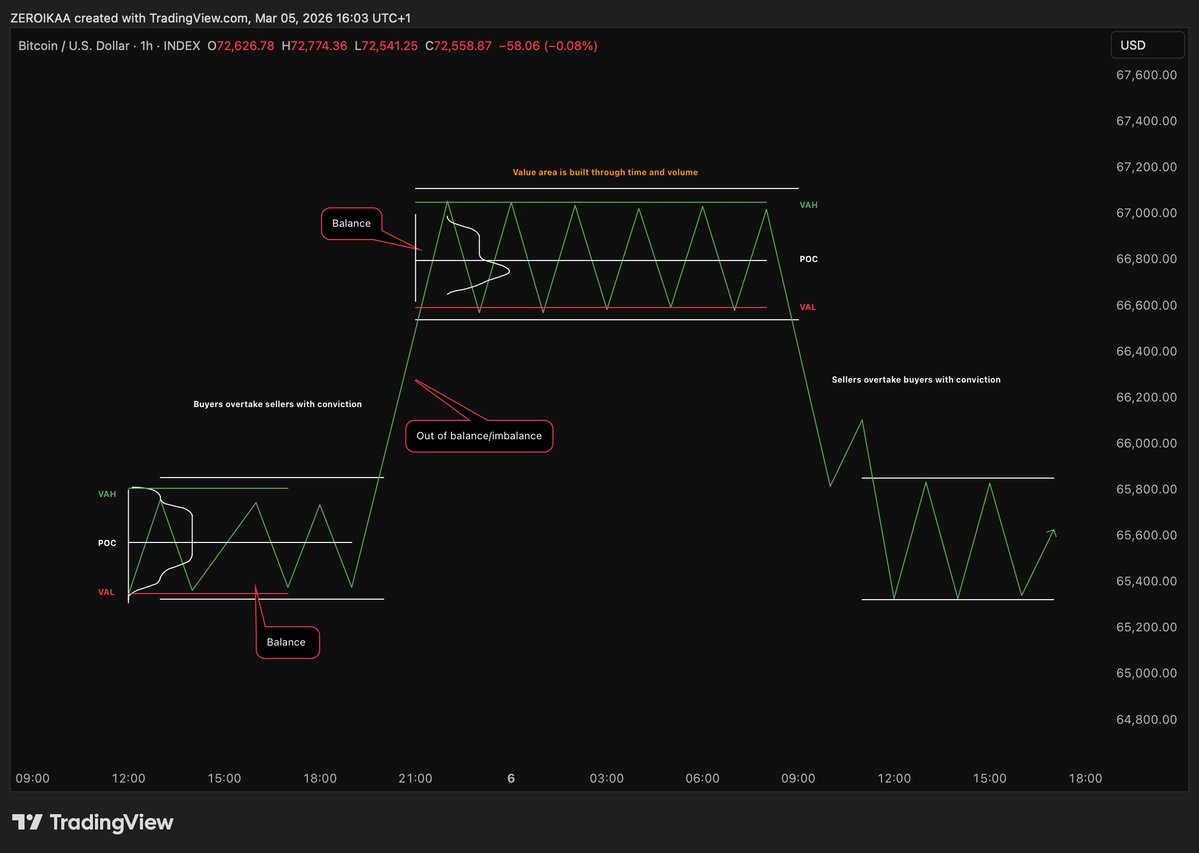
Markets are basically continuous auctions between buyers and sellers.
The market constantly asks a question:
“Is this price fair?”
- If participants accept the price → the market builds value.
- If participants reject the price → the market moves to find a new fair value.
This creates 2 fundamental environments:
- Balance (equilibrium)
Price rotates inside value areas and HVNs.
- Imbalance (discovery)
Price leaves value and searches for a new fair value.
Recognizing when the market is balancing vs discovering is one of the most simple yet powerful concepts in trading.
If the market is balanced → expect rotations.
If the market is imbalanced → expect continuation.
🔸 3rd step -> reading the shape of the profile
This is something that usually gets unnoticed.
Volume profiles often form recognizable structures:
• D-shaped profile → balanced market, rotation
• P-shaped profile → short covering -> bullish continuation
• b-shaped profile → long liquidation -> bearish continuation
• Double distribution → market transitioning between 2 value areas
The shape of the volume tells you what's happening in the auction.
"Eh? What do you mean?"
For example:
A P-shaped profile has higher probability of appearing after aggressive short liquidations where the market rallies and then builds value at the top -> based on context it's a bullish sign -> why? -> If the market holds the upper value area, it suggests that after shorts were squeezed, new buyers are accepting higher prices.
A b-shaped profile usually appears after longs get trapped and forced to exit -> based on context it's a bearish sign -< why? -> If the market accepts lower prices after the liquidation, it suggests new sellers are active, not just liquidation.
These structures help you understand who is trapped and where liquidity might sit, forming a bias.
🔸4th step -> Identifying volume voids
One of the most powerful concepts is the Volume Void.
These are areas where very little volume was traded.
Because the market previously rejected those prices quickly, when price re-enters these zones it often moves very fast.
You will see tht volume voids frequently align with:
• FVGs
• Impulsive candles
• Liquidity sweeps
When multiple inefficiencies overlap, the probability of fast price movement increases significantly, so you can use them to your own advantage.
🔸 5th step -> Value migration
Another key AMT concept is observing how value shifts over time.
- If the POC and value area move higher, the market is accepting higher prices → bullish context.
- If value migrates lower, the market is accepting lower prices → bearish context.
In this GBP/USD example I made you can clearly see the migration of value + the concepts explained.
However, in my experience the real edge comes when price moves away from value too aggressively.
Markets tend to revisit previous value areas because auctions like to rebalance unfinished business.
That's why many large moves eventually retrace toward prior POCs or HVNs.
🔸Sixth step -> Combining VP with price action
Volume Profile alone is not enough, nor it will ever be.
It becomes powerful when combined with:
• S&D zones
• Liquidity pools
• MS (HH/HL or LH/LL)
• FVGs or inefficiencies
Example:
Price sweeps liquidity above a swing high → enters a LVN → rejects from a HTF supply zone.
That confluence creates a much stronger trade idea than using any single tool, in my experience.
The profile simply provides context about where the auction is strong or weak.
🔸 Seventh step -> Execution
The most important step, isn't it?
Once the levels are mapped, I usually monitor:
• Reactions at HVNs or POCs
• Fast moves through LVNs
• Acceptance or rejection outside value areas
• Value area shifts
- If price re-enters value after a breakout, there's a high probability of a rotation across the value area.
- If price accepts above or below value, the market has a higher probability for starting a new auction.
Based on this I plan my longs and my shorts but also (and that's probably the most important part) I adjust the stop loss in a dynamic manner, meaning that I wait for the price to test and to be rejected from a value area before moving my stop depending on my bias (long🔼 or short 🔽)
That’s basically the framework I use when incorporating Volume Profile and AMT into my analysis.
It's pretty much logical that you need time to assimilate these concepts, but to me and for my style they're the best I can use, so I highly encourage you to study them.
They don't replace price action, but they reveal the structure of the auction behind it, which is 🔑
As always, if you found this helpful, the like and repost buttons are just a few centimeters below.
I'll eat my 👞 with colorful sauces if there's no new ATH for BTC by Q1 2025. I'll eat my other 👞 if there's no elites-induced black swan "event" by Q4 2025.
The NPC theory: “most people” don’t really have deep inner lives where they yearn for meaning and purpose, they’re just incentive-following automatons who will do whatever satisfies their hardwired drives. Just sheep following the trends.
My favourite quote from Hagakure
"A man does not think of victory or defeat. He plunges recklessly towards an irrational death. By doing this, you will awaken from your dreams."
You're going to die anyway. Stop playing it safe.
$BTC [update]
"If you can't break the highs, you are going to come for the lows".
All the macro POI's remain the same.
Also highly advice everyone to watch this video in case we go lower:
https://t.co/hWVwgVXVaw
Friendly reminder that the next high probability setup is not going to make you rich.
Correct trading behavior is what is going to make you rich.
The person that is currently trading with a $10 risk per trade and follows his exact trading plan and rules consistently will outperform the trader that is currently trading with a $1000 risk per trade while lacking sticking to his set of rules.
It is just a matter of time.
The Joy Reset: How Elite Athletes Turn Every Point into an Opportunity
“In the Modern Wisdom episode “How to Find Meaning When Life Feels Overwhelming”, Simon Sinek uses tennis as a metaphor for sustained high performance in any field. He contrasts “good” players with the very best in the world, identifying a subtle but decisive difference in their mental approach.
For Sinek, greatness is not defined solely by talent, technical skill, or even physical conditioning—it’s about emotional reset. After a point is played—whether it was a triumph or a disaster—elite players immediately return to a mindset of joyful engagement. He describes how the very best respond internally with something like: “That was fun. I love this.” This response is identical whether they just hit a perfect winner or committed a double fault. The key is not neutrality—it’s positive emotional consistency.
Most players, even professionals, allow the previous point to influence the next. After a good point, they may feel overconfident or try to force another perfect shot. After a bad point, they may dwell on frustration or self-criticism. This variability in mindset creates mental noise, subtly shifting focus away from execution and toward emotional self-management—burning mental energy that could be conserved for the game itself. The elite athlete’s approach—resetting to a joyful, curious state—keeps their attentional bandwidth entirely on the present point. Over time, this reduces cumulative mental fatigue and maintains optimal decision-making under pressure.
At its core, Sinek’s observation is about emotional reframing—deliberately shifting perception so that each moment is seen as an opportunity rather than a continuation of past results. This prevents the compounding effect of negative emotions, sustains intrinsic motivation, and allows for greater adaptability when circumstances change. It’s a proactive choice: every “point” can either be shadowed by the past or infused with the lightness of starting again.”
Now apply this to trading.




![Larskooistra_'s tweet photo. $BTC [update]
"If you can't break the highs, you are going to come for the lows".
All the macro POI's remain the same.
Also highly advice everyone to watch this video in case we go lower:
https://t.co/hWVwgVXVaw https://t.co/fvx2o2RtvB](https://pbs.twimg.com/media/G1OFpzQXoAA9IYT.jpg)









![Larskooistra_'s tweet photo. $BTC [update]
"If you can't break the highs, you are going to come for the lows".
All the macro POI's remain the same.
Also highly advice everyone to watch this video in case we go lower:
https://t.co/hWVwgVXVaw https://t.co/fvx2o2RtvB](https://pbs.twimg.com/media/G1OGEKuWkAAGNlK.jpg)


