Thanks man, appreciate it. Before you burn a weekend on it, a few honest pointers.
First the disclaimer. I'm a scalper. This is not a signal and I don't backtest it as one. I use the maps to know who's holding the flag so my own decisions have context. If you code "buy green, sell red" and run it, you'll get a coin flip and I'll have wasted your weekend. Test the read, not a trade.
How the Zones Are Actually Built
(I said ATR in the article, this is more precise):
Every 30 minutes a new map. The open of that 30 min is the neutral line.
Look back at the last 40 maps. For each one, measure how far price ran above and below its open. Take the strong-ish run, roughly the 70th percentile of those, scaled up a bit. Call that the impulse.
Levels sit at ~38% and ~62% of the impulse above and below the open. Those are the flag zones. Green above, red below. They snap to where prior runs stalled and where volume piled up, so they're not perfectly symmetric.
100%, 127%, 162%, 200% of the impulse are the extremes. The dashed lines.
So the flag is basically "a normal push off a 30 min open lately", and the extremes are "further than NQ usually goes in 30 minutes right now". That's all it is. No magic number.
If you don't have Sierra, the poor man's version gets you 90% there: 30 min open plus/minus 0.4x the median 30 min range of the last 40 periods for the flag, 1.0x and up for the extremes.
What to Actually Test
A capture is a close through the zone, not a wick. Score every map as green held, red held, both, or nobody.
The question is conditional. After a map where red held, what does the next map do? Does it close below its own open more often than chance? Does red capture again more often than a shuffled sequence would? That's the whole idea in one test.
Log the both and nobody maps too. That's the sit-out signal and it's half the point.
Split the 9:30 map from the rest. Split overnight from RTH. They're different animals.
Use years, not weeks. 20 days tells you nothing about anything, and I've been loud about that this week.
Expect a small number. If this printed a fat edge on its own I'd be running it as a bot instead of sitting here clicking. What it gives me is fewer stupid trades, and that's where my money actually comes from.
Post what you find, good or bad. Especially bad.
@RinaTrader The indicator is custom built in sierra charts, the bubbles are my own image edits to show the price action - the indicator only prints the zones every 30 mins.
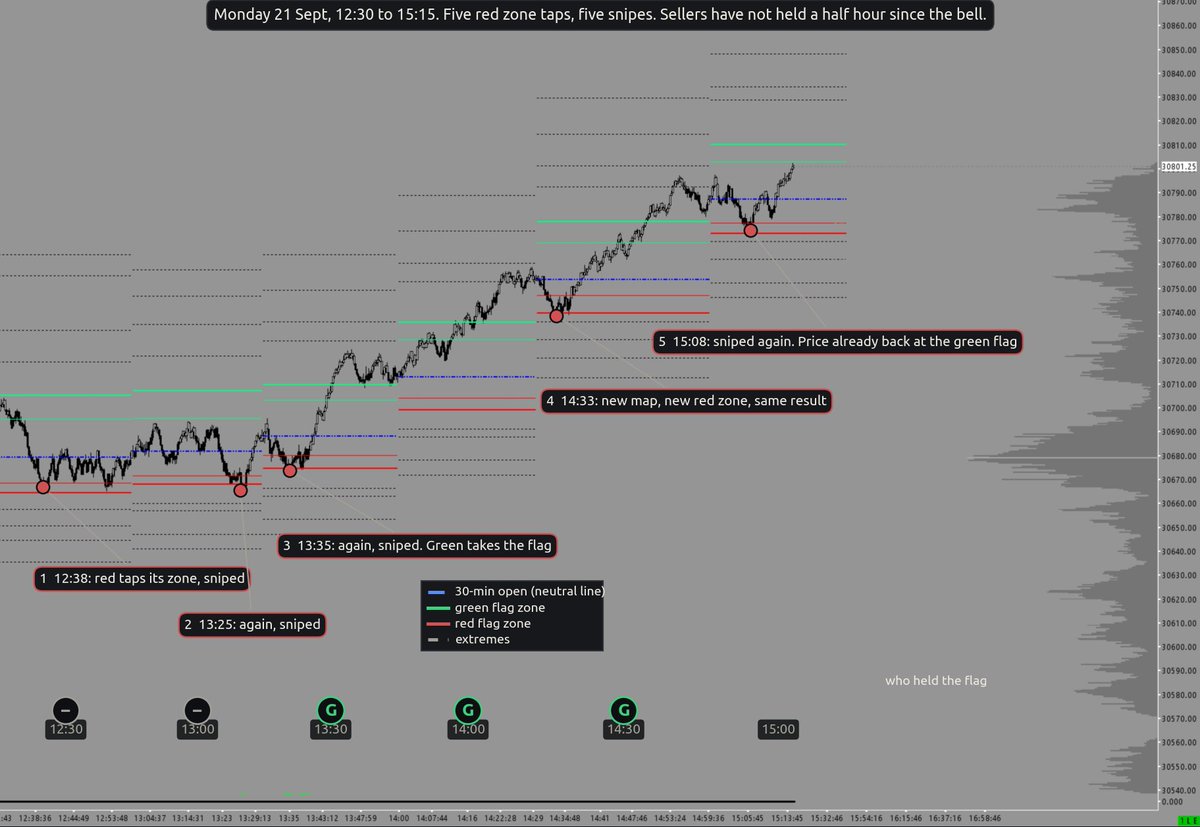
Sellers haven't learned their lesson all day.
12:38 Tap the red zone, sniped. 13:25 Tap it again, sniped.
13:35 One more time, sniped, and green takes the flag.
14:33 They show up at the new red zone, sniped, green runs 60.
15:08 They try again, sniped, and price is already back knocking on the green flag.
Five straight maps. Same play from the sellers, same result. They walk into the red zone, the snipers are waiting, green captures again and the next map spawns higher.
This is the whole thing. You don't need to know why they keep doing it. You need to notice they keep losing at the same spot and stop being one of them.
One half hour left. Sellers haven't held a single one since the bell. Until they do there's nothing to short here.
sorry man, been there more than once. but that red box is where sellers should have been. today's price is where they actually were, which was nowhere. not one 30 min window
closed below its open all day. next account, before you click, ask who held the last 30 minutes. not who should have. who did
LOL, why the fuck were you shorting?
Look at your own entries: 30224, 30357, 30403. Every one of them is the low of a pullback. That's the spot where the buyers were stepping in all day. 10:05 especially, that's price tapping the red zone and getting bought. You sold to the guys who were about to run it 120 points.
Not one 30-minute window closed below its open after the bell. Sellers got shot in the same spot eight times today. So the short signal wasn't coming from price. It was coming from "it's gone up too much." That's a feeling, not a signal.
Shorts didn't stop working today. They never started. Flip the boxes upside down and you had three winners.
lol the whole day was one question. who held the last 30 minutes? buyers, every single time since the bell. sellers tapped the same spot at 10:05, 10:43, 12:03, 12:38, 13:25, 13:35 and got shot every time
if you weren't long you were shorting pullbacks against a team that hasn't lost a single map all day. that's not trading, that's donating
Red held its flag at 8:30 and 9:00, then never again. 9:30 pullback stopped at neutral and green ran 190. Every pullback after that landed in the red zone and got sniped, 10:05, 10:43, 12:03, 12:38, 13:25, 13:35. Levels get smacked when sellers can't hold anything for half an hour.
Been there. Took me years to stop doing this exact thing.
NQ didn’t close a single 30m candle below open all session. Every pullback to the same level got swallowed immediately, 12:03, 12:38, 13:25, 13:35. Sellers couldn't hold ground for 30 minutes.
If you blew an account today, it wasn't because the tape was tricky. It’s because you tried to pick tops all day instead of just accepting buyers were in control.
Next time, stop trading what you think should happen and look at who's actually holding the tape.
The daily breakout is the headline. The intraday is how it actually got there.
NQ never closed a single 30 minute window below its open after the 9:30 bell. Four pullbacks, all stopped in the same spot, all bought. 12:03, 12:38, 13:25, 13:35. Sellers didn't hold anything for even half an hour.
That's what a real breakout looks like from the inside. Not one big candle. Thirty minute windows stacked on top of each other with nobody able to knock one down.
500 up and not one 30 minute window closed below its open. That's the crazy part to me. Every pullback landed in the same spot, a normal half hour's dip below the open, and got bought there. 12:03, 12:38, 13:25, 13:35.
Sellers never held anything for even half an hour.
Days like this aren't hard to trade. They're hard to not overthink.
Same picture on NQ. Since the 9:30 bell it has not closed a single 30 minute period below where that period opened. Every pullback stopped in the same spot, a normal half hour's dip below the open, and got bought there. 12:03, 12:38, 13:25, 13:35, four for four.
That's my definition of efficient: not how fast it goes up, but that the sellers never got to hold anything for even 30 minutes. Your ATR trail is saying the same thing on a different clock. On days like this the only decision is how much of the ride you're willing to sit through.
This is the same thing I'm doing with a different ruler. You measure the pullback in points, I measure it in where it stops on the map.
Today your 15 point pullbacks were price dipping to the neutral line. Your 50 pointers were the ones that reached the red zone. Every one of those got sniped and green took the flag again. 12:03, 12:38, 13:25, 13:35. Same four you were buying.
The bit I'd add: the first 30 to 60 minutes tells you the size of the pullback, and the flags tell you when the pullback stops being a pullback. The day red actually holds its zone through a map end, the 50 point dip is the start of the reversal, not the entry. That's the one thing the point count alone can't tell you.
Blindfold days are the best days. Just take it off every 30 minutes.
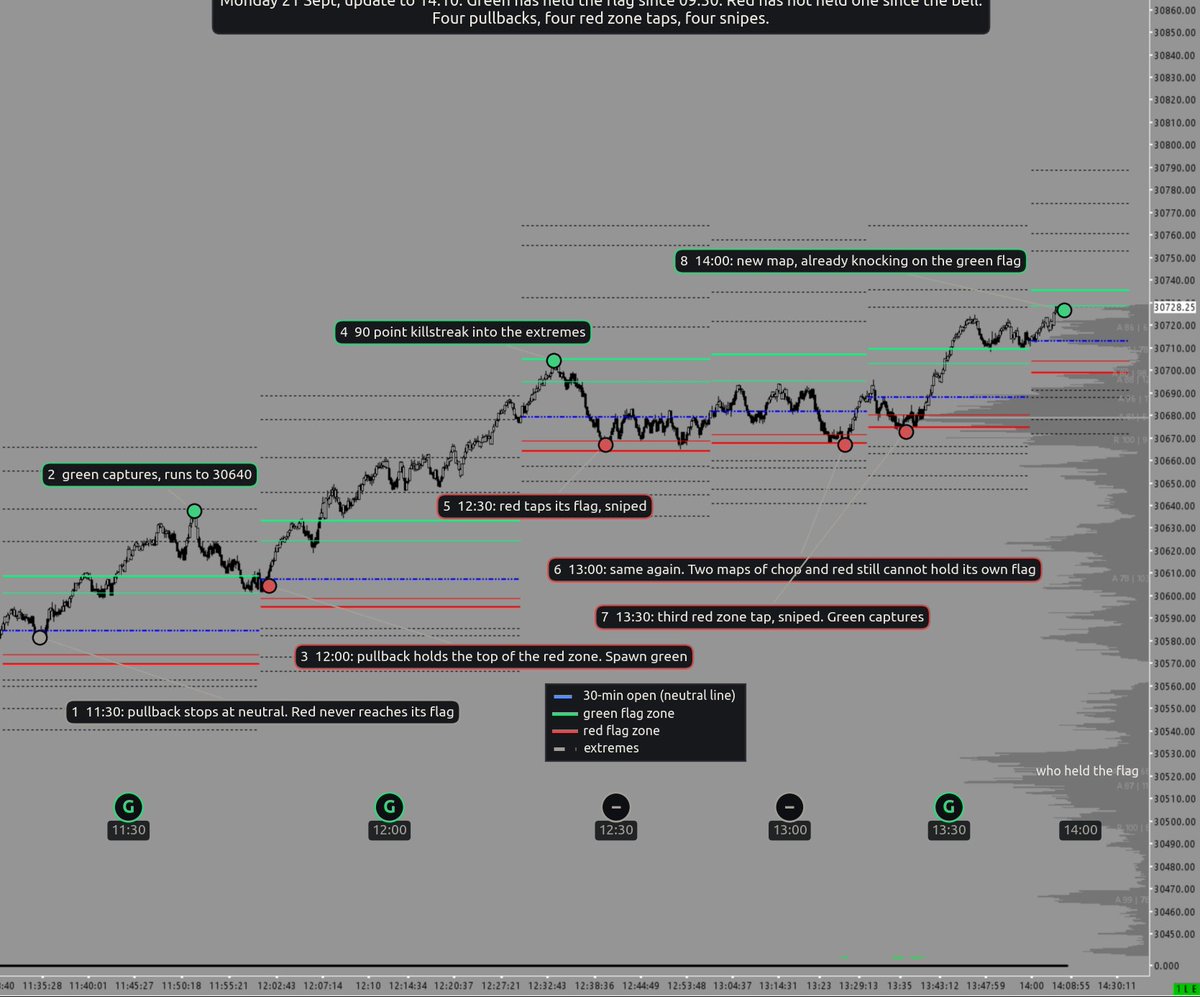
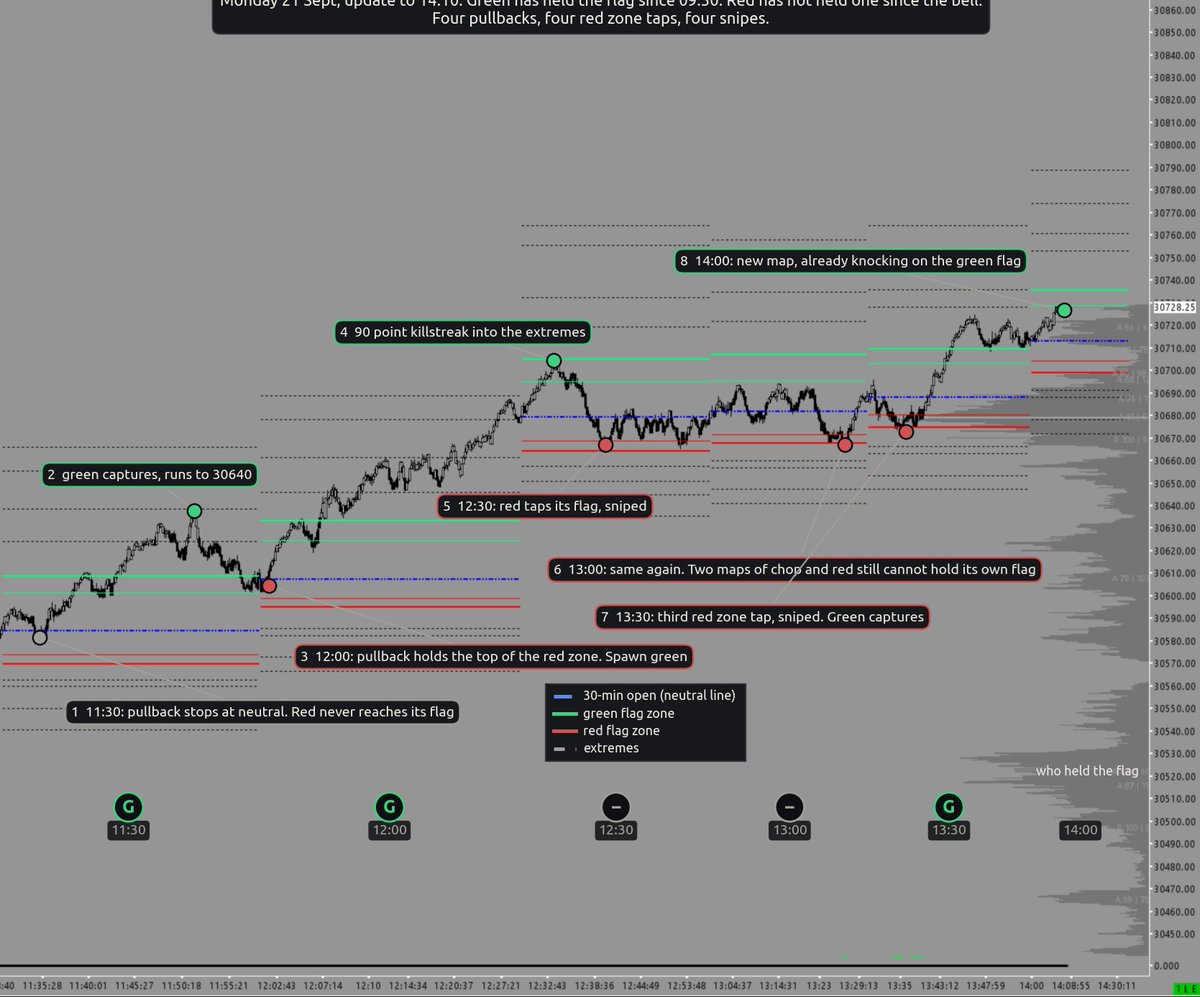
Update: Green is still in full control. Hope nobody was shorting.
11:30: Pullback stops at neutral; red can't even reach its flag. Green captures and runs to 30640.
12:00: Pullback holds the top of the red zone. Snipers waiting. Green rips 90 points into the extremes.
12:30 & 13:00: Two maps of chop. Nobody holds a flag. That's the sit-on-your-hands signal, not the short signal. And look where both pullbacks stopped: Red zone. Sniped both times.
13:30: Third red zone tap. Sniped. Green captures again.
14:00: New map spawns, and price is already knocking on the green flag.
I've said this before: we complicate the chart. RSI, delta, VWAP bands, three EMAs, some oscillator somebody sold us. Every one of them gave you a reason to short today. Overbought. Divergence. Extended from the mean. Pick your poison.
Price does not lie. Since the 09:30 bell, red has not held a single flag. Not one. Every time red showed up at its own zone, the snipers were already there. There were no shorts today. Not one map said short. The indicators said short. The price said green, and it's been saying it for four and a half hours.
Two maps of chop is not a reversal—it's the winning team catching its breath. The reversal is when red actually holds its flag through a map end. Until that prints, you're either green or flat. That's it.
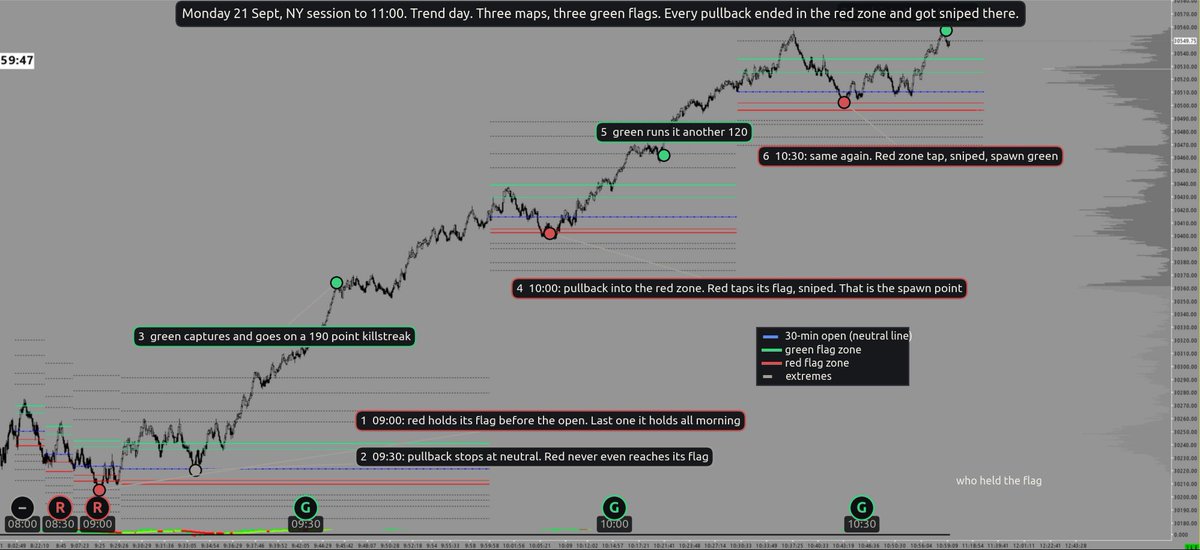
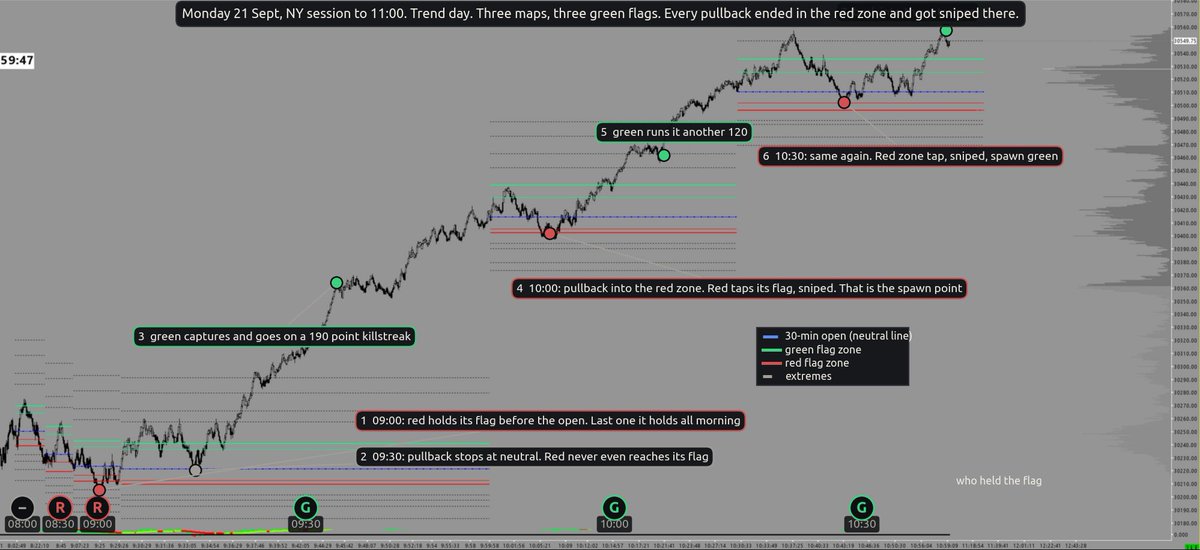
Trend day, capture the flag edition. NY session, Monday.
Red held its flag on the 08:30 and 09:00 maps. Then the bell rang and it never held another one.
09:30: the pullback couldn't even reach the red flag. Stopped at neutral. Green captured and went on a 190 point killstreak.
10:00: pullback into the red zone. Red taps its flag, gets sniped, green runs another 120.
10:30: same script. Red zone tap, sniped, back into the extremes.
Here's the part that matters on days like this. Once green has held the flag two maps in a row and every new map spawns higher, the red zone stops being red's flag and starts being your spawn point. It's where the pullback runs out. Red shows up to take its flag, the snipers are already there, and that's the cleanest place on the map to join green.
You're not buying because it's red. You're buying because red keeps failing there and green keeps winning the map. The colour tells you where. The last three maps tell you who.
Chasing green into the extremes gets you shot. Waiting for red to fail at its own flag gets you in with the team that's actually winning. Same trend, different spawn.
#NQ #Futures #Sierrachart #TradingEducation
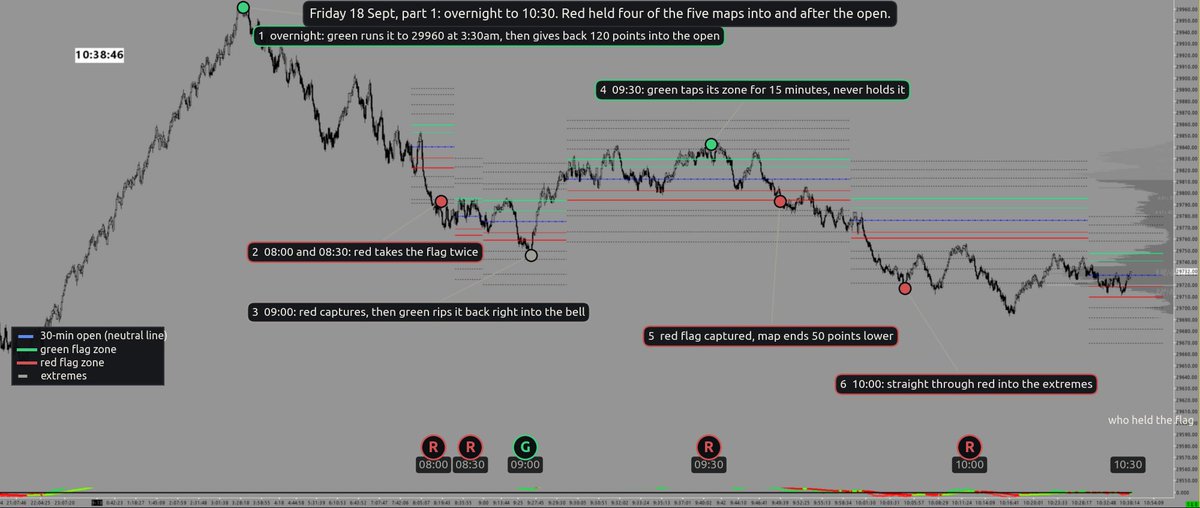
Full Session, Capture the Flag Edition.
Friday, Opex.
Overnight green ran it to 29960 at 3:30 AM and then handed 120 points back into the open. Sets the mood.
08:00, 08:30: Red takes the flag twice before the bell. 09:00: Red captures again, green rips it back right into the open. 09:30: Green taps its zone for fifteen minutes and never holds it. Red flag captured, map ends 50 lower. 10:00: Straight through red into the extremes.
Six maps. Red held five. If you were spawning green all morning you were spawning with the team that couldn't get past neutral.
10:30: Red taps its flag and gets sniped. Green takes it and runs to the extremes. First green flag of the day. 11:00: Nobody. 11:30: Red. 12:00: Red runs it to 29660, the session low, then green drags it all the way back to neutral before the map ends.
That's the moment. Red just went to the extremes and couldn't keep any of it. Why is green suddenly holding? Ask the question.
12:30: Green captures. 13:00: Green. 13:30: Green. 14:00: Red taps its flag, sniped, green rips it. 14:30: Green killstreak, 70 points into the extremes. 15:00: Chop at the flag, nobody. 15:30: Green takes the flag and runs 110 points into the close. 16:00: After the bell, green again to 29990.
Eight maps after the turn. Green held seven.
Red owned the morning. Green owned the afternoon. The switch was on one map at lunch and the maps told you before the candles did.
You don't need to predict the switch. You need to notice it and stop spawning with the losing team.
$NQ #futures
https://t.co/wJXK2dgI3I
Thanks man, appreciate it. Before you burn a weekend on it, a few honest pointers.
First the disclaimer. I'm a scalper. This is not a signal and I don't backtest it as one. I use the maps to know who's holding the flag so my own decisions have context. If you code "buy green, sell red" and run it, you'll get a coin flip and I'll have wasted your weekend. Test the read, not a trade.
How the Zones Are Actually Built
(I said ATR in the article, this is more precise):
Every 30 minutes a new map. The open of that 30 min is the neutral line.
Look back at the last 40 maps. For each one, measure how far price ran above and below its open. Take the strong-ish run, roughly the 70th percentile of those, scaled up a bit. Call that the impulse.
Levels sit at ~38% and ~62% of the impulse above and below the open. Those are the flag zones. Green above, red below. They snap to where prior runs stalled and where volume piled up, so they're not perfectly symmetric.
100%, 127%, 162%, 200% of the impulse are the extremes. The dashed lines.
So the flag is basically "a normal push off a 30 min open lately", and the extremes are "further than NQ usually goes in 30 minutes right now". That's all it is. No magic number.
If you don't have Sierra, the poor man's version gets you 90% there: 30 min open plus/minus 0.4x the median 30 min range of the last 40 periods for the flag, 1.0x and up for the extremes.
What to Actually Test
A capture is a close through the zone, not a wick. Score every map as green held, red held, both, or nobody.
The question is conditional. After a map where red held, what does the next map do? Does it close below its own open more often than chance? Does red capture again more often than a shuffled sequence would? That's the whole idea in one test.
Log the both and nobody maps too. That's the sit-out signal and it's half the point.
Split the 9:30 map from the rest. Split overnight from RTH. They're different animals.
Use years, not weeks. 20 days tells you nothing about anything, and I've been loud about that this week.
Expect a small number. If this printed a fat edge on its own I'd be running it as a bot instead of sitting here clicking. What it gives me is fewer stupid trades, and that's where my money actually comes from.
Post what you find, good or bad. Especially bad.
Basically I backtested your model. It doesn't work.
763 NQ days, 1m data. Coded it exactly as written: sweep, neckline break, FVG entry, stop past the wick, target the other pool. 442 trades, 10% hit target, lost 0.13R a trade,
negative in every parameter set I tried.
FVG fill rate is 90%. So is any random bar low. It's noise.