Clap de fin du #30DayMapChallenge avec 27/30 cartes 🎬
Encore une super édition avec d’extraordinaires réalisations venues des quatre coins du monde 🌍
Hâte de remettre ça l’année prochaine pour découvrir toujours plus de belles cartes !
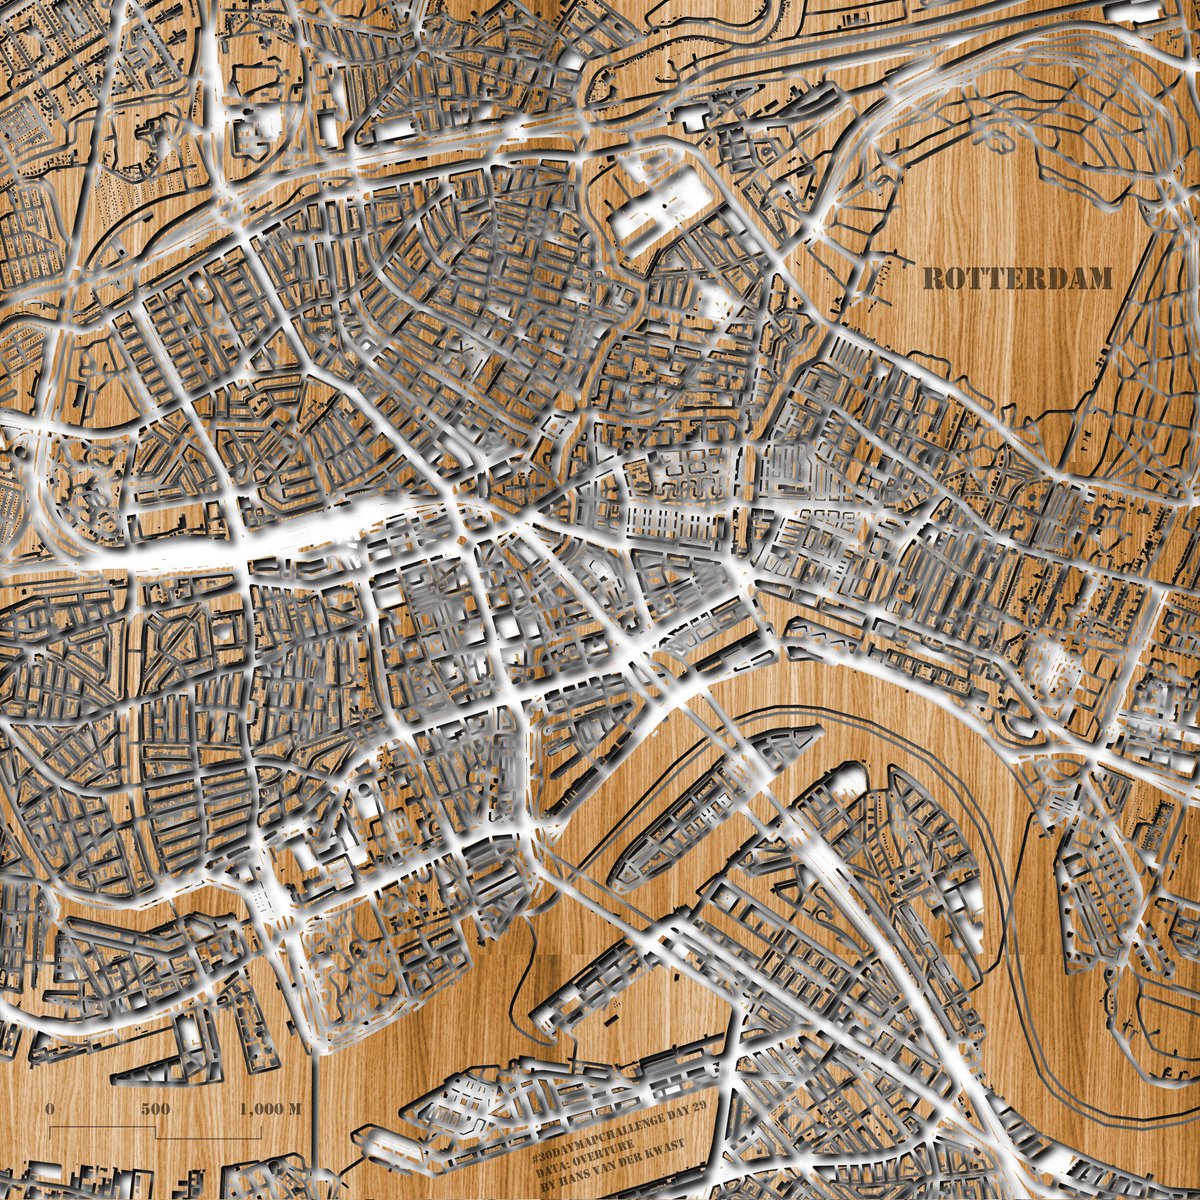
#30DayMapsChallenge Day 29, Data: #Overture🗺️
For today's theme, I've crafted a map of #Rotterdam, the Netherlands, that looks like it's carved out of wood.🪵
Made with #QGIS.
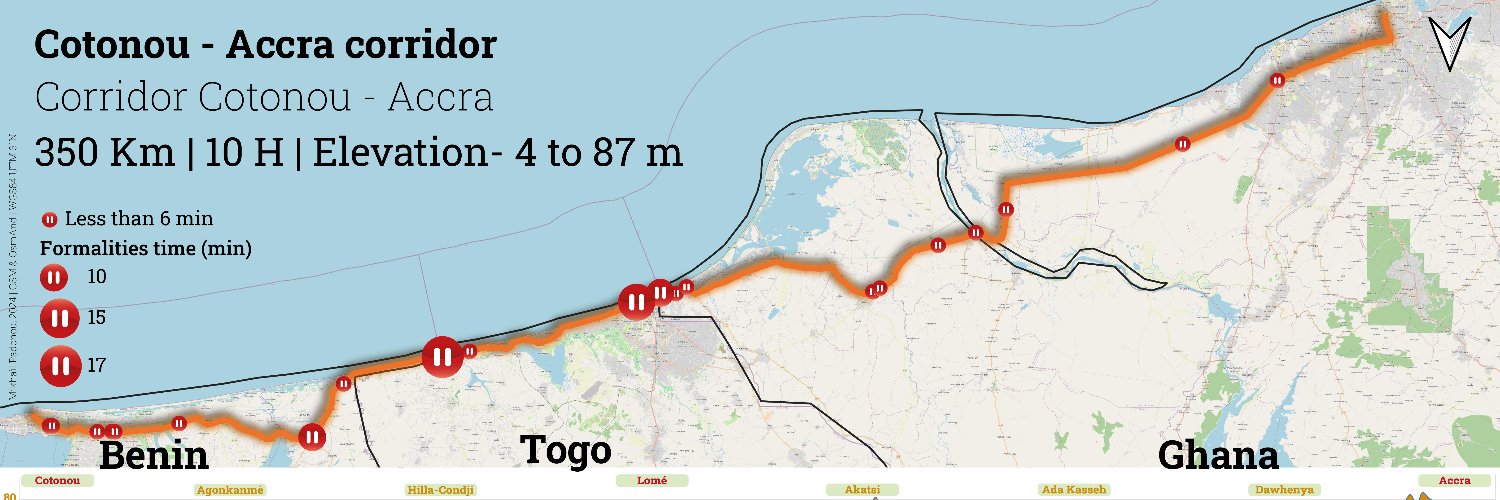
Here I am at the end of my third #30daymapchallenge, which has enabled me to discover the world through the artistic fingers of the many cartographers who have really made an impact on me and to whom I say a heartfelt thank you. Here are my most popular maps:
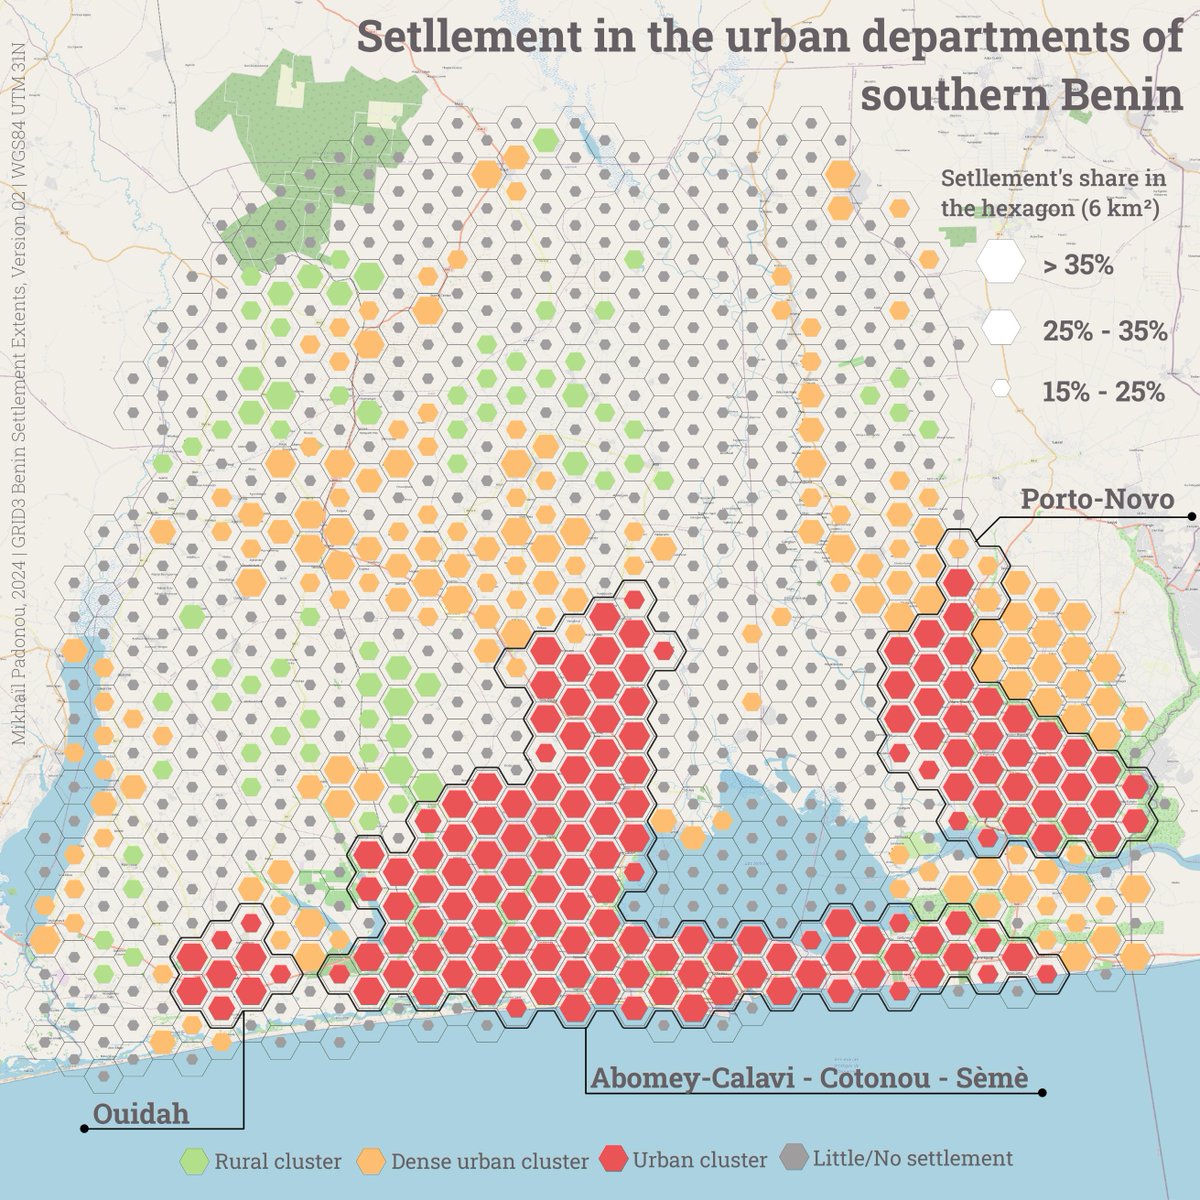
Day 30: The final map | After making 3 maps to explore the past and present of the city of Cotonou, Benin, to close this #30daymapchallenge 2024, thanks to data from @OvertureMaps I'm offering this map which reveals the traces of history on the density of the city's buildings.
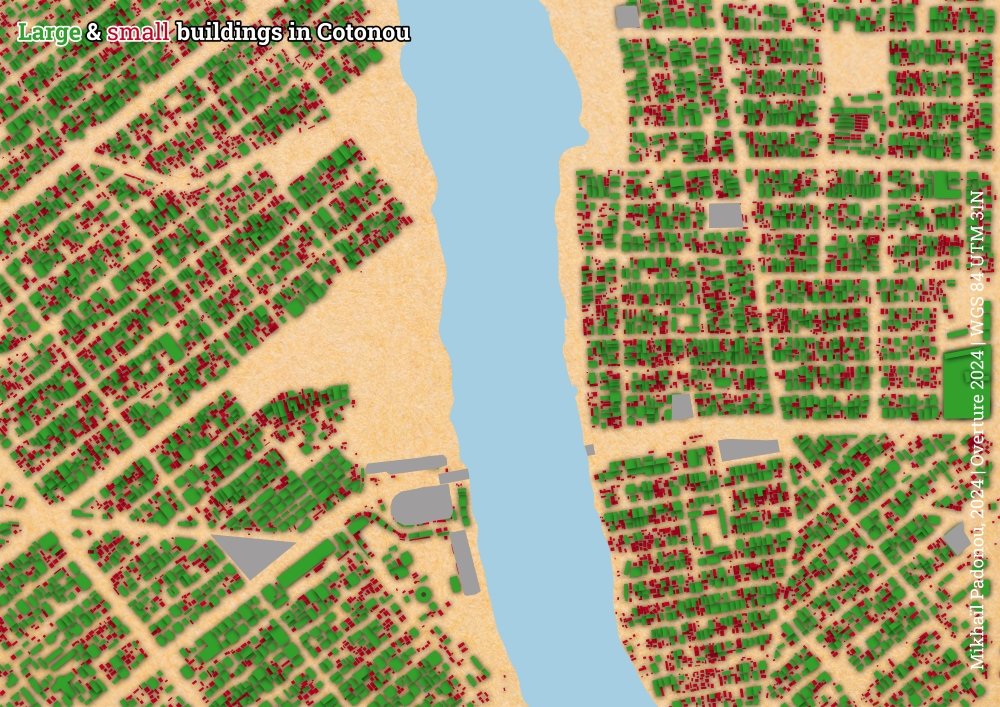
#30daymapchallenge Day 29: Data Overture | After getting out of my comfort zone, I managed to mobilise the impressive data of @OvertureMaps to propose this map of Cotonou's buildings according to whether they have a surface area below or above the average of 110 m².#GIS#dataviz
Technical Relationship Consultant James Armstrong provides geospatial context to one of the most extreme and isolated parts of the world oceans, using topographic data from OSM and bathymetry data from GEBCO.
For Day 28 of the #30DayMapChallenge - The Blue Planet.
#30DayMapChallenge Day 28: The Blue Planet 🌍
I've created globes with rivers from #HydroSHEDS & bathymetry from Ocean RGB raster tile in #QGIS using the @MapTiler & Globe Builder plugins. Check out the beauty of our planet's waterways & ocean depths! 🌐💙
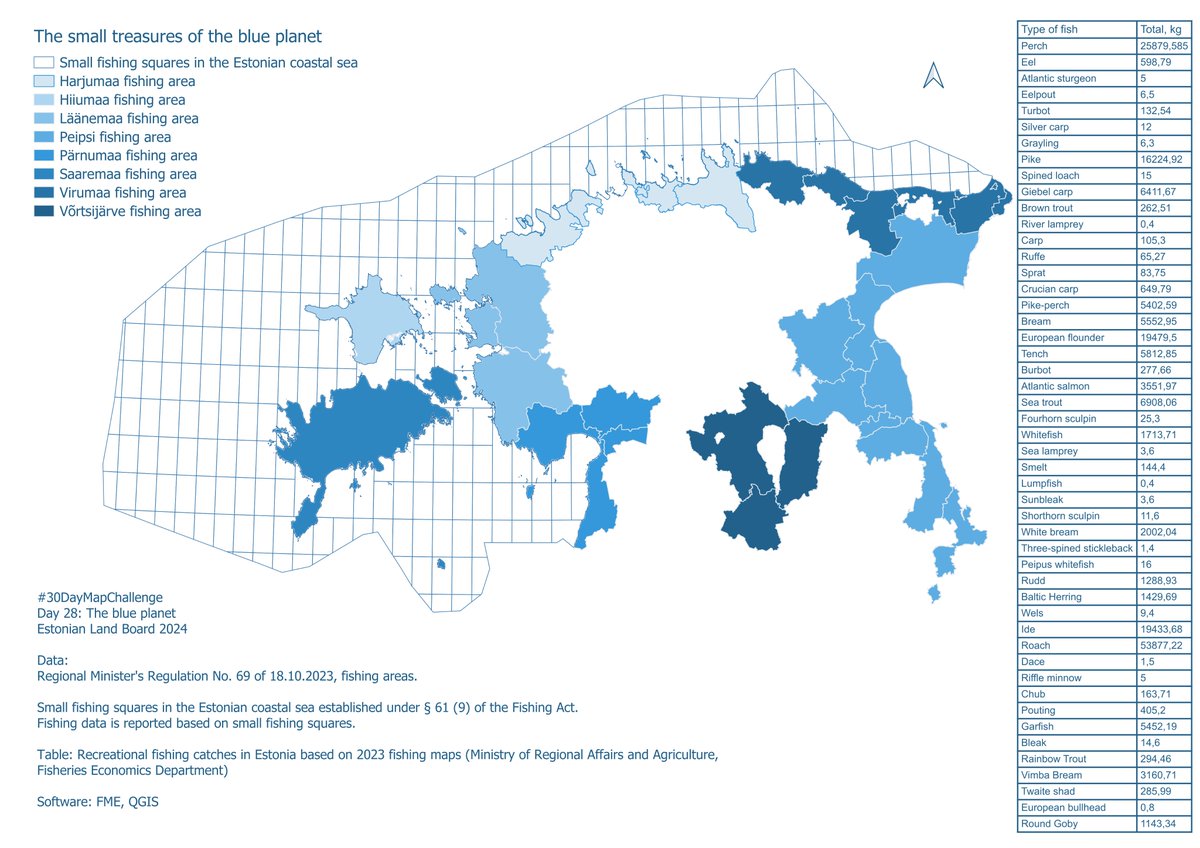
#30DayMapChallenge Day 28 category: The blue planet. The small treasures of the blue planet. Map describes Estonian fishing areas, species richness and recreational fishing quantities.
#30daymapchallenge Day 27: Micromapping | For this theme, I'm proposing a map of tree density on the campus of the University of Parakou (Benin), where I'm currently doing my PhD studies, to help plan tree planting more effectively.#GIS#dataviz#gischat
#30DayMapChallenge 2024 Day 26: Map projections
A map projection is a mathematical technique that shows the Earth's curved surface on a flat map, such as a computer screen or paper map. It involves converting the Earth's 3D shape into a 2D form.
#QGIS#naturalearth#projection
🗺 Projection inhabituelle (Fuller, dite en anglais Dymaxion map)
#30DayMapChallenge - J26 : Projections cartographiques
Réalisée grâce à un fond mise en ligne par Justin Kunimune, retravaillé sur Illustrator
#map
#30DayMapChallenge day 26 - ↑↑↓↓←→←→BA<START> Map projections can be complicated. Sometimes, you need cheat codes to work with projections or circumvent coordinate transformation issues, but we have the next best thing in our toolkits: the PROJ library!
#30DayMapChallenge J26 #Map_projections
La projection est le premier mensonge cartographique, parce qu'elle déforme les surfaces et les angles pour permettre une représentation plane d'une surface qui ne l'est pas. Si les cartographes connaissent bien le Lambert 93, projection officielle en France métropolitaine, les projections propres aux territoires ultra marins sont moins connues. Petit récapitulatif en carte.
✍️ Abigaïl Rabinovitch @abigail2154 (Source : IGN, DITTT Nouvelle Calédonie)
#30daymapchallenge · JOUR 26 : "Projections cartographiques" 🇦🇶
📐 Cette projection (conforme de Lee) est construite sur un tétraèdre. Ici, elle est centrée sur le pôle Sud, tandis que le pôle Nord est éclaté aux 3 coins de la carte.
#cartographie#map#carte#antarctique